
Abstract
This study investigates an ancient Chinese archway of significant historical and cultural value and systematically analyzes its mechanical response under vehicle collisions to provide a scientific basis for its protection. First, scenarios were simulated in which a small vehicle traveling at 10–30 km/h collided with the archway at a 90° angle. Based on this, additional simulations were conducted involving a small vehicle traveling at 30 km/h impacting the central and side columns at angles of 0°, 30°, and 60°. Further, the effects of a truck traveling at 30 km/h colliding with the archway at angles ranging from 30° to 90° were examined. The results indicate that when a small vehicle traveling at 30 km/h strikes the side columns at a 90° angle, the archway collapses. If the central column is impacted, diagonal cracks appear on the front plaque of the archway. However, at impact angles of 30° and 60°, the damage from small vehicles is relatively minor and does not lead to catastrophic failure. In contrast, trucks traveling at 30 km/h cause more severe damage across different angles, demonstrating that truck impacts are significantly more destructive than those from small vehicles. Additionally, the damage caused by collisions with the central column is less severe than that caused by impacts to the side columns. These findings provide an important reference for developing targeted protective measures for ancient archways.
Introduction
As an important material carrier of traditional Chinese culture, an archway not only embodies rich historical information and profound cultural significance but also represents a treasure of the world's ancient architectural heritage. With the acceleration of modernization, many ancient archways face unprecedented threats, including natural disasters, environmental pollution, urban expansion, and traffic accidents. In particular, damage caused by vehicle impacts has become a pressing issue that cannot be ignored. As shown in Figure 1, the impact of a vehicle on an archway can be nearly devastating, with irreparable consequences for both the structure and human safety. Cao et al. 1 systematically identified and classified key issues in the protection of ancient Chinese buildings and proposed targeted protection strategies. Garcia et al. 2 examined the threat posed by fire to cultural heritage and historic buildings, emphasizing the importance of this challenge in the 21st century. Their study assessed fire risks, developed conservation strategies, and outlined response measures in case of fire. He et al. 3 preserved an ancient pagoda of significant historical and cultural value by installing integral isolation supports. Zhu et al. 4 conducted experimental studies and in situ tests on the impact of traffic-induced vibrations on ancient sites. They monitored vibration effects, analyzed propagation and attenuation characteristics, and proposed a preliminary selection range of technical parameters for vibration isolation barriers to protect ancient sites from traffic-induced damage.

Vehicle impact archway. (a) Tongchuan stone archway before and after being hit. (b) After the Hong Kong archway was hit. (c) Changtai Ming stone archway before and after being hit.
Fu et al. 5 evaluated and analyzed the vulnerability of structures under axle collisions and investigated the influence of oblique collision angles using a validated model. Chen et al. 6 reviewed research on axle collisions, summarized the current research status, and provided suggestions for future work. Ammour et al. 7 proposed an autonomous driving collision avoidance scheme based on model predictive control (MPC). By simplifying the prediction model to incorporate relative vehicle position and speed, and integrating decision and safety constraints into the MPC formulation, the vehicle could flexibly maneuver according to traffic conditions. Simulation results verified its effectiveness. Xu et al. 8 comprehensively reviewed research progress on the effects of vehicle collisions on reinforced concrete structures, analyzed failure modes, influencing factors, and impact force responses, and discussed approaches for improving the impact resistance design of reinforced concrete structures. Li et al. 9 developed a detailed finite-element model to simulate collision scenarios between vehicles and bridge piers at different masses and impact speeds, evaluated pier deformation and vehicle impact forces, and proposed a new explicit damage index to assess damage levels of piers and entire bridge structures. Sohel et al. 10 studied the performance and design of reinforced concrete building columns under low-speed vehicle impacts. They assessed the impact effects on axially stressed columns through numerical simulations and proposed new equivalent static force estimation guidelines and design recommendations. Wang et al. 11 analyzed the low-speed impact behavior of CFRP-encapsulated concrete substrates. They examined the effects of incident kinetic energy, CFRP thickness, the ratio of axial compressive stress to concrete strength, and impactor shape through experiments and simulations. Kadhim et al. 12 investigated the dynamic response of CFRP-reinforced concrete beams under impact loads using finite-element simulation, analyzing parameters such as impact position, velocity, and CFRP configuration, and found that CFRP reinforcement significantly improved impact resistance. Zhao et al. 13 studied the influence of different truck impacts on the dynamic behavior and damage mechanisms of reinforced concrete bridge piers, analyzing changes in impact force, internal force, energy absorption, and reinforcement stress using LS-DYNA software. Heng et al. 14 examined the effects of heavy truck impacts on the dynamic response of expressway bridges through finite-element simulation, analyzing the effects of vehicle mass, impact speed, and angle on structural damage. Wu et al. 15 explored the dynamic response and reliability of double bridge columns under vehicle impacts, including impact forces and lateral displacement distributions, and analyzed the influence of vehicle mass and speed. Ngo et al. 16 proposed an intelligent human–computer interaction method based on visual computing. By establishing a dynamic model, integrating an interaction framework, fusing visual data, and introducing a handover mechanism, they achieved safe, comfortable, and collision-proof robot navigation, contributing to research on vehicle collision prevention.
The above studies mainly focused on the effects of vehicle collisions on various structures, providing valuable references. Meanwhile, incidents involving vehicles striking buildings are common, and damage is often more severe when brick or stone structures are involved.17–19 As a significant carrier of Chinese history and culture, archways have not been effectively protected. Most archways remain at risk of vehicle collisions. Therefore, this study analyzes the response of an archway to vehicle impacts, providing a reference for understanding potential damage and informing protective strategies.
Overview of Xu Guo archway
Xuguo Archway, 20 locally known as the “Bajiao Archway,” is located in Huangshan City, Anhui Province, as shown in Figure 2. Built in 1584 AD, this stone archway has a history of more than 500 years and holds great historical and cultural value. It serves as an important carrier for interpreting ancient history and culture. The archway measures 11.54 m in length (north to south), 6.77 m in width (east to west), and 11.40 m in height. The lower columns have a cross-sectional size of 0.50 m × 0.50 m and a height of 7.04 m. The upper columns have a cross-sectional size of 0.40 m × 0.40 m, with heights of 4.36 and 3.15 m, respectively.

Real photo of the archway. (a) Front of the archway. (b) Side elevation of the archway.
Model establishment and verification
In this study, a simplified full-scale finite-element model of the Xu Guo Archway was established using ABAQUS, as shown in Figure 2. Considering the force exerted by the stone lions at the base of the columns, they were simplified as stone blocks to better reflect actual load conditions. The Explicit analysis module in ABAQUS was used for the solution process, and the archway was meshed using C3D4 elements. Based on grid convergence analysis (Table 1), the grid size was determined to be 0.35 m, with a maximum deviation factor for curvature control set to 0.1. The total number of elements was 31,589. The archway stones are made of hard cyan tea stone. Referring to similar studies,3,21 stones similar to those used in the archway were selected for experiments. The stones have a density of 1900 kg/m³, an elastic modulus of 1800 MPa, and a Poisson's ratio of 0.15. The damage characteristics of the stones were simulated using the Concrete Damage Plasticity constitutive model.22–24 In this model, the dilation angle was set to 30°, and the eccentricity was set to 0.1. Additionally, the ratio of biaxial to uniaxial compressive strength was set at 1.16, the ratio of the second stress invariant on the tensile and compressive meridians was set at 0.6667, and the viscosity parameter was set at 0.0005.
Comparison of grid convergence.

Two typical vehicles—a passenger car and a truck—were selected as research objects for vehicle modeling, and simplified model diagrams were established based on actual vehicle parameters. 25 The physical images and model diagrams of the vehicles are shown in Figure 3. The mass of the car is approximately 2.5 t, and that of the truck is about 6.8 t. The friction coefficient for tangential contact was set to 0.2, and hard contact was defined for normal interaction.
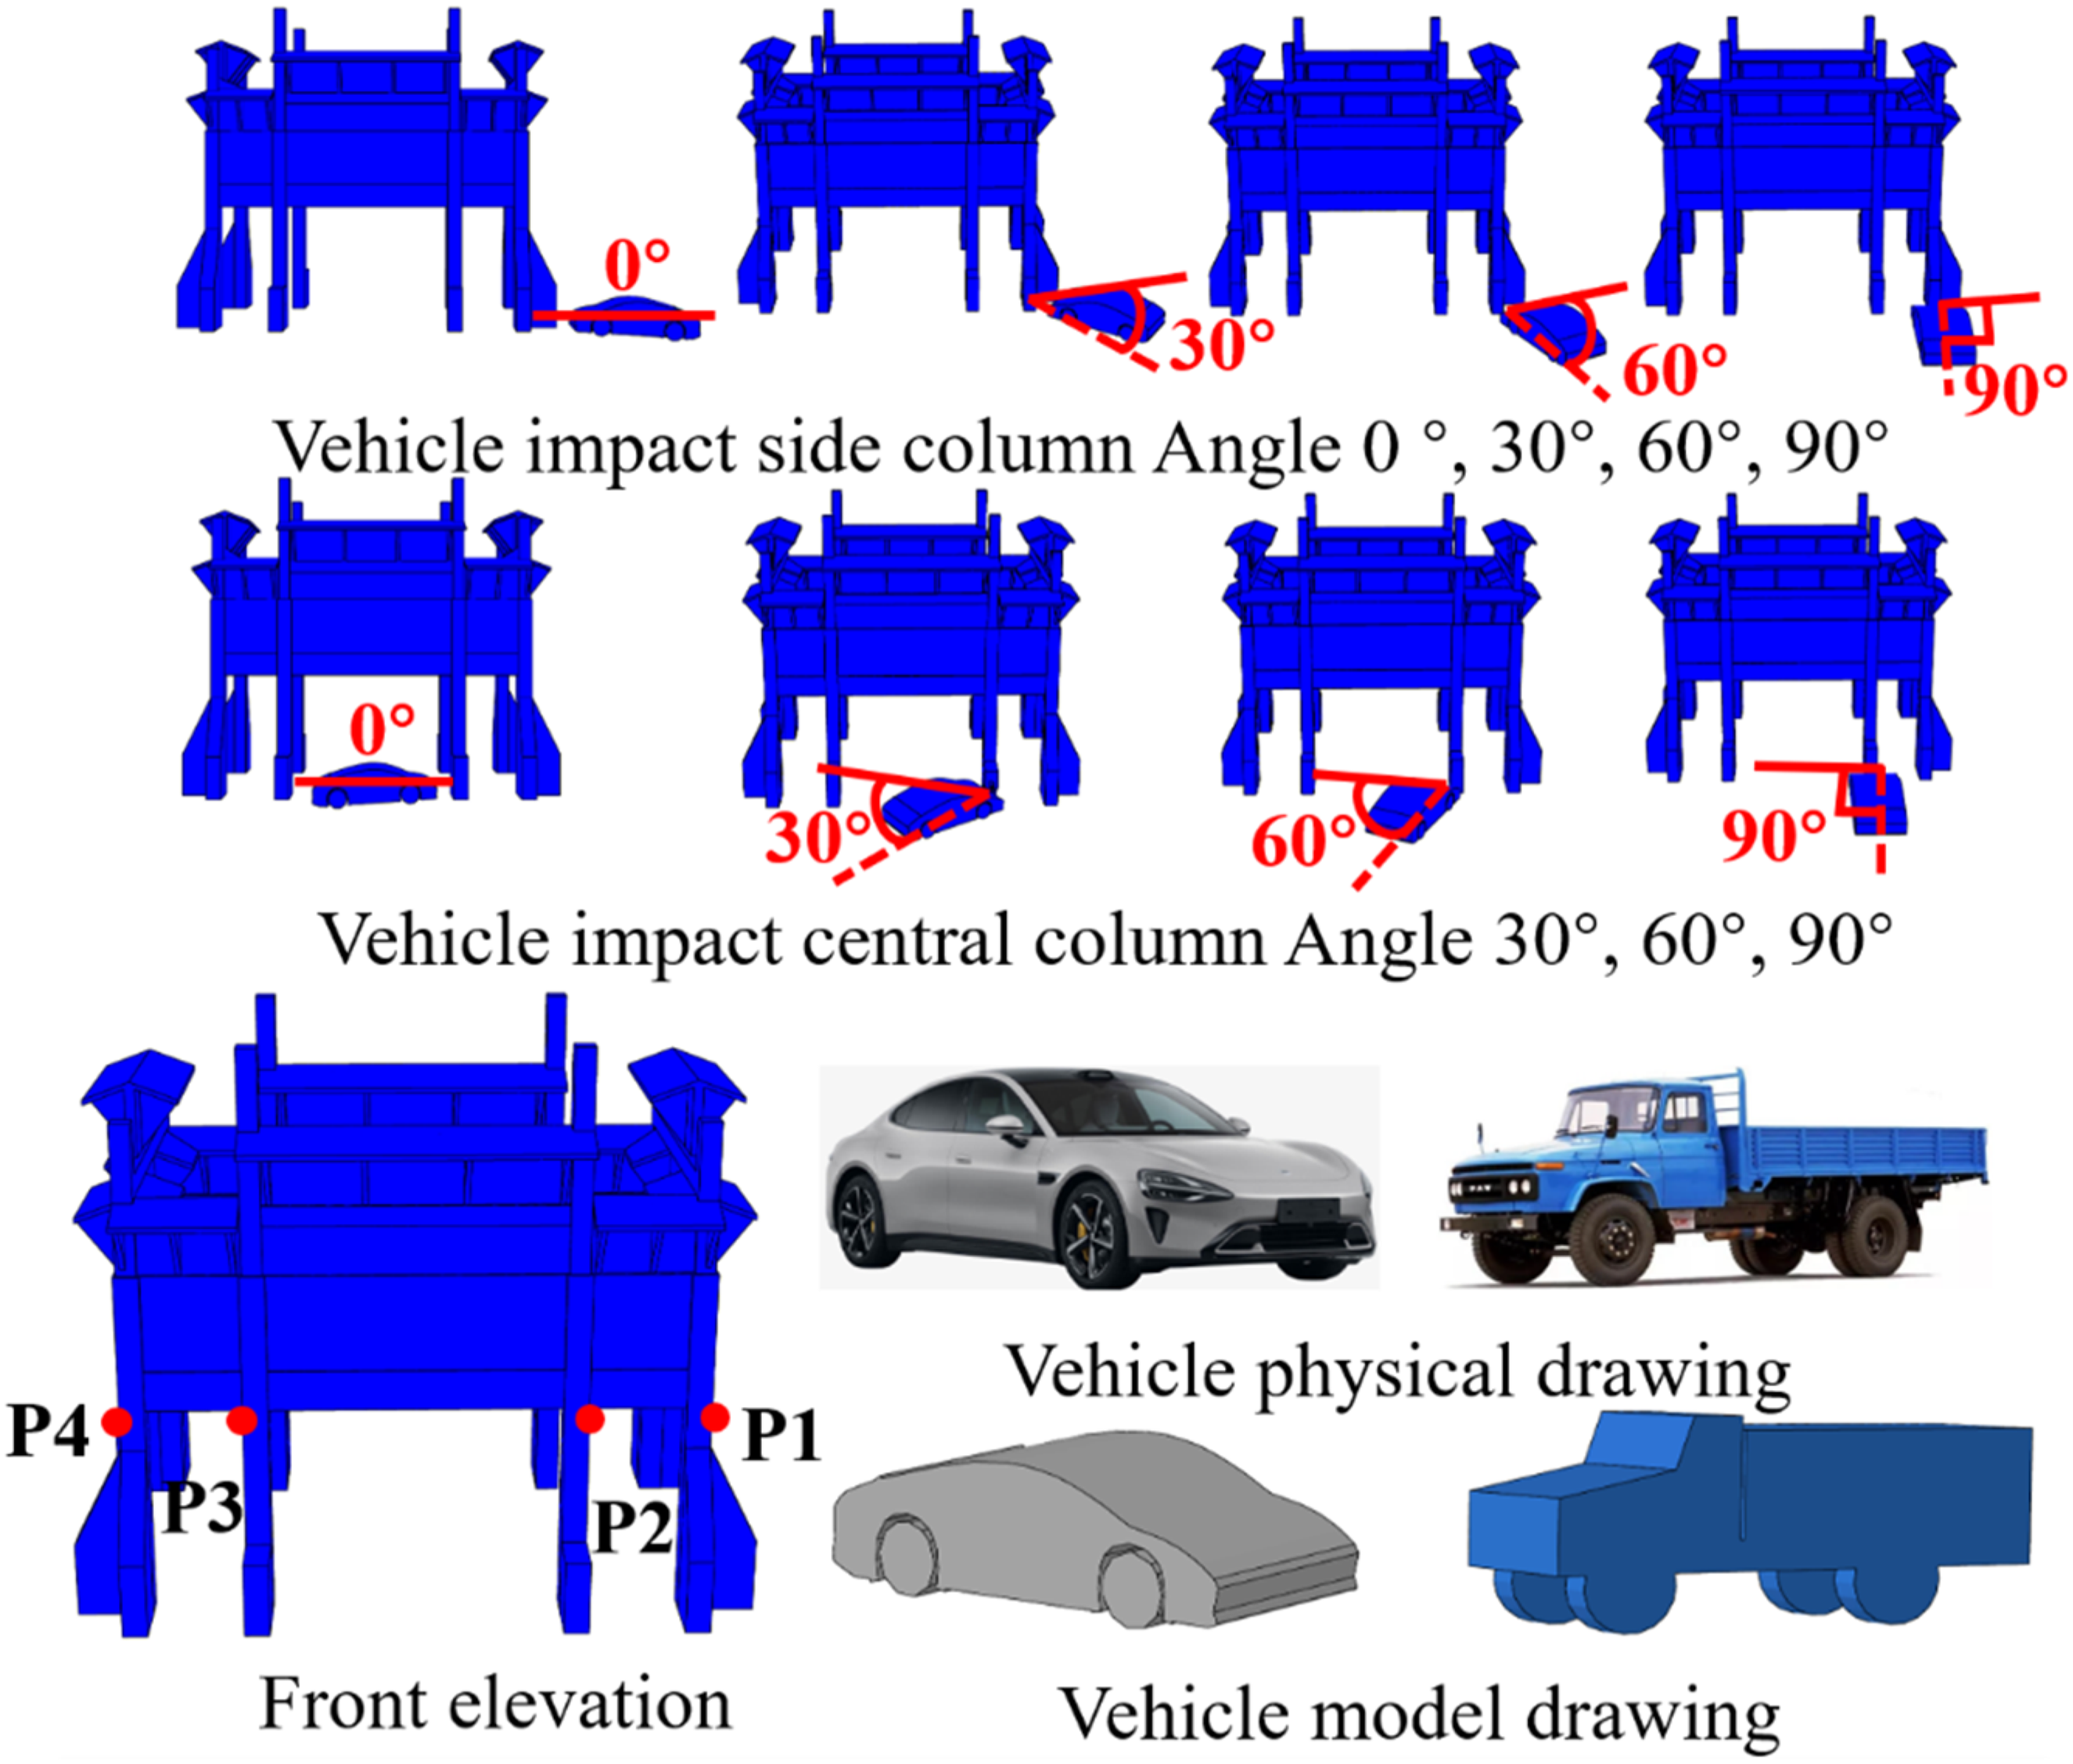
Schematic diagram of the model.
The authenticity and effectiveness of the calculation results in ABAQUS were verified through hourglass control. Figure 4 shows the ratio of hourglass energy to internal energy in the calculation model. It can be seen that this ratio remains below 5% and does not exceed 10%, indicating that hourglass effects are well controlled and that the accuracy and reliability of the calculation results are ensured.

Ratio of hourglass energy to internal energy.
Analysis of vehicle impact response
This study analyzes the response of the archway to vehicle impacts. According to existing studies, such structures are prone to damage at the beam–column junctions. Therefore, four key nodes at these junctions were selected for subsequent analysis, denoted as P1, P2, P3, and P4, as shown in Figure 3.
The collision between a vehicle and an archway is a complex dynamic process involving the transfer and transformation of energy. According to Newton's second law, the collision force F can be expressed as:
During the collision, the vehicle's kinetic energy is rapidly converted into impact force on the archway, resulting in deformation and potential damage to the structure. The initial kinetic energy Ek of the vehicle is given by:
The collision between vehicles and the archway can be regarded as a collision problem between a rigid body and a rigid structure. According to the law of conservation of momentum, the total momentum of the system remains unchanged before and after the collision:
From equation (2), it can be concluded that a vehicle with greater mass and speed possesses higher kinetic energy, resulting in a larger impact force during the collision.
The approximate calculation of the collision force F can be expressed by the following formula:
Impact of different speeds
To study the impact of vehicles on the archway at different speeds, three speed conditions were set in this section: 10, 20, and 30 km/h, denoted as V1, V2, and V3, respectively. At these three speeds, both the central column and the side columns of the archway were impacted, and the failure conditions of the columns at different positions were analyzed.
Node displacement analysis
This study focuses on the vertical displacement of the nodes, as the vertical displacement of the upper nodes is significantly larger than the lateral displacement. Figure 5 shows the vertical displacements of the four key nodes of the archway under vehicle collisions (upward displacement is considered positive). From the vertical displacement of the key nodes, a preliminary assessment can be made regarding potential failure. Figure 5(a) shows the vertical displacements at a vehicle speed of 10 km/h. From the overall diagram on the left, it can be seen that the vertical displacement of the curve “Central column P2” continuously increases. When the central column is impacted, the vertical displacement at point P2 reaches 361.81 mm at 0.5 s, indicating that point P2 has failed and the column has collapsed. As shown in the detailed diagram on the right, except for the curve “Central column P2,” the other curves exhibit simple harmonic motion within a small range, with maximum vertical displacements not exceeding 2 mm. This indicates that these nodes remain intact and have not suffered significant damage. Figure 5(b) shows the vertical displacements at a vehicle speed of 20 km/h. When the central column is impacted, the vertical displacement at point P2 increases to 475.01 mm at 0.5 s. Due to higher speed and earlier impact, greater displacement occurs. From the detailed diagram on the right, when the side column is struck, points P1 and P2 can no longer maintain small-range simple harmonic motion. Specifically, at point P1, the vertical displacement reaches 32.78 mm at 0.5 s, indicating that these nodes have been damaged to some extent, while the other nodes remain largely intact. Figure 5(c) shows the vertical displacements at a vehicle speed of 30 km/h. When the central column is impacted, the displacement at point P2 increases to 611.58 mm at 0.5 s. When the side column is impacted, the vertical displacement at point P1 reaches 650.92 mm at 0.5 s, and points P2 and P3 reach 42.61 and 109.58 mm, respectively, indicating varying degrees of damage at these locations. In summary, when the central column is significantly impacted, the influence on other nodes is relatively small. However, when the side column is impacted at speeds of 20 and 30 km/h, the damage to the archway is greater, with key nodes in good condition at lower speeds but severe damage at higher speeds. At 30 km/h, impact to the side column results in severe damage, causing overall structural failure to varying degrees.

Vertical displacement of key nodes. (a) Impact velocity was 10 km/h, (b) Impact velocity was 20 km/h, (c) Impact velocity was 30 km/h.
Impact force analysis
Figure 6 shows the impact force responses of the vehicle to the central and side columns at the three different speeds. It can be seen that as the vehicle speed increases, the impact force generated by the vehicle also increases. The reason for the appearance of multiple peaks in the impact force is that the debris from the collapse of the archway will also collide with the vehicles, resulting in multiple peaks. However, the maximum peaks all occur at the moment of impact. The data show that when the speed is V1, the maximum impact force on the side column is 2.04 MN, while on the central column it is 1.24 MN. When the speed is V2, the maximum impact force on the side column rises to 2.44 MN and on the central column to 1.54 MN. At V3, the maximum impact force on the side column reaches 4.66 MN, and on the central column it is 2.34 MN. Compared with V1, the impact force on the side column at V2 and V3 speeds increases by 19.49% and 127.88%, respectively, while the impact force on the central column increases by 23.94% and 88.49%, respectively. In general, the peak impact force and its rate of increase on the central column are smaller than those on the side column. This is mainly because the central column is more fragile than the side columns and is already damaged at V1, resulting in a loss of bearing capacity to withstand greater impact forces at higher speeds. Additionally, there is a smaller impact force observed after the primary impact period, which is attributed to secondary contact between the vehicle and the archway column following structural failure.

Time-history curve of impact force.
Damage analysis
To more intuitively illustrate the damage to the archway, this section analyzes the cloud diagrams of the archway when impacted by a vehicle at different speeds, focusing on both the side and central columns. For each case, three time points are selected for display: T1 = 0.0450 s, T2 = 0.3150 s, and T3 = 0.5000 s, to facilitate better comparison among different models, as shown in Figure 7. At time T1, in the model with vehicle speed V3, impact has already begun, and the bottom of both the side and central columns reaches failure, with element deletion observed. In contrast, in the models with vehicle speeds V1 and V2, no significant impact has occurred yet. At T2, for vehicle speed V1, the vehicle has impacted both the side and central columns. The elements at the base of the central column have been deleted; however, the column remains connected to the archway beam and can still bear part of the load. The side column, on the other hand, is completely destroyed, separated from the beam, and has lost its load-bearing capacity. In the V2 model, the side column separates from the beam due to the collision, losing its load-bearing capacity. The upper front side of the archway exhibits shear damage, and initial cracks appear. In the V3 model, the side column is struck and separated from the beam, while the upper portion of the archway shows more severe shear damage, with parts of the corner beginning to collapse. When the central column is impacted at V3, a larger crack appears on the upper front part of the archway, and more elements are deleted. At T3, in the V1 model, damage progression essentially halts, and the archway remains stable without collapsing. In contrast, in the V2 and V3 models, when the side column is impacted, the corner collapses entirely, including the front and side portions. When the central column is impacted, only severe damage and a large crack are observed on the front, but overall collapse does not occur. In general, compared with the central column, the side columns of the archway demonstrate greater impact resistance and play a more crucial role in maintaining overall structural stability. This is evident from the observation that although the central column is destroyed at V1 speed, the overall stability of the archway is still maintained.

Vehicles impacting the central and side columns of the archway at V1, V2, and V3 speeds (a, b, and c represent the damage cloud diagrams at times T1, T2, and T3, respectively). (a) T1 time impact diagram. (b) T2 time impact diagram. (c) T3 time impact diagram.
Influence from different angles
Node displacement analysis
To study the damage caused by vehicle impacts on the archway from different angles, this section sets the vehicle speed at 30 km/h and considers impact angles of 30° and 60°, for comparison with the 90° impact discussed previously.
Figure 8 shows the impact force time-history curves for vehicles impacting the archway columns from different angles at 30 km/h. In general, the impact force when striking the side column is greater than when striking the central column, indicating that the side columns can withstand higher impact forces from various angles, which is consistent with the results in the previous section. The maximum impact forces recorded are as follows: when striking the side and central columns at 0°, 4.69 and 3.62 MN, respectively; at 30°, 1.29 and 0.26 MN; at 60°, 1.02 and 0.40 MN; and at 90°, 4.66 and 2.34 MN, respectively. In contrast, regardless of whether the side or central column is impacted, the vehicle impact force at 90° is the greatest, while the forces at 30° and 60° are significantly lower than those at 0° and 90°.

Time-history curve of impact force.
Damage analysis
Figure 9 visually shows the damage cloud diagrams of the archway under impacts from different angles. The damage patterns vary between impacts to the side and central columns at different angles. Three key time points are selected for analysis: T1 = 0.0850 s, T2 = 0.2100 s, and T3 = 0.5000 s. It can be seen that under impacts at 30° and 60°, only a small number of elements are removed from the impact positions at the bottom of the archway, indicating that the stone base effectively protects the structure. However, impacts at 0° and 90° result in a large number of element deletions, indicating that these angles cause the most severe damage to the archway. This finding is consistent with the impact force time-history results described above.

Damage cloud diagrams of the archway under impacts at different angles (a, b, and c represent the damage cloud diagrams at times T1, T2, and T3, respectively). (a) T1 time impact diagram. (b) T2 time impact diagram. (c) T3 time impact diagram.
Impact of different vehicles
From the analysis in section “Influence from different angles,” it was found that impacts on the archway columns at 30° and 60° at 30 km/h do not cause structural collapse. Therefore, this section analyzes the impact of a typical truck, also at a speed of 30 km/h, with impact angles set at 30°, 60°, and 90° to maintain consistent control variables.
Node displacement analysis
Unlike the results in Section “Influence from different angles,” when a truck impacts the archway from different angles, both the central and side columns experience varying degrees of damage and collapse. Therefore, this section analyzes and compares the vertical displacement time-history curves of the four key nodes of the archway—P1, P2, P3, and P4—to describe the collapse behavior.
Figure 10(a) shows the vertical displacement time-history curves of the four key nodes when the truck impacts the archway at an angle of 30°. It can be seen that when the side column is impacted, the maximum vertical displacement at node P1 reaches 53.47 mm at 0.5 s, indicating that this node has collapsed. The maximum vertical displacement at node P2 is 3.43 mm, suggesting the initiation of cracking. The other nodes exhibit simple harmonic motion within a range of 1 mm. When the central column is impacted, node P2 exhibits a large displacement, reaching a maximum of 382.07 mm, while the other three nodes show no significant vertical displacement.

Vertical displacement of key nodes. (a) Impact angle is 30°. (b) Impact angle is 60°. (c) Impact angle is 90°.
Figure 10(b) presents the vertical displacement time-history curves when the truck impacts the archway at an angle of 60°. Compared with the 30° impact, the side column impact at this angle results in a greater displacement at node P2, and node P1 also shows considerable displacement. This indicates that the impact at 60° causes damage to both columns. When the central column is impacted, only node P2 shows a large vertical displacement, with no obvious damage observed at the other nodes. This is because the impact force on the central column is lower than that on the side column, and while the central column is more fragile, the side columns continue to support the overall stability of the archway after the central column is destroyed, thus preventing significant damage to the remaining nodes.
Figure 10(c) shows the vertical displacement time-history curves when the truck impacts the archway at an angle of 90°. Compared with impacts at 30° and 60°, node P2 of the central column exhibits a larger displacement. This is due to the higher impact force generated by the 90° collision, which accelerates the collapse of node P2, resulting in greater displacement. The side column also shows a substantial displacement, but the displacement at node P2 is larger than that at node P1.
Impact force analysis
Figure 11 shows the time-history curves of the impact forces when the truck impacts the central and side columns of the archway at different angles. Compared with the results for the car in section “Influence from different angles,” the maximum impact forces produced by the truck are significantly higher. Specifically, when the truck impacts the central and side columns at an angle of 30°, the maximum impact forces are 4.58 and 0.75 MN, respectively. At 60°, the maximum impact forces are 3.56 and 0.51 MN, respectively. At 90°, the maximum impact forces reach 6.74 and 2.43 MN, respectively. It is clear that the largest impact forces are generated when the truck strikes the archway at a 90° angle.

Time-history curve of impact force.
Damage analysis
To more intuitively illustrate the damage and failure progression of the archway, cloud diagrams at three key moments were selected for display and analysis: T1 = 0.1350 s (initial contact), T2 = 0.3075 s (during impact), and T3 = 0.5000 s (final stage). Figure 12 shows the damage cloud diagrams of the archway impacted by the truck at different angles. In general, the damage caused by the truck impacting the central column is less severe than that caused by impacts to the side columns.

Damage cloud image analysis (a, b, and c are the impact cloud images at times T1, T2, and T3 respectively). (a) T1 time impact diagram. (b) T2 time impact diagram. (c) T3 time impact diagram.
At T1, when the truck impacts the side columns at 30° and 60°, damage begins to appear, with element deletion observed. In the 90° model, no significant damage occurs at this moment, as the vehicle is just making contact with the column. When the central column is impacted, the large stone at the base of the column is fractured. At T2, the damage to the side columns continues to spread, leading to complete destruction of the side column and further propagation of damage upward into the central column. In the central column impact models, different degrees of damage are observed in the central column, which is generally less severe than that in the side column impact cases. At T3, the damage to the side columns further progresses, and even the central column exhibits failure. In these cases, the entire archway is nearly completely destroyed, with cracks of varying severity throughout. When the central column is impacted at 30° and 60°, the damage extends to the plaque on the front of the archway, but no damage is observed on the sides. This indicates that the side columns can still support the upper load of the archway after the central column is destroyed (Figure 13).
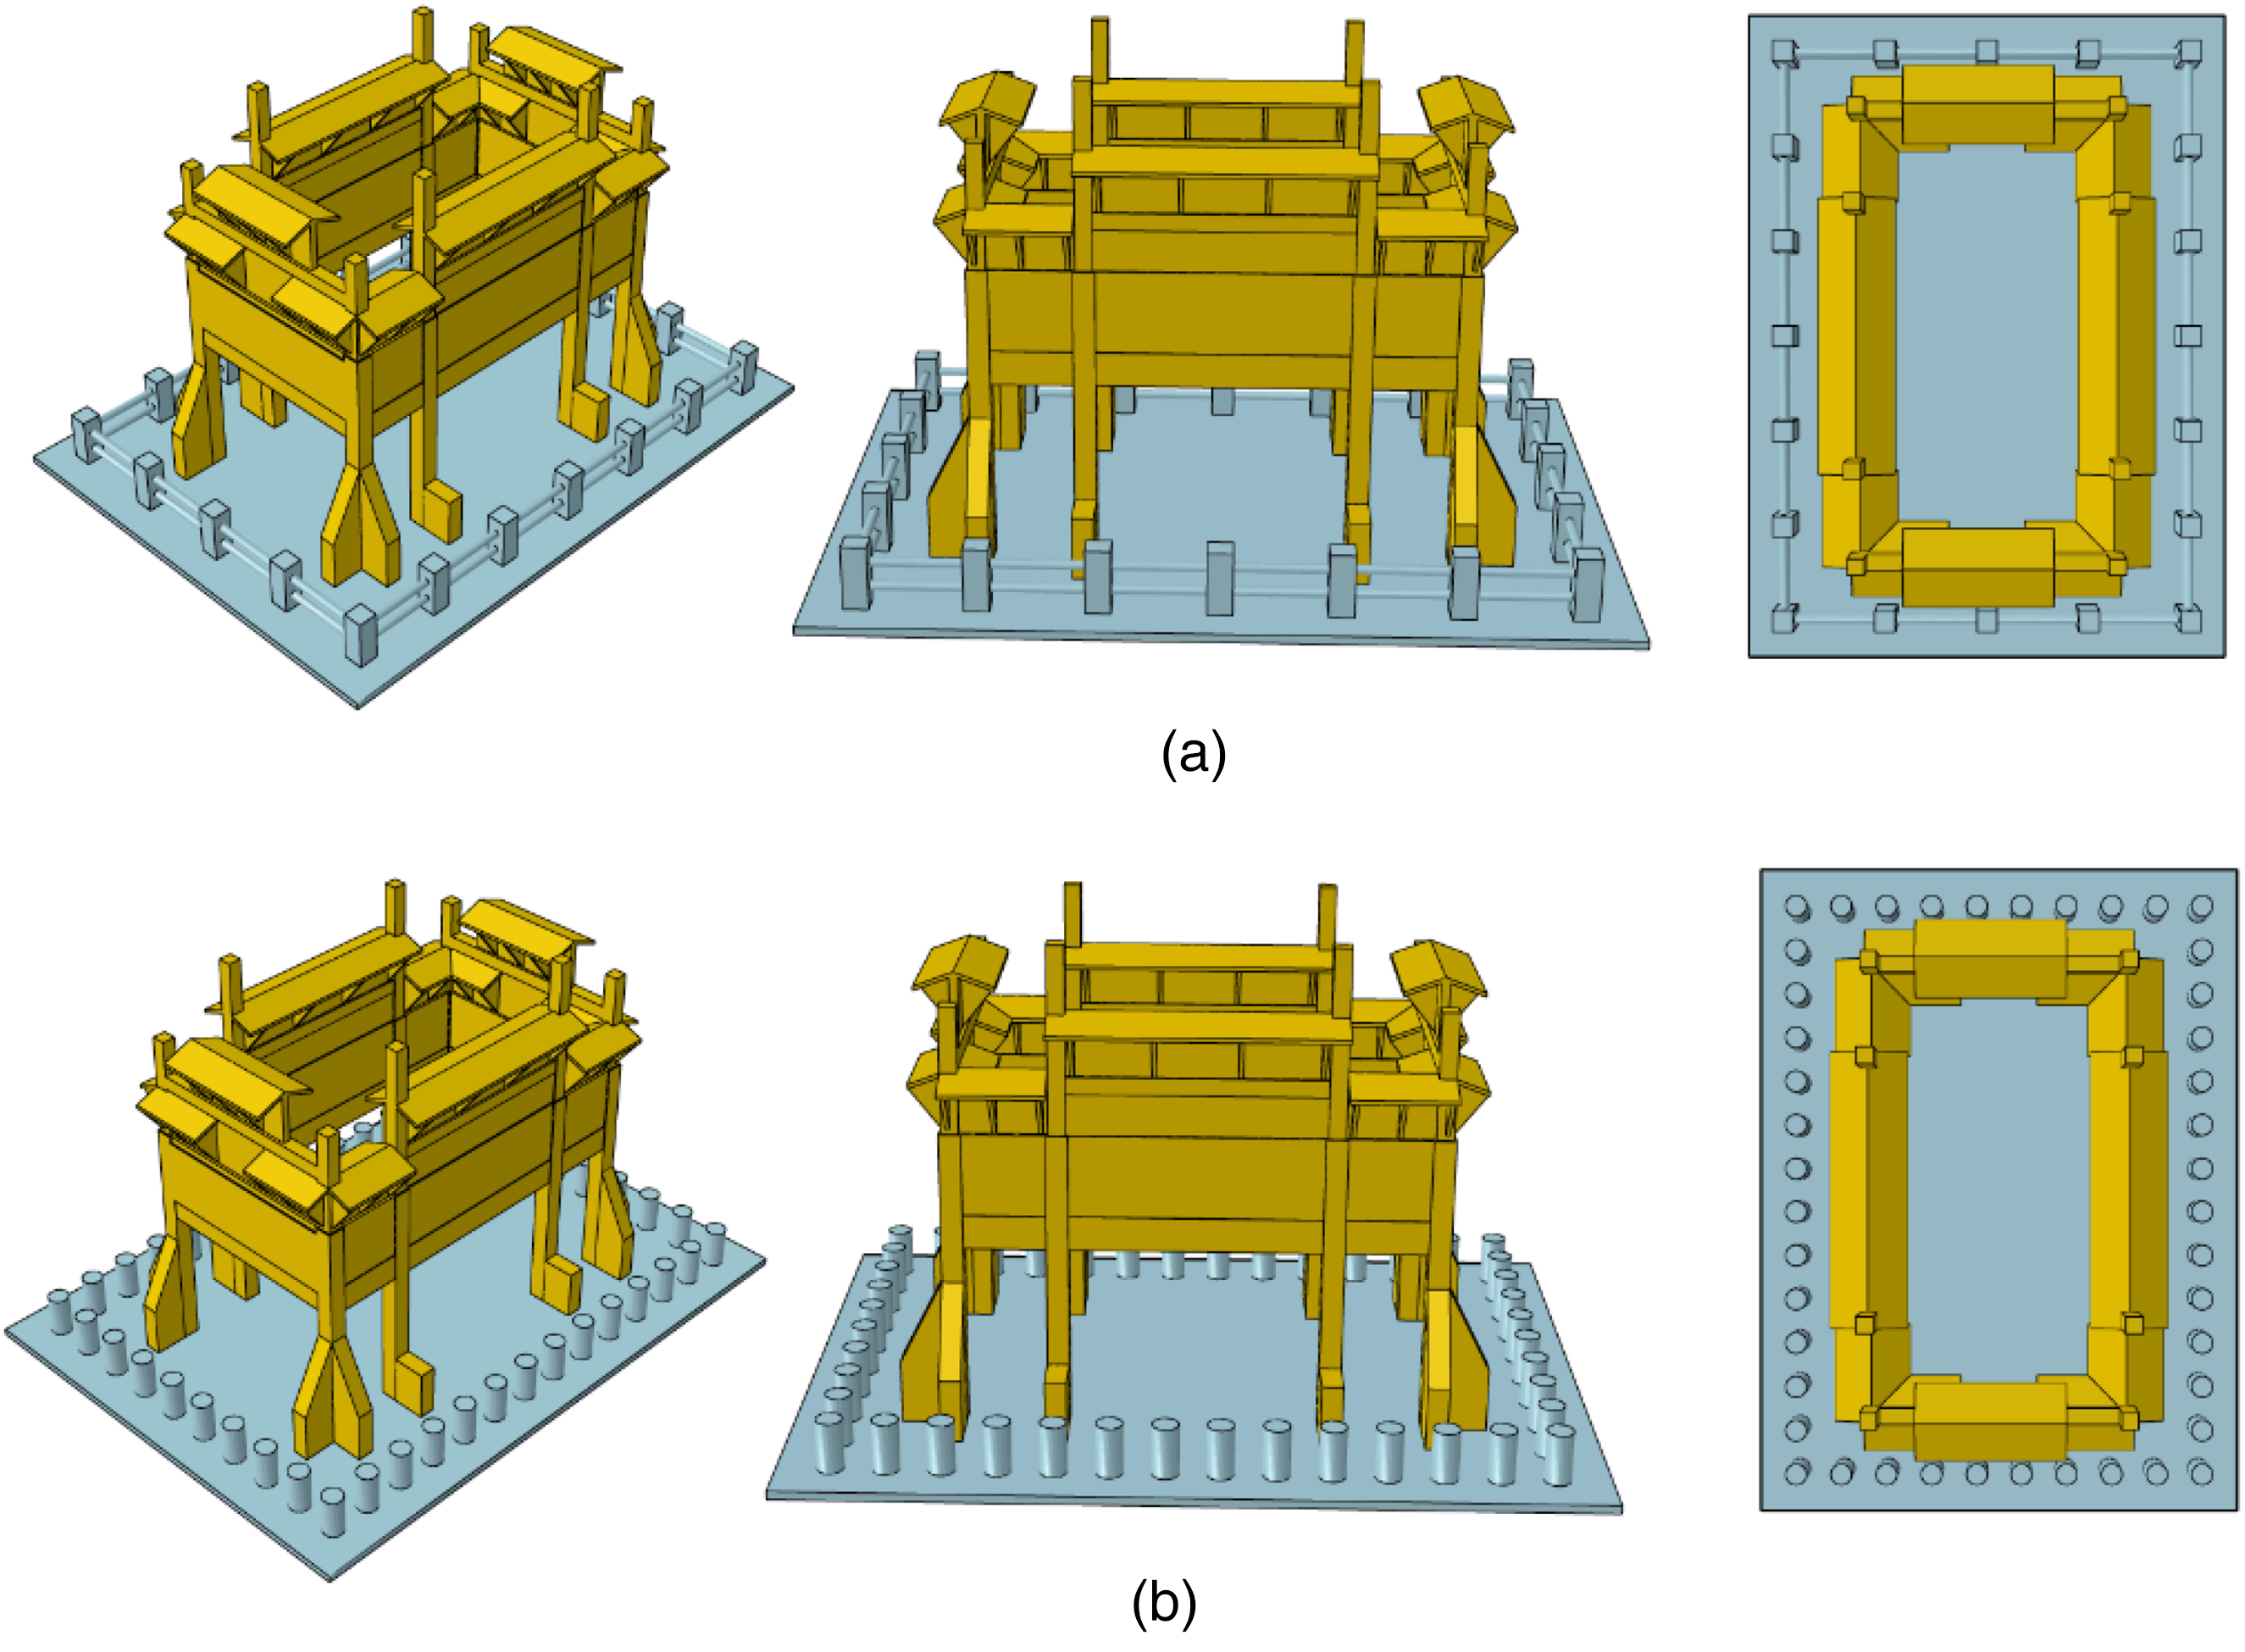
Archway protection measures. (a) Install crash barriers around the perimeter. (b) Install anti-collision posts around.
Discussion
Based on the above analysis, the damage caused by vehicle impacts on the archway can be effectively predicted. Among various strategies to protect historic archways from vehicle collisions, the installation of protective guardrails and protective columns are two common and effective methods. Guardrails can guide out-of-control vehicles away from the archway through their continuous barrier structure, while protective columns can absorb and mitigate impact forces through their solid individual structures. These measures not only significantly enhance the physical protection of the archway but also harmonize with the surrounding environment without compromising its historical aesthetic value. Together, they form a robust safety barrier to safeguard historical and cultural heritage.
Conclusion
In this paper, the finite-element software ABAQUS was used to simulate the vehicle impact effects on an octagonal archway of significant historical value in China. To quantify the effect of impact forces on structural stability, dynamic analyses were performed on the central and side columns of the archway under collisions with small vehicles at different speeds. The impact responses at different angles were also discussed. In addition, the study was extended to analyze the impact of large trucks at various angles and speeds. The following conclusions were drawn:
The ABAQUS simulations showed that as vehicle speed increases, the vertical displacements of key nodes in the archway intensify, which may ultimately lead to collapse. The results indicate that the side columns have a greater influence on the overall stability of the archway, while the central column exhibits relatively weak impact resistance. This finding highlights the need to strengthen the side columns specifically to resist potential damage from high-speed vehicle impacts in the protection of historical buildings. The structural response changes with different impact angles. The results show that the damage caused by vehicles striking the archway columns at 30° and 60° angles is smaller than that from 90°. Impacts at 30° and 60° generally result in localized damage at the point of impact and do not cause the collapse of the archway, whereas impacts at 90° can lead to more severe overall damage. At the same speed and impact angle, the impact force from a truck is much greater than that from a passenger vehicle, leading to more pronounced vertical displacements and potential collapse of key nodes. Unlike cars, truck impacts at 30 km/h from different angles cause varying degrees of damage to the archway. In general, the damage caused by vehicle impacts on the side columns of the archway is more severe than that caused by impacts on the central columns, as the side columns are subjected to greater forces. These results reveal the effects of impact velocity and angle on the structural integrity of the archway and provide a scientific basis for its protection and reinforcement. The findings have important implications for understanding and predicting the safety of historic buildings in modern traffic environments and offer scientific support for future conservation strategies.
Footnotes
Acknowledgements
The authors gratefully acknowledge the financial support of the High-level Talent Support Project of Yunnan Province, China (2020).
Consent for publication
Informed consent for publication was obtained for any identifiable data.
Author contributions
TZ collected archway parameters, wrote the main manuscript text, and prepared Figures 2 to 12. TZ provided research ideas, financial assistance, and resources. TZ also built the archway model shown in Figure 2. DL contributed the content for Figure 1 and Figure 13. FC checked the article. All authors reviewed the manuscript.
Funding
The authors disclosed receipt of the following financial support for the research, authorship, and/or publication of this article: This research was funded by the High-level Talent Support Project of Yunnan Province, China (2020).
Declaration of conflicting interests
The authors declared no potential conflicts of interest with respect to the research, authorship, and/or publication of this article.
Data availability
The datasets used and analyzed during the current study are available from the corresponding author on reasonable request.