
Abstract
Keywords
Introduction
Urolithiasis is a common urological condition worldwide, especially in the tropics like Thailand, and calcium oxalate (CaOx) is the most prevalent type of urinary stones.1,2 CaOx crystals are formed in supersaturated urine and act as lithogenic seeds for CaOx stone formation.1–3 Increased CaOx crystallization, therefore, increases the risk of CaOx urolithiasis development. However, urine contains a natural stone inhibitor, citrate, that can reduce urinary saturation and inhibit CaOx crystallization, growth, and aggregation, hence reducing the risk of CaOx lithogenesis.4–6 Increased urinary citrate excretion clinically indicates a decreased risk of CaOx stone formation. Normally, urinary citrate excretion in adults is ≥320 mg/day (1.67 mmol/day), and urinary citrate lower than this level is defined as hypocitraturia, the most frequent metabolic risk factor found in urolithiasis patients.7–12
Calcium rapidly reacts with oxalate and produces a water insoluble CaOx complex with a solubility level of <0.005 mg/mL. By contrast, the reaction between calcium and citrate produces a calcium citrate (CalCit) complex that is relatively soluble in water with a solubility of 0.23 mg/mL. 13 Therefore, through complexing calcium, citrates efficiently inhibit CaOx lithogenic process, and alkali citrate is currently used in the clinical setting to prevent urinary stone formation. 14 Measurement of urinary citrate is widely used for assessing the risk of urolithiasis development and recurrence. 15 To our knowledge, measurement of CalCit in urine to help estimate the risk of CaOx urolithiasis has not been investigated. We hypothesized that measurement of CalCit precipitated out of 24-hour urine samples could provide a clinical value for distinguishing CaOx stone patents from nonstone forming (NSF) subjects.
Fundamentally, CalCit is insoluble in ethanol. Ethanol precipitation or antisolvent precipitation is normally used for precipitating proteins and nucleic acids. Some studies use ethanol to precipitate CalCit out of the solution. 16 Quantitative measurement of citrate based on an indicator displacement assay (IDA) has been proposed and developed. 17 Murexide (Mrx) or ammonium purpurate is a colorimetric indicator for metals, for example, calcium, cobalt, copper, nickel, thorium, and rare earth metals. A murexide-copper (Mrx-Cu2+) complex has been demonstrated as a sensitive and selective IDA format for detection of citrate.18,19 Citrate has a higher binding affinity to Cu2+ than Mrx. In the presence of citrates, Mrx indicators in the Mrx-Cu2+ complex are displaced by citrates, and the release of Mrx is proportional to the citrate concentration.
In this study, we aimed to develop a novel method for measuring precipitated CalCit (pCalCit) in urine samples using the Mrx-based IDA. Analytical method validation of a new test was performed. Clinical validation in 24-hour urine samples was performed to evaluate the diagnostic performance of the pCalCit measurement in separating CaOx stone patients from NSF individuals. This newly established method was called the murexide-based IDA for measurement of precipitated CalCit (miDA-pCalCit in short). The urinary miDA-pCalCit test was an index test under the diagnostic evaluation. Computerized tomography (CT) scan together with stone analysis by Fourier transform infrared spectroscopy (FTIR) were employed as gold standard methods for the definite diagnosis of CaOx urolithiasis. We reported the results of this diagnostic accuracy study in accordance with the STARD 2015 guideline. 20
Methods
The miDA-pCalCit method
Citrates are naturally found in urine samples. We, therefore, used water and artificial urine (AU) without citrate as samples for establishing the miDA-pCalCit method. Tricalcium dicitrate tetrahydrate (C12H18Ca3O18 or Ca3Cit2 in simplified form, Sigma-Aldrich) was CalCit standard used in all experiments. The AU (pH 6.2) was prepared according to the previous study 21 with minor modification. The stock Ca3Cit2 solution (20 mM) was prepared by dissolving Ca3Cit2 powder in HCl and diluting with 4-(2-hydroxyethyl)-1-piperazineethanesulfonic acid (HEPES) buffer. The AU or water with known concentration of Ca3Cit2 (ranged from 0.2 to 2 mM) were served as positive control or control material. The miDA-pCalCit procedure composed of two main steps, precipitation of CalCit out of samples, and quantitation of pCalCit using Mrx-based IDA. The schematic procedure of the miDA-pCalCit test is shown in Figure 1(a).

The newly established miDA-pCalCit test. (a) The schematic procedure of the test. (b) Mrx-based IDA for CalCit measurement; representative images showing color change in response to an increased CalCit concentration. Ox: oxalate; CaOx: calcium oxalate; CalCit: calcium citrate; pCalCit: precipitated calcium citrate; IDA: indicator displacement assay; miDA-pCalCit: murexide-based IDA for measurement of precipitated calcium citrate; Mrx: murexide.
For CalCit precipitation, 800 µL of urine and control samples were placed into microcentrifuge tubes followed by adding 50 µL of 1 M CaCl2 solution. The first sediment (potentially containing CaOx) was formed and separated by centrifugation at 14,000×g for 10 minutes at room temperature. The first supernatant (containing soluble CalCit) was transferred to a 15 mL tube containing 3.4 mL of absolute ethanol (EtOH) to precipitate CalCit. The second precipitate (containing pCalCit) was harvested by centrifugation at 20,000×g for 15 minutes at 4°C. The remaining EtOH in the obtained pellet was evaporated by heating at 90°C for 15 minutes, and the dried pellet (containing pCalCit) was kept at −20°C for further Mrx-based IDA testing.
Since CalCit sediment is not readily dissolved in water, it can only dissolve in a strong acid solution (pH < 2). 13 Therefore, we redissolved the obtained second precipitate in 0.04 N HCl (100 µL, pH <1) and diluted it with HEPES, pH 8 to the original volume of urine sample (800 µL). To be completely dissolved, the redissolved CalCit sample was further sonicated using the ultrasonic cleaner sonicator (Elmasonic S30H, 37 kHz) for 1 to 5 minutes.
The Mrx-Cu2+ solution (yellow) was freshly prepared by mixing the Mrx dye with Cu(NO3)2 in 10 mM HEPES buffer. The Mrx-to-Cu2+ concentration ratio was set at 1:1. 19 The concentration of both Mrx and Cu2+ solution used in this study was 2.22 mM.
The Mrx-based IDA for CalCit quantitation was performed in 96-well plate. Mrx-Cu2+ solution (180 µL) was placed into each well, followed by adding standard Ca3Cit2 or redissolved pCalCit sample or blank (20 µL). The final concentrations of both Mrx and Cu2+ after adding sample were 2 mM. The displacement reaction was rapid and finished within 1 min (color changed from yellow to purple). The representative image for citrate detection by Mrx-based IDA is shown in Figure 1(b). The displaced Mrx dye (purple) was measured at 522 nm using the UV-Vis spectrometer (Multiskan™ GO Microplate Spectrophotometer, Skanit Software 4.1 Research Edition). The experiment was done in five replicates. The HEPES buffer was used as the blank control. The calibration curve (varied concentrations of Ca3Cit2 standard) was created (Supplemental Figure 1) and used to calculate concentration of pCalCit in urine samples.
Method validation
Method validation was performed to ensure whether the newly established miDA-pCalCit test was suitable for the intended use in a clinical setting in terms of consistency, accuracy, and reliability. The standard Ca3Cit2 solutions (11 concentrations: 0, 0.2, 0.4, 0.6, 0.8, 1.0, 1.2, 1.4, 1.6, 1.8, and 2.0 mM) were prepared in HEPES buffer for miDA-pCalCit testing. Each Ca3Cit2 concentration was measured 5 times (5 replicates), and the miDA-pCalCit measurement was performed repeatedly for 5 days. Within-day precision (repeatability) and total or within-laboratory precision were calculated based on the relative standard deviation (RSD) or coefficient of variation (%CV). The acceptable within-day precision and within-laboratory precision were set at the %CV of < 5% and < 10%, respectively. 22 Accuracy was evaluated based on the %recovery, and the acceptable %recovery ranged between 90% and 110%. 22 The %recovery was calculated from: (observed concentration/target concentration) × 100.
The linearity test (5 replications × 5 days dataset) was carried out to evaluate the detection capability and sensitivity of the test. The limit of blank (LOB), limit of detection (LOD), and limit of quantitation (LOQ) were calculated as followed: LOB = Meanblank + 1.645 * (SDblank), LOD = LOB + 1.645 * (SDlow concentration sample), LOQ = the lowest concentration of standard Ca3Cit2 that had %CV < 15%. 23
Selectivity testing was conducted to assess whether substances commonly found in urine, including urea, creatinine, ammonia, sulfate, carbonate, phosphate, uric acid, oxalate, glucose, albumin, bilirubin, and hemoglobin, interfered with the pCalCit quantitation. These substances were mixed with standard Ca3Cit2 (1 mM) before performing the miDA-pCalCit measurement. Experiments were done in triplicate. Concentrations of each substance used in the selectivity testing are shown in Supplemental Table 1.
Clinical validation
For clinical validation and diagnostic accuracy testing, the miDA-pCalCit measurement (as an index test) was performed in human urine samples. The 24-hour urine samples used in this study were from our previous project (IRB: 286/59), collected from NSF subjects (n = 122) who resided in the Kaedam District, Mahasarakham province, Thailand and from urolithiasis patients (n = 141) who admitted to Mahasarakham Hospital, Thailand during April 2016 and April 2017. 24 Adult participants aged ≥ 18 years old, both men and women were included for the study. Pregnant women and those who had urinary tract infection, hematuria, urinary incontinence, and malignancy were excluded.
The 24-hour urine samples had been stored at −20°C until testing. The definite diagnosis of urolithiasis was confirmed by noncontrast CT scan, and the CaOx stone type was confirmed by FTIR spectrophotometry (as gold standard or reference standard). Of 141 patients, 60 had stone samples available for FTIR analysis. Forty-five patients were diagnosed with CaOx stones, 4 with calcium phosphate (CaP) stones, and 11 with uric acid stones. FTIR spectrum reference of each stone type is shown in Supplemental Figure 2. The frozen 24-hour urine samples were thawed and filtered through the 0.22 µm membrane before miDA-pCalCit testing.
The research protocol was reviewed and approved by the Ethics Committee, Faculty of Medicine, Chulalongkorn University, Bangkok, Thailand (IRB No. 0625/66, approved on 17/10/2023) in accordance with the Helsinki Declaration of 1975 as revised in 2024. All participants gave written informed consents before recruitment and specimen collection.
Statistical analysis
Data were presented as mean ± standard variation (SD) or median (interquartile range, IQR), as appropriate. Levels of urinary pCalCit were reported as mean ± standard error of mean (SEM). The difference between urinary pCalCit levels in urolithiasis and NSF groups was tested by two-sample t-test. Receiver operating characteristic (ROC) analysis was performed to evaluate how well the urinary miDA-pCalCit test could separate CaOx urolithiasis patient from NSF subjects. The diagnostic values including sensitivity, specificity, accuracy, positive predictive value (PPV), negative predictive value (NPV), positive likelihood ratio (LH+), negative likelihood ratio (LH−) were calculated based on the selected cutoff value. GraphPad Prism Software version 10.0 (GraphPad Software, MA) was used for all statistical calculations. P < 0.05 was considered statistically significant.
Results
Establishment of the miDA-pCalCit method
The procedure of miDA-pCalCit method was successfully established. Forming and precipitating CalCit in urine samples were achieved by adding excessive calcium and ethanol, respectively. FTIR analysis of the first and second precipitates were performed, and the result clearly demonstrated that the second precipitate contained CalCit (Figure 2). CaP was observed in both the first and second precipitates. CaOx (at a small amount) was found only in the first precipitate. These FTIR results confirmed that our procedure was capable of precipitating CalCit out of urine samples. The concentration of the yielded pCalCit was further quantified by the Mrx-based IDA using Ca3Cit2 as standards.

The FTIR spectra (mid-infrared range: 4000–400 cm−1) of the first and second precipitates from urine sample of stone patient (U232). (a) The first precipitate obtained after addition of CaCl2. (b) The second precipitate yielded after adding ethanol for CalCit precipitation. (c) CaOx chemical powder, inset: CaOx stone sample (B7S012). (c) Tricalcium dicitrate chemical power. (d) Dipotassium phosphate chemical power. (e) Calcium phosphate (CaP) stone sample (B7S001). FTIR: Fourier transform infrared spectroscopy.
We tested whether all citrate molecules present in the sample could be complex with the added calcium and be precipitated out by ethanol. Instead of urine sample, the Ca3Cit2 standard (1 mM, prepared in water) was used as a testing sample. This 1 mM standard Ca3Cit2 sample was directly measured by Mrx-based IDA and represented as 100% citrate. The miDA-pCalCit assay was then performed (as shown in Figure 1), and citrate levels in first precipitate, first supernatant, and second precipitate were measured using the Mrx-based IDA. The result showed that a very small amount of citrate was detected in the first pellet. Most citrate remained in the first supernatant and were precipitated as pCalCit in the second pellet (Figure 3). The average recovery of citrate in the second pellet was 83.6 ± 8.0%. This data indicated that our procedure could not precipitate all citrates existing in the sample. Based on our experiments, approximately 70% to 80% of citrates in the sample could be successfully precipitated out.

Precipitation efficacy of CalCit by ethanol and the recovery of citrate tested in standard 1 mM Ca3Cit2 sample. Citrate in each fraction was measured by Mrx-based IDA. Original citrate content in Ca3Cit2 sample before precipitation was expressed as 100%. A very small amount of citrate was detected in the first precipitate. Citrate in the second precipitate was recovered at 83.6 ± 8.0%. Experiments were done 12 times. Bars indicate mean ± SD. ****P < 0.0001. CalCit: calcium citrate; IDA: indicator displacement assay; Mrx: murexide; ns: not significant; SD: standard deviation.
Method validation: Linearity range, LOD, and LOQ
To determine the linearity of the Mrx-based IDA for CalCit measurement, varied concentrations of Ca3Cit2 standard (0–2 mM, as target concentrations) were prepared in water and directly measured citrate levels by the Mrx-based IDA test (5 replications × 5 days). The average calibration curve was created (Supplemental Figure 1). The observed CalCit concentrations (calculated from average calibration curve), %CV and %recovery of each standard Ca3Cit2 concentration as well as LOB, LOD, and LOQ were calculated (Table 1). The LOD of the test was 0.08 mM. The upper LOQ and lower LOQ, indicated the highest and lowest concentrations that still be able to accurately quantify, were 1.4 and 0.4 mM, respectively. Therefore, we concluded that the linearity range for an accurate measurement of CalCit was between 0.4 and 1.4 mM.
Linear range (0.4–1.4 mM), variation, LOB, LOD, and LOQ of the Mrx-based IDA.

CalCit: calcium citrate; CV: coefficient of variation; IDA: indicator displacement assay; LOB: limit of blank; LOD: limit of detection; LOQ: limit of quantitation; Mrx: murexide; SD: standard deviation.
Method validation: Within-day and within-laboratory (between-day) precisions
Ca3Cit2 standard at concentrations of 0.6 and 1.2 mM (as target concentrations), prepared in water, were used as control materials for assessing the test precision. The Mrx-based IDA for CalCit measurement was performed (5 replicates × 5 days), and %CV were calculated. The calibration curves (0–1.4 mM Ca3Cit2) of each day (days 1–5) were created for calculating the observed concentrations of control materials (Supplemental Figure 3). Accuracy of the test, indicated by %recovery, was also calculated. The test precision and accuracy based on these two concentrations of control materials are shown in Table 2.
The precision and accuracy of the Mrx-based IDA assessed from the 0.6 and 1.2 mM Ca3Cit2 control materials (prepared in water).

CV: coefficient of variation; IDA: indicator displacement assay; Mrx: murexide.
Additionally, the test precision based on these two concentrations of control materials prepared in AU was assessed. The pCalCit measurement in these control materials were carried out in 5 replicates for 5 days. Both within-day and within-laboratory precisions fell within acceptable ranges (Table 3). The %recovery (%yield) of 0.6 and 1.2 mM Ca3Cit2 control materials were 80% and 74%, respectively (Table 3).
The precision and accuracy of the miDA-pCalCit test assessed from the 0.6 and 1.2 mM Ca3Cit2 control materials (prepared in AU).
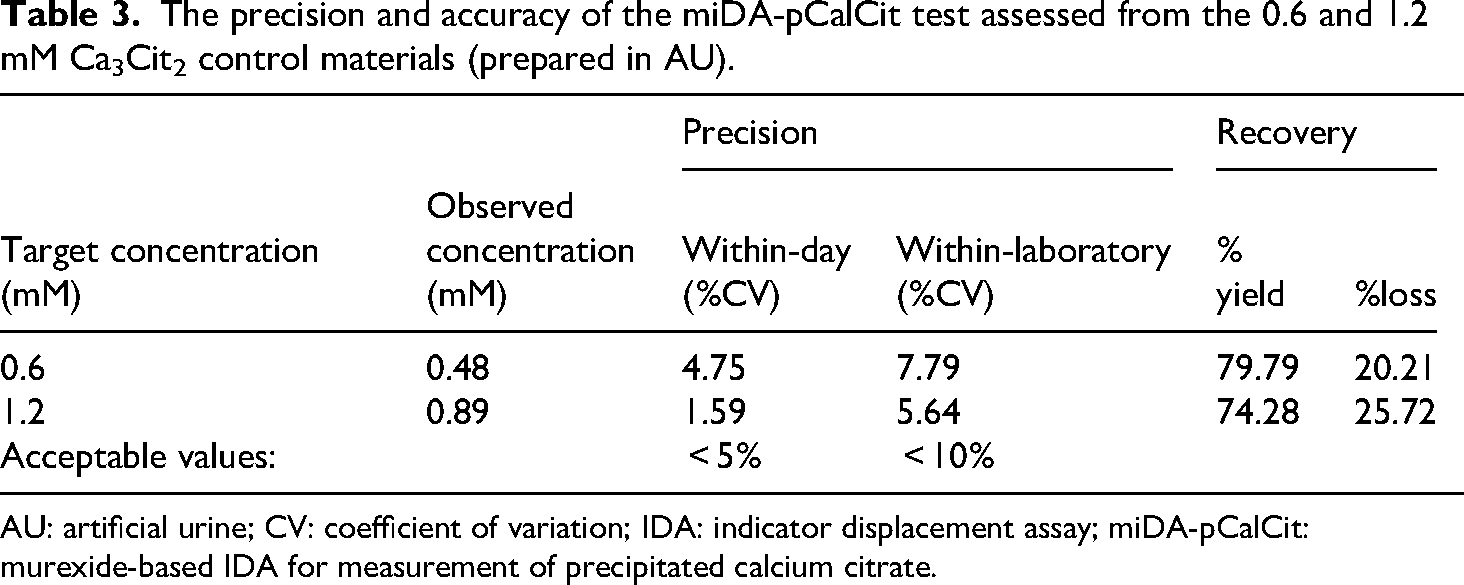
AU: artificial urine; CV: coefficient of variation; IDA: indicator displacement assay; miDA-pCalCit: murexide-based IDA for measurement of precipitated calcium citrate.
Method validation: Selectivity
The substances commonly existed in urine, that is, urea, creatinine, ammonia, sulfate, carbonate, phosphate, uric acid, oxalate, glucose, albumin, bilirubin, and hemoglobin, were tested to see whether they interfered with the CalCit measurement. These compounds were first screened to see if they directly interfere with the citrate measurement by Mrx-based IDA. The Mrx signal of 1 mM Ca3Cit2 control sample was compared with the Mrx signals of 1 mM Ca3Cit2 spiked with various concentrations of testing substances (Supplemental Table 1). Of 12 testing compounds (at physiological concentrations), only phosphate, uric acid, and hemoglobin significantly interfered with the citrate measurement by Mrx-based IDA (Supplemental Figure 4). Increased concentrations of these three compounds linearly increased Mrx signals that subsequently caused overestimation of citrate.
We further tested whether these 12 compounds interfered with determination of pCalCit by miDA-pCalCit method. The 1 mM Ca3Cit2 standard was spiked with various concentrations of testing compounds. The miDA-pCalCit analysis was performed in triplicate. The results clearly showed that urea, creatinine, ammonia, sulfate, carbonate, oxalate, uric acid, glucose, albumin, and bilirubin did not interfere with the measurement of pCalCit (Figure 4). Albumin appeared to be interfering with pCalCit measurement at 100 mg/mL, but at 5 and 400 mg/mL did not (Figure 4(j)). Obviously, the presence of phosphate (K2HPO4) in a 1 mM Ca3Cit2 standard sample significantly caused a falsely decreased level of pCalCit (Figure 4(f)). Our data showed that citrates were lost in the first precipitation (Supplemental Figure 5). Possibly, citrate was co-precipitated together with CaP crystals in the first pellet. By contrast, the presence of hemoglobin in the Ca3Cit2 standard sample slightly, but significantly, caused a falsely increased concentration of pCalCit (Figure 4(l) and Supplemental Figure 5).

The selectivity test for assessing interfering effects of common urinary substances, including urea, creatinine, ammonia, sulfate, carbonate, phosphate, oxalate, uric acid, glucose, albumin, bilirubin, and hemoglobin, in measuring pCalCit by the miDA-pCalCit method. Bars and error bars indicate means and SEMs. * Indicates P < 0.05. CalCit: calcium citrate; IDA: indicator displacement assay; miDA-pCalCit: murexide-based IDA for measurement of precipitated calcium citrate; ns: not significant; SEM: standard error of mean.
Clinical validation: Testing of diagnostic accuracy
Figure 5 shows the STARD flow diagram of the present study. Table 4 shows the demographic and clinical characteristics of stone patients and NSF subjects used in this study. The result showed that levels of urinary pCalCit in urolithiasis patients were significantly lower than in NSF subjects for all expressed units (µM, mg/L, µmol/day, and mg/day) (Figure 6). Areas under ROC curve (AUC) of urinary pCalCit measurement were 0.788, 0.788, 0.709, and 0.709 for units of µM, mg/L, µmol/day, and mg/day, respectively. These results indicated that the urinary pCalCit level expressing as concentration (µM and mg/L) had higher diagnostic power than expressing as total amount of excretion (µmol/day and mg/day).

The STARD flow diagram of the present study.
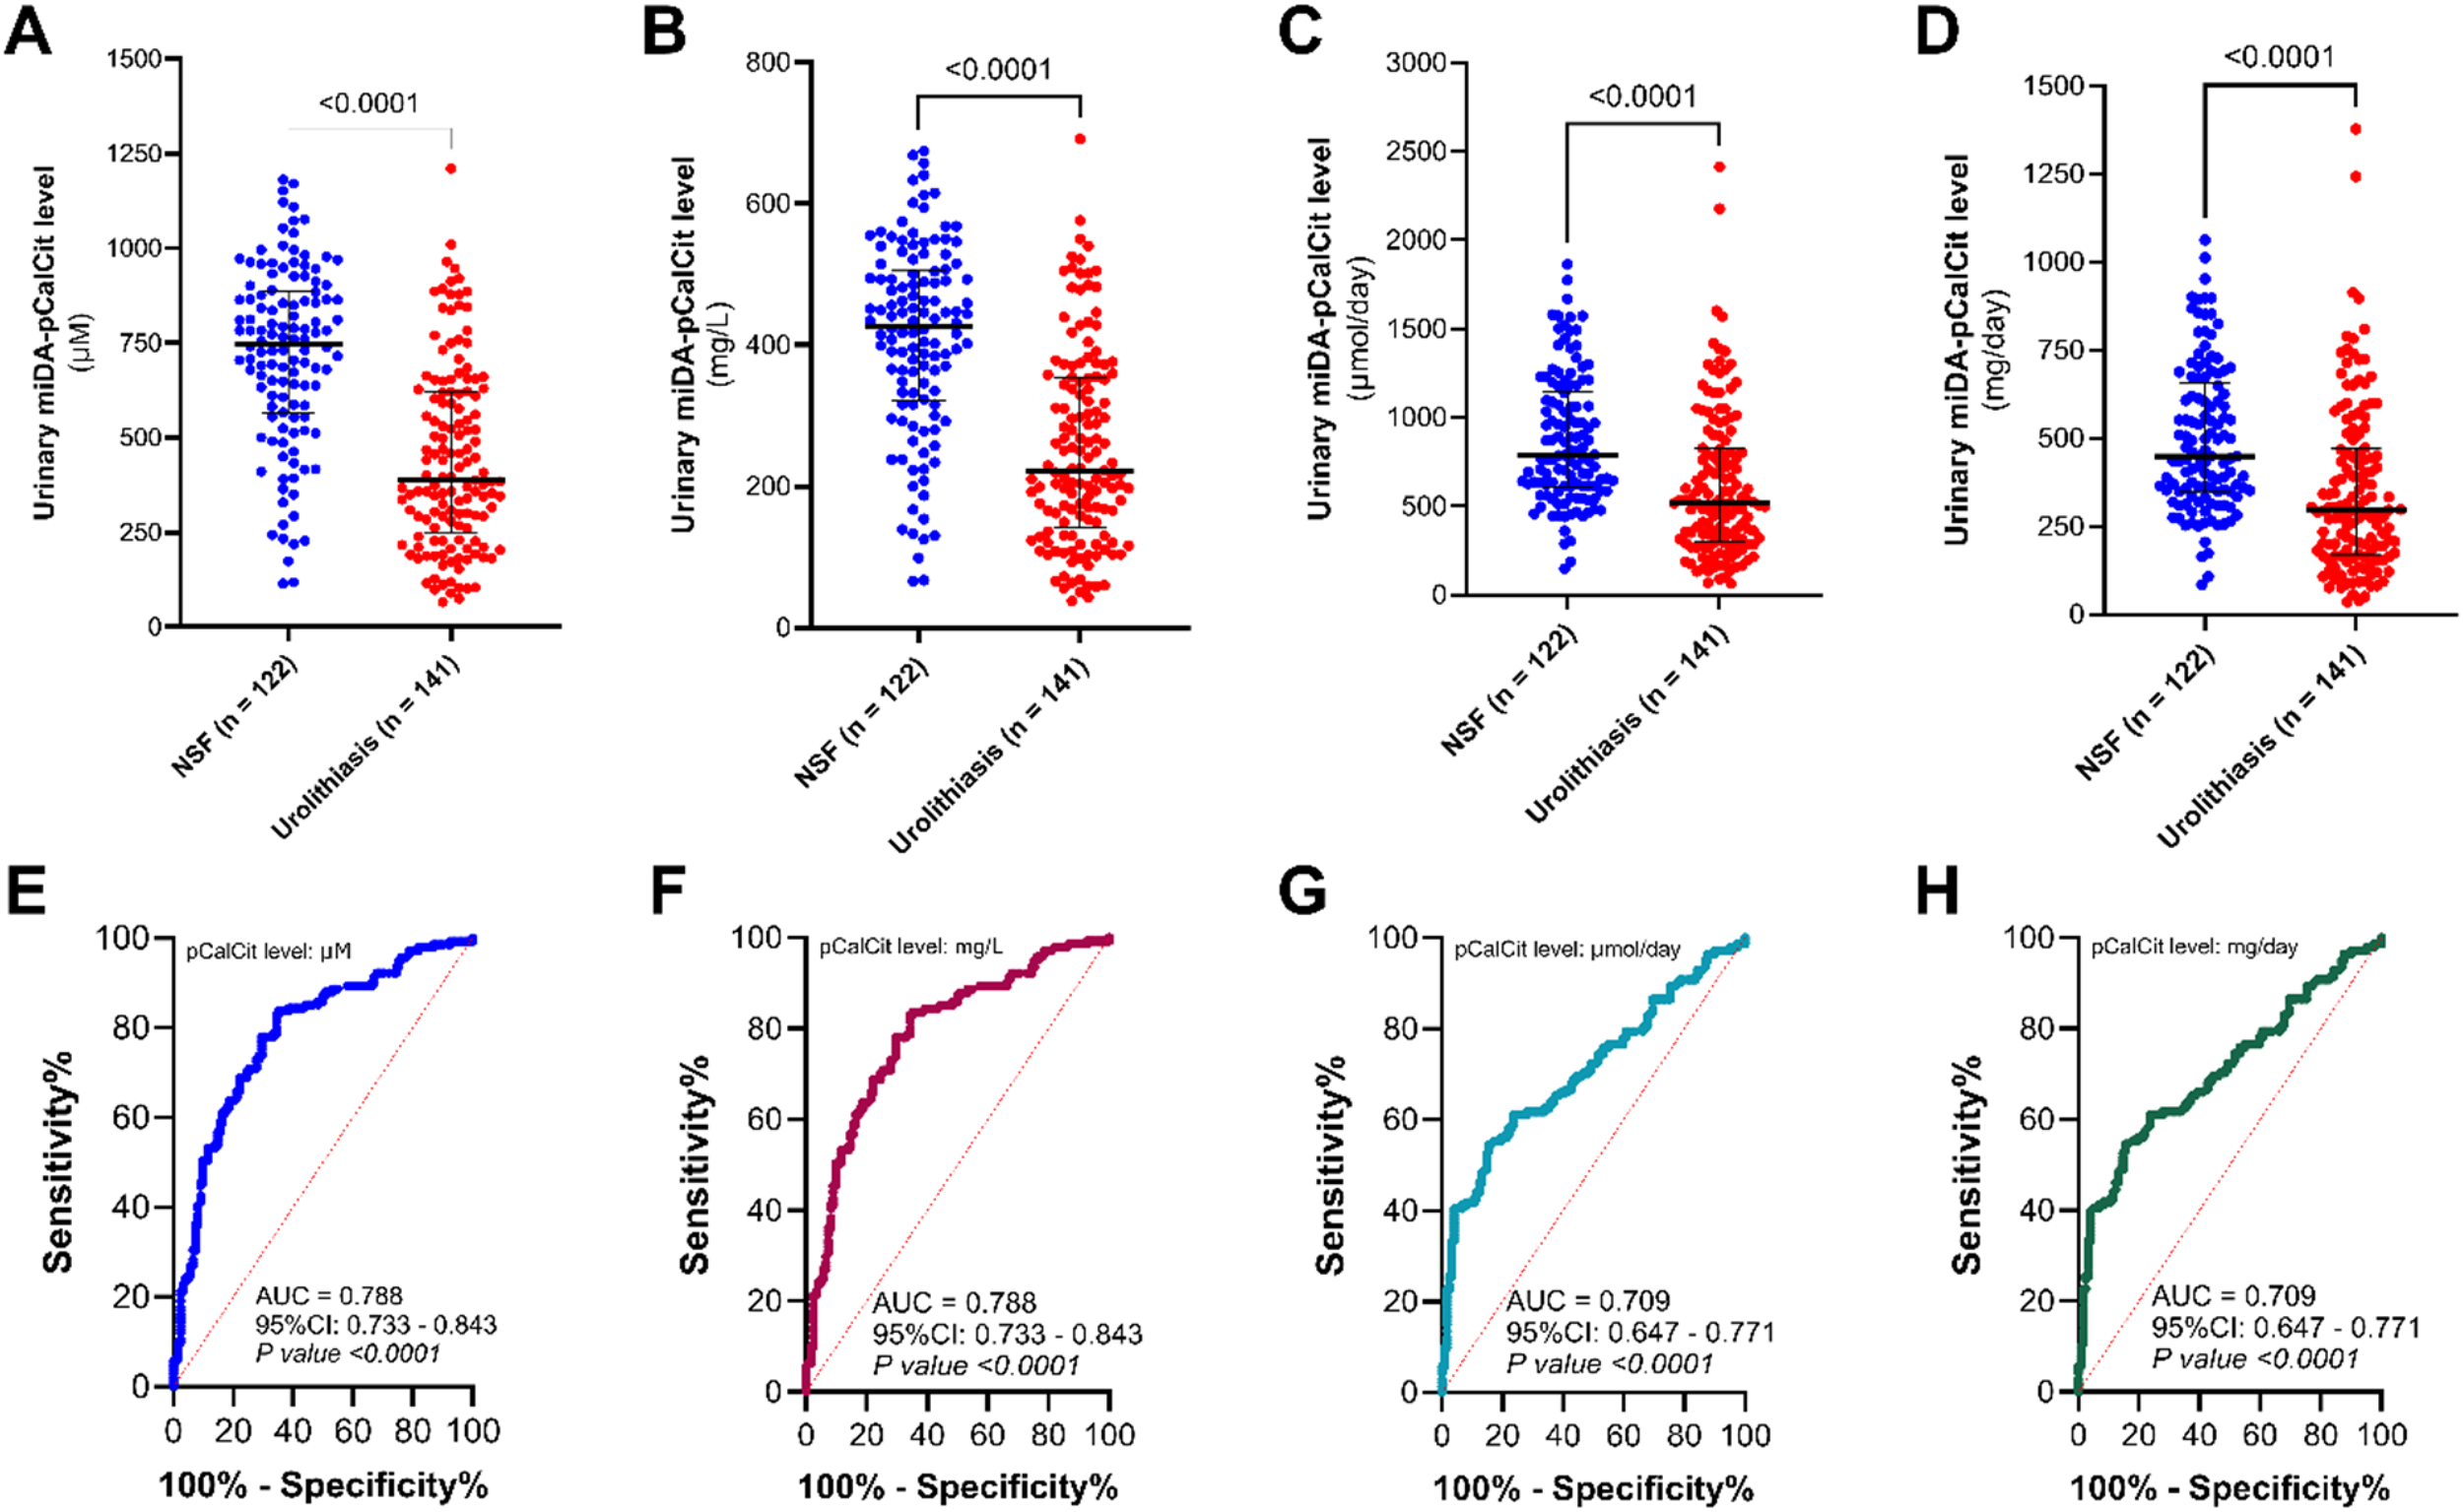
Levels of urinary pCalCit measured by the miDA-pCalCit method compared between NSF and urolithiasis groups, expressed in different units. (a) and (e) µM; (b) and (f) mg/L; (c) and (g) µmol/day; and (d) and (h) mg/day. Levels of urinary pCalCit in urolithiasis patients were significantly lower than that in NSF subjects. ROC analysis indicated that the concentration of urinary pCalCit (expressed as µM and mg/L) had higher diagnostic power than the total excretory amount of urinary pCalCit (expressed as µmol/day and mg/day). Bars indicate median and IQR. CalCit: calcium citrate; IDA: indicator displacement assay; IQR: interquartile range; miDA-pCalCit: murexide-based IDA for measurement of precipitated calcium citrate; NSF: nonstone forming; ROC: receiver operating characteristic.
Demographic and clinical characteristics of urolithiasis patients and NSF subjects used in this study.

IQR: interquartile range; NSF: nonstone forming; SD: standard variation.
FTIR analysis of available stone samples showed that 45 patients had CaOx stones. The urinary pCalCit levels (both expressed as µM and µmol/day) in CaOx stone patients were significantly lower than in NSF subjects (Figure 7). Notably, ROC analysis revealed that urinary pCalCit level in concentration unit (µM) had higher diagnostic performance than urinary pCalCit level in amount unit (µmol/day) (AUC (95% CI): 0.823 (0.752–0.893) vs. 0.705 (0.609–0.802)) (Figure 7).

Urinary pCalCit levels measured by miDA-pCalCit method compared between CaOx stone patients and NSF subjects. (a) Urinary pCalCit concentration (μM) in CaOx stone patients was significantly lower than in NSF subjects. (b) Excretory amount of pCalCit (μmol/day) in CaOx stone patients was significantly lower than NSF subjects. (c) ROC curve of urinary pCalCit concentration expressed as μM. (d) ROC curve of urinary pCalCit excretion expressed as μmol/day. Bars indicate median and IQR. CalCit: calcium citrate; IDA: indicator displacement assay; IQR: interquartile range; miDA-pCalCit: murexide-based IDA for measurement of precipitated calcium citrate; NSF: nonstone forming; ROC: receiver operating characteristic.
We intended to use the urinary miDA-pCalCit test for screening CaOx urolithiasis. Therefore, the cutoff value that provided the highest sensitivity and accuracy for diagnosing CaOx urolithiasis was preferred. In this study, the cutoff value of 632 μM was chosen. The urinary pCalCit level ≤ 632 μM were defined as positive test results while the values > 632 μM were labeled as negative test results. The 2 × 2 table was created regarding this cutoff, and the diagnostic values were calculated (Table 5). Sensitivity and accuracy of the test were obtained at 84.4% and 74.3%, respectively. Interestingly, the test provided NPV of 92.5% and LH− of 0.2.
The 2 × 2 table and diagnostic values of the urinary miDA-pCalCit test for separating CaOx stone patients from NSF subjects.

CI: confidence interval; CT: computed tomography; FTIR:Fourier transform infrared spectroscopy; IDA: indicator displacement assay; miDA-pCalCit: murexide-based IDA for measurement of precipitated calcium citrate; NSF: nonstone forming.
Correlation between urinary pCalCit and urinary citrate levels
Because the miDA-pCalCit method measured the precipitable citrate in urine samples, we further asked whether the urinary pCalCit levels were correlated with the urinary citrate levels. Eighteen 24-hour urine samples (8 from stone patients and 10 from NSF subjects) were selected for measuring citrate concentration using high-performance liquid chromatography (HPLC). A correlation between urinary pCalCit and citrate levels was assessed using Pearson's correlation test. We found that urinary pCalCit levels measured by miDA-pCalCit method were positively correlated with urinary citrate levels measured by HPLC (r = 0.0874, P < 0.001) (Figure 8).

Correlation between urinary pCalCit levels measured by the miDA-pCalCit test and urinary citrate levels measured by HPLC (n = 18). An increased urinary citrate strongly associated with an increased urinary pCalCit. Dash lines: 95% confidence bands of the best-fit line. CalCit: calcium citrate; IDA: indicator displacement assay; miDA-pCalCit: murexide-based IDA for measurement of precipitated calcium citrate.
Discussion
We recently developed a test, called indole-reacted calcium oxalate crystallization index (iCOCI) test, for measuring the total capacity of CaOx crystallization in 24-hour urine samples, and it has a good performance for diagnosis of CaOx urolithiasis.24,25 In this study, we established a new test, called miDA-pCalCit, for measuring CalCit precipitated out of 24-hour urine samples. The method validation revealed that this new test was consistent and reliable. The clinical validation data showed that it had a promising clinical utility for screening CaOx urolithiasis. Urinary pCalCit levels in CaOx stone patients were significantly lower than in NSF subjects. Regarding ROC analysis, the miDA-pCalCit test had an AUC greater than 0.8, indicated that it had a good discrimination performance to separate CaOx stone formers from NSF individuals.26,27 Furthermore, the test had an LH− of 0.2, suggested that a negative test result was clinically useful for ruling out CaOx urolithiasis.28,29
Hypocitraturia or low urinary citrate excretion is the most frequent stone risk factor found in urolithiasis patients, particularly in those with CaOx stones.1,11,12,30 Moreover, hypocitraturia increases risk of CaOx stone recurrence. 31 Therefore, measurement of urinary citrate is clinically important for estimating the predisposition of urinary stone development as well as for guiding the stone treatment and prevention. Methods for urinary citrate measurement have been intensively investigated. Several techniques for measuring citrate in urine samples have been developed ranging from colorimetric method to HPLC-tandem mass spectrometry (MS/MS).15,32 The well-accepted techniques that are frequently used in the clinical setting are enzymatic method and HPLC. However, these two methods are still costly and complicated. 33 Based on our research experience, enzymatic method needs multiple enzymes, and enzyme activities decay over time. In the case of HPLC, sample preparation, sensitivity, and reproducibility are still challenging issues.
In this study, we proposed a method to measure calcium complex of urinary citrate. The miDA-pCalCit test measured precipitable citrates in urine samples. Excessive calcium was added to urine samples to react with citrates, and the CalCit products were precipitated out by ethanol, 16 then the yielded pCalCit was quantified by Mrx-based IDA.18,19 Citrate, especially in the form of citrate3-, effectively displaces Mrx dye from Mrx-Cu2+ complex because the Cu2+-citrate3− complex has higher affinity and stability than Mrx-Cu2+ complex. 19 The absorbance of displaced Mrx (maximum absorption at 522 nm) was gradually increased after adding citrate, together with a gradual decrease in absorbance of Mrx-Cu2+ complex (maximum absorption at 457 nm) (Supplemental Figure 1C). Not only for citrate detection, the Mrx indicator has also been used for measuring degree of esterification between citrate and starch polymers,34,35 calcium level in water samples, 36 and Fe(II)-chelating activity of phenolic compounds. 37 In this study, we used ethanol for precipitating CalCit because ethanol precipitation could eliminate the interfering effect of phenolic compounds (such as catechin and gallic acid) in detecting citrate. 37
It must be clearly stated that our newly established miDA-pCalCit method did not directly measure citrate in urine samples. In fact, it measured CalCit complexes that could be precipitated out of urine samples, in other words, the precipitable citrates. Apparently, not all citrate molecules existed in urine samples could be precipitated out (only about 70–80% based on our data). We do not recommend calculating or deriving urinary citrate concentrations from urinary pCalCit values. We speculate that the precipitable citrates represent urinary citrates that are actively combined with urinary calcium and inhibited CaOx stone formation. The precitable citrate might be better than total citrate to assess the capacity of urinary citrate to inhibit CaOx crystallization. Further experimental study is required to warrant this speculation.
Since the yielded pCalCit greatly depended on citrate concentration in urine sample, it was reasonable to hypothesize that urinary pCalCit levels could be correlated with urinary citrate levels (Figure 8). Like urinary citrate,10,11,38 we demonstrated in this study that urinary pCalCit levels in CaOx stone patients were significantly lower than in NSF subjects. Furthermore, we demonstrated that the elevated level of urinary pCalCit (negative test result) could be used to rule out the CaOx stone disease (LH− = 0.2, Table 5).
The result of analytical method validation revealed that of the Mrx-based IDA did not only have a good precision (within-day precision %CV < 5% and within-laboratory precision %CV < 10%) but also had a good accuracy (achieving 90–110%recovery). The linearity range for CalCit quantitation was between 0.4 mM (400 μM, lower LOQ) and 1.4 mM (1400 μM, upper LOQ). This range mostly covered urinary pCalCit levels observed in urolithiasis patients and NSF subjects. However, we found that about 15% of urolithiasis patients had urinary pCalCit levels lower than 400 μM. According to the linearity of the test, urinary pCalCit levels in these patients could not be accurately quantified. However, we intended to use the miDA-pCalCit test as a screening binary or dichotomous test. Only positive and negative test results are reported according to the cutoff value (632 μM). Therefore, all urine samples with pCalCit levels ≤ 632 μM, including those with levels < 400 μM, were reported only as “positive,” not the actual pCalCit values.
We further asked whether the urinary miDA-pCalCit test had a meaningful diagnostic performance. We performed ROC analysis and selected the cutoff for calculating diagnostic values of the urinary pCalCit measurement. An AUC of ROC curve is generally used for evaluating the ability of a test to discriminate patients with disease and individuals without.26,39 The AUC of 0.5 indicates no discrimination power whereas the AUC of 1.0 indicates a perfect predictive performance. Tests with AUC between 0.7 and 0.8, between 0.8 and 0.9, and over 0.9 are considered as having a fair, good, and excellent discrimination ability, respectively.26,27 In this study, an AUC of 0.823 (95% CI: 0.752–0.893) was obtained (Figure 6). This indicated that the urinary miDA-pCalCit test had a good performance to diagnose CaOx urolithiasis with sensitivity of 84% and specificity of 70% at a cutoff of 632 μM. We extensively searched the literature to find the reported sensitivity and specificity values of urinary citrate measurement for diagnosing urolithiasis to compare with our present findings. Unfortunately, we found none. Rather than diagnostic accuracy, most studies reported only the prevalence of hypocitraturia and underlined it as a key urinary stone risk factor.9,12,40 However, in two of our previous studies, ROC analysis of urinary citrate measurement was performed, and we reported AUC of 0.806 (95% CI: 0.744–0.864) 10 and of 0.803 (95% CI: 0.749–0.857) 38 for separating stone patients from NSF subjects. At the cutoff of 320 mg/day, the sensitivity, specificity, and accuracy of urinary citrate measurement for diagnosing urolithiasis were 94.7%, 36.7%, and 69.1%, respectively. 10 Obviously, AUC values of urinary pCalCit and urinary citrate measurements were not considerably different. Therefore, we concluded that both measurements had the same diagnostic performance for urolithiasis.
The more interesting finding of the present study was that the urinary miDA-pCalCit test gave a high NPV (92.5%) and low LH− (0.2) suggesting a clinical usefulness of the negative test result. The NPV of 92.5% indicates that individuals with negative test results have about 92.5% chance to be healthy (stone-free). LH− indicates how much the odds of the disease decrease when a test is negative, and the LH− of 0.2 indicates moderate decrease in the likelihood of the disease or moderate evidence to rule out the disease. 29 In this study, the LH− of the miDA-pCalCit test was 0.2, indicated that individuals with negative test results (urinary pCalCit > 632 μM) had 5-time (1/0.2) decrease in the odds of developing CaOx stones. Therefore, the urinary miDA-pCalCit test could be a clinically useful test for ruling out CaOx urolithiasis. Reasonably, this test could be implemented as a cheap and simple screening test to rule out CaOx urolithiasis in a clinical setting. For example, if the test is negative in urinary stone patients, it suggests that they have a very low risk of CaOx stone recurrence. However, if the test result is positive, it indicates an increased risk of CaOx stone recurrence. Therefore, we recommend that patients increase their dietary citrate intake, along with maintaining high fluid intake and avoiding high-oxalate diets.
It should be noted again that the urinary miDA-pCalCit test did not purposely measure total urinary citrate, but specifically precipitable urinary citrate. We speculate that those precipitable citrates represent functional citrate molecules that actively bind to calcium ions to prevent CaOx crystallization and hence prevent CaOx stone formation. Further extensive study is needed to warrant this speculation.
Limitations of the study should be mentioned. We did not conduct the interlaboratory study to assess reproducibility (between-laboratory precision) of the miDA-pCalCit test to evaluate if the test results were reproducible among different laboratories. Also, the normal range or reference interval of urinary pCalCit in normal population was not explored. The sample size of CaOx stone group (n = 45) was relatively small. Study in the larger group of patients is recommended to warrant the present findings. Age and sex were not perfectly matched between stone and NSF cases. Only 24-hour urine samples were used for testing in this study. It is interesting to further investigate whether this miDA-pCalCit test can be applied to spot or first morning urine samples. Of note, the urine samples used in this study were frozen 24-hour urine samples, not freshly collected 24-hour urine samples. We found that hemoglobin interfered with the pCalCit measurement, thus urine samples with hematuria are not recommended for miDA-pCalCit testing. Missing data of reference standard test results (patients had no stone available for FTIR analysis) were treated by exclusion (called complete case or available case analysis), and this could lead to bias.
Conclusions
We successfully established the miDA-pCalCit test for measuring the pCalCit levels in 24-hour urine samples. The test was precise, accurate and reliable, along with a good linearity for quantitation. The urinary pCalCit level was significantly decreased in CaOx stone patients compared with NSF individuals. The test had a good diagnostic performance for separating CaOx stone formers from NSF subjects. With the LH− of 0.2, the urinary miDA-pCalCit test could be clinically implemented as a quick, simple, and relatively cheap test for ruling out CaOx urolithiasis.
Supplemental Material
sj-docx-1-sci-10.1177_00368504251363660 - Supplemental material for Measurement of precipitated calcium citrate in 24-hour urine samples is clinically useful for ruling out calcium oxalate urolithiasis
Supplemental material, sj-docx-1-sci-10.1177_00368504251363660 for Measurement of precipitated calcium citrate in 24-hour urine samples is clinically useful for ruling out calcium oxalate urolithiasis by Chaiyadol Tantasith, Praween Tubsaeng, Kamonchat Boonkam, Natcha Madared and Chanchai Boonla in Science Progress
Footnotes
Authors’ contributions
CT was involved in performing experiments, methodology, conceptualization, and drafting the manuscript; PT in recruiting subjects and collecting 24-hour urine specimens; KB in FTIR experiment; NM in HPLC experiment; and CB in conceptualization, writing/revising manuscript, statistical analysis, supervision, and funding acquisition.
Funding
The author(s) disclosed receipt of the following financial support for the research, authorship, and/or publication of this article: The study was financially supported by grant from the program management unit for competitiveness (PMUC), Thailand (C10F640117, C01F660168 to CB), Thailand Science research and Innovation Fund Chulalongkorn University (CU_FRB65_hea(38)_045_30_26), and partially supported by the National Research Council of Thailand (NRCT) and Chulalongkorn University (N42A650265 to CB) and by the Ratchadapisaksompotch Fund, Graduate Affairs, Faculty of Medicine, Chulalongkorn University (GA66/090). CT received the 100th Anniversary Chulalongkorn University Fund for Doctoral Scholarship, Chulalongkorn University.
Declaration of conflicting interests
The authors declared no potential conflicts of interest with respect to the research, authorship, and/or publication of this article.
Data availability
No datasets were generated during the current study.
Supplemental material
Supplemental material for this article is available online.
References
Supplementary Material
Please find the following supplemental material available below.
For Open Access articles published under a Creative Commons License, all supplemental material carries the same license as the article it is associated with.
For non-Open Access articles published, all supplemental material carries a non-exclusive license, and permission requests for re-use of supplemental material or any part of supplemental material shall be sent directly to the copyright owner as specified in the copyright notice associated with the article.