
Abstract
Objective
Thyroid hormones are essential for energy expenditure and metabolism, and their dysfunction is associated with obesity. Vitamin D, besides its role in bone health, may influence thyroid function, especially in women with obesity, where deficiency is common and linked to altered thyroid hormone levels and sensitivity. This study aimed to investigate the relationship between vitamin D levels and thyroid function tests (TFTs) in euthyroid women with obesity.
Methods
This single-center, cross-sectional study was conducted in the obesity center of a tertiary hospital in Turkey, between July and September 2024. Women with a body mass index of 30 or higher and confirmed to be euthyroid based on TFTs were included, while those receiving thyroid medications or lacking concurrent 25-hydroxyvitamin D (25(OH)D) measurements were excluded. Data were collected retrospectively from the hospital's information management system, and participants were categorized into three groups based on their 25(OH)D levels (<20 ng/mL, 20–29.9 ng/mL, ≥ 30 ng/mL).
Results
The study included 158 participants. No significant associations were observed between thyroid stimulating hormone (TSH) levels and participant characteristics or 25(OH)D levels. In contrast, thyroxine (T4) levels were significantly higher in participants with diabetes mellitus (DM), those without psychiatric disorders, and those with 25(OH)D levels of 30 ng/mL or higher compared to others. ANCOVA analysis adjusted for DM and psychiatric disorders confirmed significant differences in T4 levels among the 25(OH)D groups.
Conclusion
This study suggests that vitamin D levels may be associated with T4 levels in euthyroid women with obesity. Although no link was found with TSH, the findings suggest that further research is needed on the potential role of vitamin D in thyroid function. These preliminary findings may also highlight the clinical relevance of monitoring and managing vitamin D levels in individuals with obesity.
Keywords
Introduction
Thyroid hormones play multiple roles in homeostatic control, including energy expenditure and metabolism, and thyroid disorders have been associated with various metabolic disturbances, including obesity.+ One study reported that even slight increases in serum thyroid stimulating hormone (TSH) concentrations within the reference range may be linked to weight gain. 2 Another study conducted on children with obesity who underwent lifestyle interventions demonstrated that both baseline thyroid function tests (TFTs) levels were associated with changes in body mass index (BMI), and alterations in TFTs during the intervention period correlated with weight gain after the intervention. 3
Beyond its established role in calcium homeostasis and bone health, research indicates that vitamin D is also associated with broader physiological processes, including immune modulation, inflammation, and endocrine regulation.4,5 Consequently, the potential link between vitamin D status and thyroid function has become a subject of increasing investigation.6,7 The expression of vitamin D receptors and vitamin D metabolizing enzymes in thyroid tissue supports a possible regulatory role.8,9 The higher prevalence of autoimmune thyroiditis in individuals with vitamin D deficiency also suggests a common immunopathogenic pathway.10–12 Studies have shown that vitamin D deficiency, even in euthyroid individuals, may be associated with changes in thyroid hormone levels and sensitivity.9,13 Chronic low-grade inflammation, insulin resistance, and adipokine dysregulation inherent in obesity further complicate this interaction by affecting both vitamin D metabolism and thyroid hormone activity.14,15 Although growing evidence supports these associations, due to inconsistency in results across studies, it is still difficult to draw any definitive conclusions about how vitamin D status affects thyroid function. 9
Vitamin D deficiency is particularly prevalent among individuals with obesity, due to volumetric dilution and sequestration in adipose tissue, decreased cutaneous synthesis, and lifestyle factors such as reduced sun exposure and physical inactivity.16–18 Women are also more prone to both vitamin D deficiency and thyroid dysfunction due to hormonal and immunological factors.19–21 Given the high prevalence of both conditions in women with obesity and the limited evidence in current literature, clarifying this relationship may have significant clinical implications. Therefore, the present study aims to investigate the association between vitamin D levels and TFTs specifically in euthyroid women with obesity, to contribute to a deeper understanding of the endocrine effects of vitamin D.
Methods
Design and setting
This single-center, cross-sectional study was conducted between July and September 2024 at the Obesity Center of Kanuni Training and Research Hospital, in Trabzon Province, northeastern Türkiye. This hospital is a tertiary healthcare facility, and the obesity center serves individuals aged 18 and over with a BMI of 30 and higher. At the center, a multidisciplinary team provides lifestyle modification interventions and/or medical treatments, with patients who were followed-up for 9 months through group meetings. During the initial visit, a comprehensive evaluation is performed, including detailed obesity-related history, physical examination findings, and laboratory parameters. These include measurements of TSH and thyroxine (T4) for possible thyroid dysfunction and 25-hydroxyvitamin D (25(OH)D) levels for potential vitamin D deficiency. At each visit, all patient data is recorded and stored electronically in the hospital information management system. For the study, approval was received from the Health Sciences University Trabzon Faculty of Medicine Scientific Research Ethics Committee on 27.02.2024 and 2023/26. Voluntary written informed consent was obtained from the patients participating in the study. The reporting of this study complies with the STROBE guidelines. 22
Participants
The study population consisted of women with a BMI of 30 and higher who had been followed-up at the center within the past year. Individuals confirmed to be euthyroid based on their initial TFTs were included in the study. However, those who were clinically euthyroid but were receiving levothyroxine for hypothyroidism or methimazole/propylthiouracil for hyperthyroidism were excluded. This approach was intended both to address the gap in the literature regarding the impact of vitamin D status on thyroid function in euthyroid individuals and to minimize the potential confounding effects of thyroid disorders and their treatments on TSH and T4 levels. Additionally, participants without a simultaneous measurement of 25(OH)D levels at the time of evaluation were not included. No priori sample size calculation was performed. Instead, all eligible participants meeting the inclusion and exclusion criteria within the defined population were included in the study.
Data collection and variables
The data for this study were retrieved retrospectively from the hospital information management system, starting with the most recent patient. In the first step, it was determined whether the patient had simultaneous 25(OH)D, TSH, and T4 measurements at the time of admission. In the second step, patients were evaluated for euthyroidism based on their TSH and T4 levels using the reference ranges provided by the hospital laboratory (0.38–5.33 mIU/L for TSH, 0.58–1.38 ng/dL for T4). Patients with measurements outside these ranges were excluded from the study. TSH and T4 values were recorded as the dependent variables of the study. In the third step, the use of levothyroxine, methimazole, or propylthiouracil was examined, and individuals using these drugs were excluded. In the fourth step, 25(OH)D values measured concurrently with the TFTs were recorded. Based on these values, patients were categorized into three groups (below 20 ng/mL, 20–29.9 ng/mL, 30 ng/mL and above). This categorization served as the primary independent variable of the study. Finally, data on age, marital status, smoking status, comorbidities, BMI, and body fat percentage were included as potential covariates. The study flow diagram is schematized in Figure 1.

Study flow diagram.
Since the study was based on retrospective data collection and information on whether participants were taking vitamin D supplements was not systematically recorded in the hospital information management system, supplement use was not an exclusion criterion. Considering individual variations in vitamin D metabolism and bioavailability, and the potential for inaccuracies in patients’ reported supplement use, direct measurement of serum 25(OH)D levels was deemed a more objective assessment of vitamin D status.
Blood samples were collected in gel-containing serum biochemistry tubes (without an anticoagulant) from all participants. After collection, samples were centrifuged at 4000 rpm for 10 min to separate serum. All analyses were conducted on the same day, and no samples were stored for later evaluation. Serum TSH, T4, and 25(OH)D levels were measured using the Beckman Coulter DxI 800 hormone autoanalyzer, employing the manufacturer's validated chemiluminescent immunoassay kits.
Body fat percentage were determined according to BIA measurements performed using a calibrated multi-frequency segmental body composition analyzer (TANITA MC-780 MA, TANITA Health Equipment H.K. Limited, Tokyo, Japan).
Statistical analysis
Data were analyzed using SPSS version 23.0 (IBM, Chicago, USA). Descriptive statistics were calculated, and the normal distribution of numerical variables was assessed using kurtosis and skewness values. Comparisons for TSH and T4 values were performed using Pearson or Spearman correlation analysis, independent samples t-test, and one-way ANOVA. To examine T4 levels according to 25(OH)D groups, ANCOVA analysis was conducted, with variables that showed significant differences in the univariate tests added as covariates. Numerical data are presented as mean ± standard deviation or median [interquartile range], and categorical data are presented as number (percentage). A statistical significance level of p < 0.05 was considered.
Results
The study was completed with 158 patients who met the inclusion criteria. The participants had a mean age of 43.37 ± 12.45 years, and hypertension was the most common comorbidity, present in 58 (36.7%) of the participants. The mean BMI was 39.14 ± 5.46 kg/m², while the mean TSH and T4 levels were 1.84 ± 0.95 mIU/L and 0.88 ± 0.11 ng/dL, respectively. The median 25(OH)D level was 12.85 [9.42] ng/mL, and 14 (8.9%) participants had 25(OH)D levels of 30 ng/mL or higher. The descriptive characteristics of the participants are presented in Table 1.
The descriptive characteristics of the participants.

Numerical data are presented as mean ± standard deviation or median [interquartile range], and categorical data are presented as number (percentage).
TSH: thyroid stimulating hormone.
No statistically significant associations were found between TSH levels and the descriptive characteristics of participants or 25(OH)D levels (all p > 0.05). However, participants with diabetes mellitus (DM) had significantly higher T4 levels compared to those without DM (0.92 ± 0.13 vs. 0.87 ± 0.11, p = 0.047). In contrast, participants without psychiatric disorders exhibited higher T4 levels compared to those with such conditions (0.89 ± 0.11 vs. 0.82 ± 0.12, p = 0.002). Although there was no significant correlation between 25(OH)D levels and T4 (r = 0.029, p = 0.722), participants with 25(OH)D levels of 30 ng/mL or higher had higher T4 levels compared to other 25(OH)D groups (0.96 ± 0.12 vs. 0.87 ± 0.11 and 0.84 ± 0.11, p = 0.008). The relationships between TSH and T4 levels and descriptive characteristics of the participants are summarized in Table 2.
The relationships between TSH and T4 levels and descriptive characteristics of the participants.
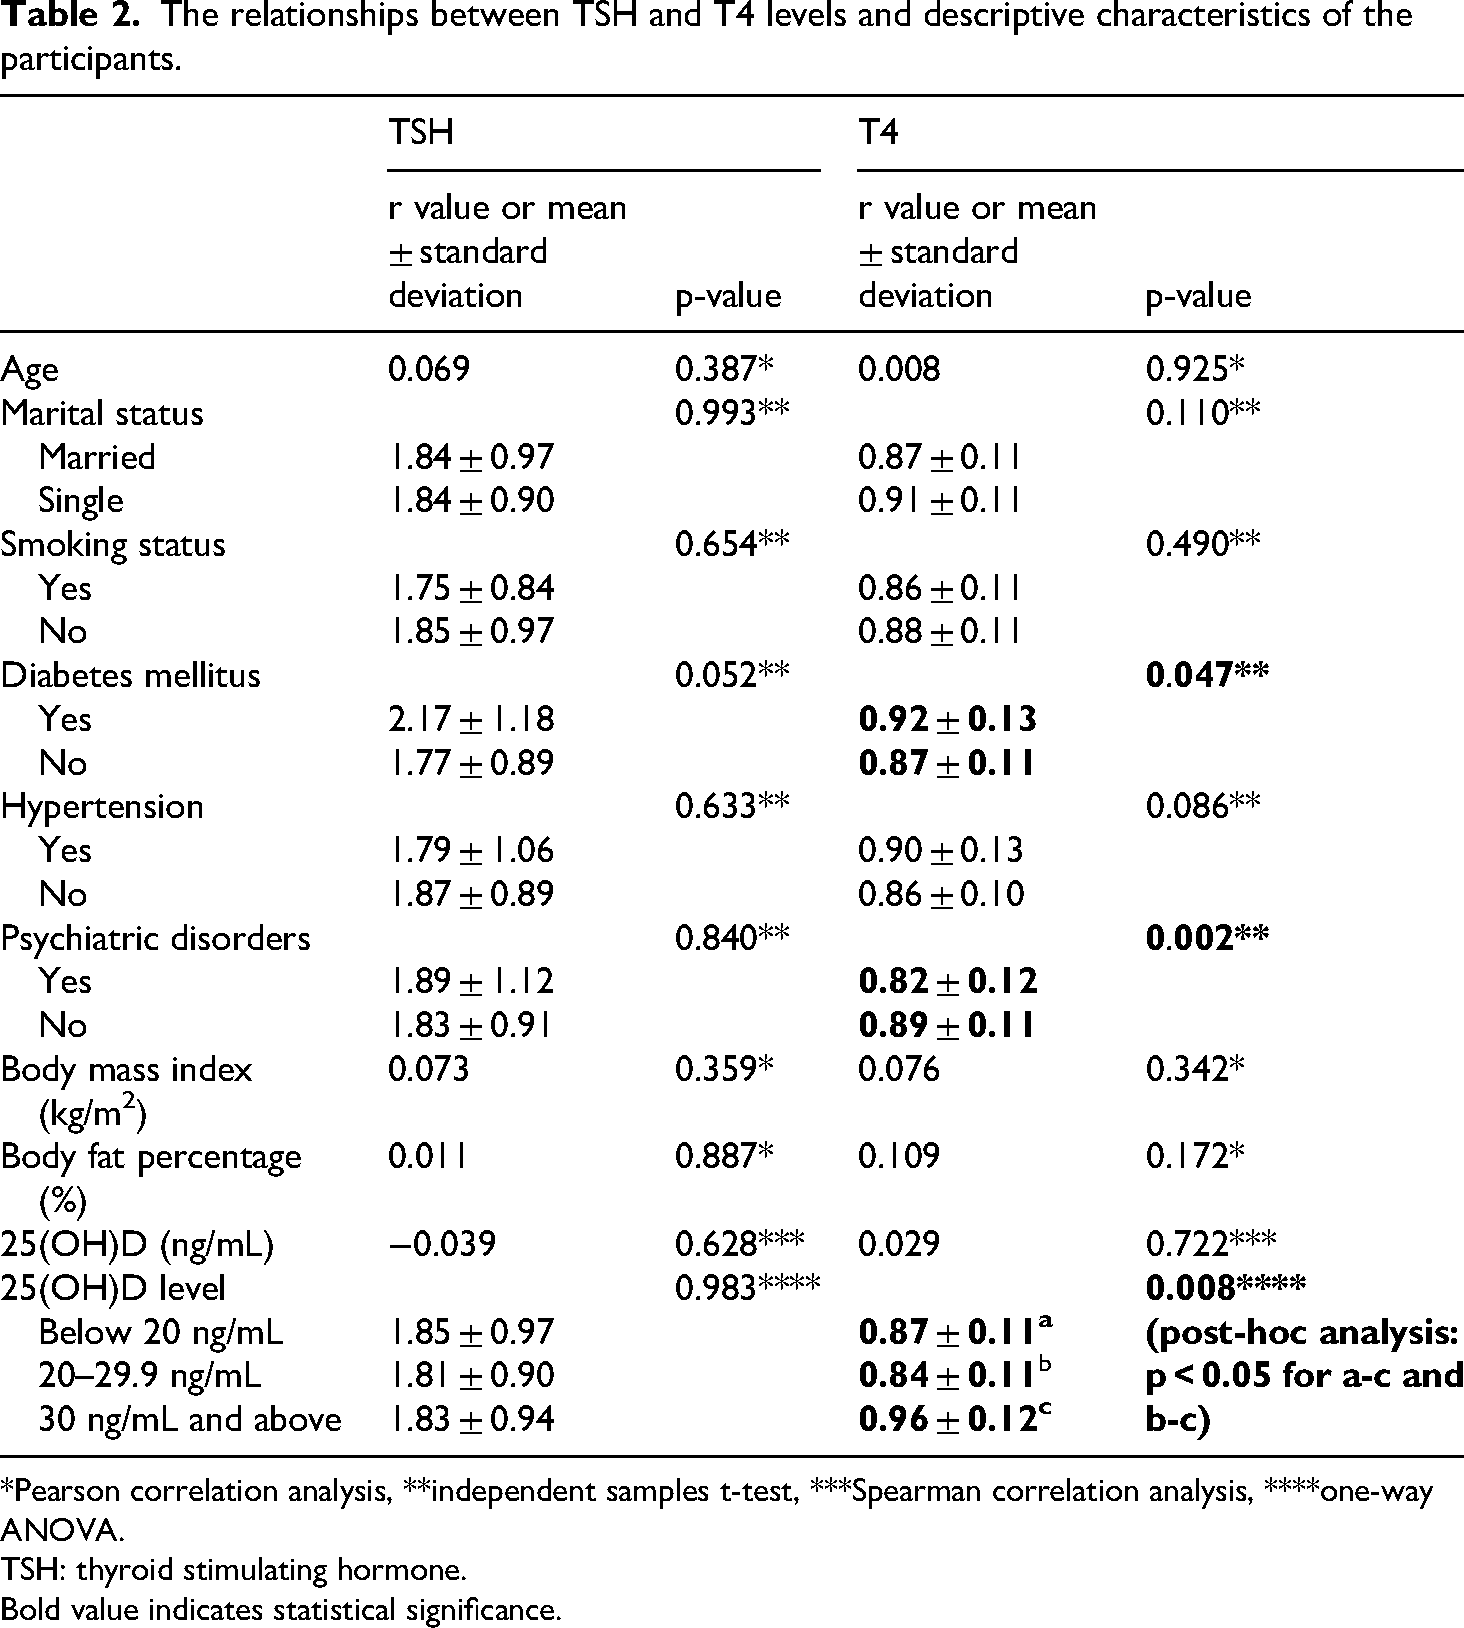
*Pearson correlation analysis, **independent samples t-test, ***Spearman correlation analysis, ****one-way ANOVA.
TSH: thyroid stimulating hormone.
Bold value indicates statistical significance.
An ANCOVA analysis, which included DM and psychiatric disorders as covariates (as they showed significant differences in the univariate comparisons), revealed significant differences in mean T4 levels across the 25(OH)D groups (F (2, 153) = 3.086, p = 0.049, η²=0.039). The results of the ANCOVA analysis are detailed in Table 3.
The results of the ANCOVA analysis.

Levene's test results: F = 0.117, p = 0.889.
Dependent variable: T4 levels, independent variables: vitamin D levels, covariates: diabetes mellitus, psychiatric conditions, p = 0.022 for a-c, p = 0.023 for b-c.
Post-hoc power analysis
To evaluate the adequacy of the sample size (n = 158), a post-hoc power analysis was conducted based on the ANCOVA test results. The partial eta squared for the corrected model was 0.130, corresponding to an effect size of 0.387 (a medium effect size according to Cohen's guidelines). The independent variable consisted of three categories, and two covariates were included in the model. With an alpha level set at 0.05, the power of the study was calculated as 0.994 using the G*Power software.
Discussion
In this study, which examined the relationship between vitamin D levels and TFTs in euthyroid women with obesity, no significant relationship was found between vitamin D levels and TSH. This result differs from previous studies showing that vitamin D levels are related to TSH.23–25 In our study, it was concluded that participants with vitamin D levels of 30 ng/mL and above had higher T4 levels than other vitamin D groups. There are not many studies in literature examining the relationship between vitamin D and T4 levels in euthyroid individuals, and the results of the existing studies are not consistent. For example, one study reported an inverted U-shaped relationship between T4 levels and vitamin D, while two other studies found a negative and significant correlation.26,27 These discrepancies may stem from differences in study populations, analytical methods, or the thresholds used to define vitamin D status.
Data from animal and cell models suggest that vitamin D may have both central and peripheral effects on thyroid hormones.9,28 A study on diabetic rats showed that vitamin D supplementation increased the expression of the Dio2 enzyme, which enables the peripheral conversion of T4 to T3, and therefore fT3 levels increased while fT4 levels decreased. 29 This is a finding contrary to our study and suggests that human physiology has more complex homeostatic regulations and the effect of obesity on this process. In vitro studies have shown that calcitriol administration suppresses the effect of TSH, and it has also been reported that it can increase TSH secretion in response to TRH stimulation. 28 These bidirectional effects indicate that the effect of vitamin D on TSH may be context-dependent and complex. Indeed, in our study, no significant relationship was found between TSH and vitamin D levels.
In this study, we found that T4 levels were higher in diabetic participants. A study in China reported that increased T4 levels were independently associated with a higher prevalence of type 2 DM in men and women. 30 This finding is consistent with our study and is also consistent with literature showing that thyroid dysfunction is more common in diabetic patients. 31 It is thought that untreated thyroid dysfunction may negatively affect the metabolic control of diabetic individuals and make DM management more difficult. 31 These results demonstrate the importance of screening thyroid function in diabetic patients.
In our study, it was determined that the vitamin D level was below 20 in a significant portion of the patients. A study conducted in Turkey confirmed that the claims that vitamin D levels are largely low all over the world are also valid for our country.32,33 Causes of vitamin D deficiency include dark skin color, insufficient sunlight, atmospheric pollution, clothing style, obesity, use of sunscreen, and not taking supplements. 34 The result was not surprising since the patients participating in our study were obese and did not get enough sunlight due to their conservative clothing style.
In two previous studies, it was observed that T4 levels were higher in depressed individuals compared to healthy individuals.35,36 In our study, the fact that participants without psychiatric disorders exhibited higher T4 levels than those with such disorders raises questions about whether this difference is due to biological or environmental factors. This situation indicates that further studies are needed to examine the effects of psychiatric disorders on thyroid functions in more depth.
Our study has some limitations. First, our study has a cross-sectional design; therefore, it is not possible to make a definitive conclusion about causality. As an observational study, our findings suggest potential associations rather than establishing causal relationships. Additionally, only euthyroid women with obesity were included in the study, which is a limitation that should be considered when extrapolating the results to the general population. In addition, the retrospective data retrieved from the hospital information management system may have inherent limitations regarding data accuracy, including reliance on patient self-reports. Although our post-hoc power analysis indicated adequate statistical power for the primary outcome, the sample size of 158 participants might still limit the generalizability of our findings or the ability to detect more subtle associations. Future prospective studies would benefit from a more detailed examination of the long-term effects of vitamin D levels on thyroid function.
The strengths of this study include the selection of a homogeneous patient group (euthyroid women with obesity). This allowed for clearer and more significant results compared to the general population. Furthermore, considering the limited number of studies in the literature on the relationship between vitamin D and thyroid hormones, this study fills an important gap in this area.
Conclusion
This study offers preliminary insights into the relationship between vitamin D levels and TFTs in euthyroid women with obesity. While no significant association was found between vitamin D levels and TSH, participants with vitamin D levels of 30 ng/mL or higher appeared to have higher T4 levels compared to those with lower vitamin D levels. This finding suggests a potential role of vitamin D in thyroid hormone regulation, although the exact mechanisms remain unclear. The study also points to the complexity of thyroid function in individuals with obesity and chronic conditions such as DM, suggesting that individual factors may influence thyroid hormone levels. Future prospective studies are needed to further explore the long-term effects of vitamin D on thyroid function and to clarify the underlying biological mechanisms. Despite the limitations of our cross-sectional design, this research may contribute to the growing body of evidence on the interplay between vitamin D and thyroid hormones, particularly in the context of obesity, and may underscore the importance of vitamin D management in clinical practice.
Footnotes
Acknowledgments
None.
Ethics approval
This study was performed in line with the principles of the Declaration of Helsinki. Approval was received from the Health Sciences University, Trabzon Faculty of Medicine, Scientific Research Ethics Committee on 21.06.2023 and decision number 2023/26.
Consent to participate
Informed consent was obtained from all individual participants included in the study.
Authors' contributions
All authors contributed to the study conception and design. Material preparation, data collection and analysis were performed by AYB and YC. The first draft of the manuscript was written by AYB and authors commented on previous versions of the manuscript. Authors read and approved the final manuscript.
Funding
The authors received no financial support for the research, authorship, and/or publication of this article.
Declaration of conflicting interests
The authors declared no potential conflicts of interest with respect to the research, authorship, and/or publication of this article.
Data availability statement
The data used in this study are available upon reasonable request from the corresponding author.