
Abstract
Objective
Hirschsprung's disease (HSCR) is a rare congenital disorder attributed to the defects of enteric neural crest cells. We aim to identify characteristic phosphorylation proteins and preliminarily explore underlying related action mechanisms in HSCR.
Methods
Colon samples from HSCR patients underwent proteomic and phosphoproteomic sequencing to identify differentially expressed phosphoproteins (DEPPs) and proteins (DEPs). Interaction network construction and analysis of correlations with upstream phosphorylating kinases were employed to pinpoint core proteins. HSCR rat models were established through enema administration of Benzalkonium chloride and evaluated by measuring colon cross-sectional area, colon weight, AchE, and PGP9.5 levels. Histopathological damage was assessed via hematoxylin and eosin staining. Protein expression was analyzed using western blotting. Furthermore, the impact of SRC kinase in HSCR was investigated utilizing an SRC-specific inhibitor in HSCR rat models.
Results
A total of 5725 DEPPs were identified, with SRC kinase emerging as a key regulatory protein. In the HSCR rat model, SRC expression was elevated along with increased pCAV1 and FLNA levels. Notably, inhibition of SRC protein kinase activity by 1-(tert-butyl)-3-(4-chlorophenyl)-1H-pyrazolo[3,4-d] pyrimidin-4-amine (PP2) led to reduced colon cross-sectional area and weight, an increase in the number of colonic ganglion cells, heightened AchE levels, enhanced PGP9.5 expression, and slight enlargement of the crypt, thereby alleviating HSCR symptoms in rats. Additionally, SRC kinase inhibition following PP2 treatment decreased the expression of pCAV1 and FLNA.
Conclusions
Inhibition of SRC kinase activity may potentially reduce CAV1/FLNA expression, ultimately alleviating the severity of HSCR in rats.
This is a visual representation of the abstract.
Introduction
Hirschsprung's disease (HSCR), a rare congenital disorder characterized by the absence of enteric ganglion cells due to defects in the development of enteric neural crest cells, affects approximately one in every 5000 live births globally.1,2 Surgical excision of the aganglionic portion of the intestine is considered an inevitable therapeutic approach for HSCR. 3 However, up to 30–50% of patients still experience persistent obstructive symptoms, and severe stasis of gut contents possibly contributes to life-threatening enterocolitis.1,4–6 Therefore, continued research to better understand the complex pathogenesis behind HSCR holds promise and offers perspectives for developing novel therapeutic approaches in the management of HSCR.
SRC is the most representative member of the Src family kinases, a class of tyrosine kinases engaged in regulating signal transduction.7,8 SRC kinases enable apoptotic cells to extrude apically by relaxing adherent connections between neighboring cells. 9 The activation of SRC kinase is closely associated with chronic lung diseases, 10 renal fibrosis, 11 and systemic sclerosis. 12 Src family kinases can prevent intestinal epithelial cells from differentiating by inhibiting the Hippo effector YAP1. 13 TNFR1-dependent transactivation of EGFR facilitates the survival of colon epithelial cells through an SRC-dependent mechanism by stimulating COX-2 expression. 14 However, many aspects of the specific role of SRC kinase, particularly in HSCR, remain currently unclear.
Caveolin-1 (CAV1), a 21-kDa scaffolding protein vital for membrane sculpting within caveolae and lipid rafts, is involved in regulating various cellular processes.15,16 Filamin A (FLNA) is a cytoplasmic actin-binding protein essential for sustaining the linear distribution of CAV1, which dependents on F-actin. 17 Therein, CAV1 may act as a critical therapeutic target for atherosclerosis, 18 hepatic fibrosis, 19 and renal thrombotic microangiopathy. 20 Reduced expression of CAV1 in the bowel of patients with HSCR may enhance the susceptibility to HSCR-related enterocolitis. 21 Besides, FLNA has been identified as a significant novel mediator in cardiovascular remodeling and plays a crucial role in the etiology of respiratory disorders and Alzheimer's disease.22,23 FLNA expression is initially revealed in the small intestine during early stages of human fetal development. 24 However, the specific functions of FLNA, and the correlations among SRC kinase, CAV1, and FLNA in the development of HSCR are largely unknown.
Herein, we determined differentially expressed phosphoproteins (DEPPs), and critical phosphorylated upstream kinases by combining comprehensive bioinformatics methods following proteomics and phosphoproteomics. Subsequently, we aimed to elucidate the specific function of SRC kinase in HSCR, and the relevance among SRC kinase, CAV1, and FLNA, which may help tremendously in our understanding of the complex pathogenesis against HSCR.
Materials and methods
Sample preparation
This study enrolled six participants diagnosed with HSCR. The inclusion criteria were as follows: a definitive diagnosis of short-segment HSCR, confirmed by the absence of meconium passage within 24 h, a history of constipation and abdominal distension, clear identification of the narrow and dilated segments via barium enema, with the narrow segment confined to the distal rectosigmoid region, and an absent rectoanal inhibitory reflex. Exclusion criteria included the presence of other congenital anomalies or syndromes, long-segment or total colonic HSCR, and concurrent enterocolitis. Specific patient information has been provided in the Supplemental material. For sample collection, specimens were obtained during the definitive surgical procedure for HSCR, which involves the resection of both the distal narrow segment and a portion of the proximal dilated segment. Specifically, the experimental group consisted of aganglionic segments, while the control group comprised ganglionic segments. All samples were collected following standardized protocols to ensure consistency and reliability in the analysis.
This study adhered to the principles of the Declaration of Helsinki (1975, revised 2013). Informed consent forms were provided to and signed by the legal guardians of the infant participants. Ethical approval for this study was obtained from the Ethics Committee of Guangzhou Women and Children Medical Center (Guangzhou, China). The approval number is 2017102706, and the date of approval is 2 November 2017.
Protein extraction and phosphorylated peptide enrichment
The distal narrowed segments (Experimental group, N = 6) and the proximal expanded segments (Control group, N = 6), excised from HSCR patients undergoing total colon resection, were subjected to proteomic and phosphoproteomic sequencing. The global proteome and phosphorylated proteome analysis was conducted at PTM Biolabs Inc. (Hangzhou, China). The specific method is outlined in the Supplemental materials. Briefly, the tissues were individually ground into powder in liquid nitrogen, lysed with lysis buffer, and sonicated in an ice-water bath for 5 min. After centrifugation at 12,000 g for 10 min at 4 °C, the supernatant was collected, and transferred to a fresh centrifuge tube. The protein concentration was then quantified using a BCA Protein Assay Kit (Beyotime, Shanghai, China), and the integrity was evaluated by electrophoresis. The peptide preparation involved digestion with a 1:50 trypsin-to-protein mass ratio at 37 °C for 4 h, then the peptides were labelled using a TMT kit (Thermo Fisher Scientific Incorporation, MA, USA), and underwent fractionation with high-pH reverse-phase high-performance liquid chromatography, using an Agilent 300Extend C18 column (5-μm particles, 4.6-mm ID, 250-mm length) to reduce the sample complexity. The peptide mixtures were dissolved in binding buffer (50% acetonitrile/6% trifluoroacetic acid), and loaded onto a pre-treated IMAC-Fe column for phosphopeptide enrichment. The bound peptides were eluted with 0.1% trifluoroacetic acid (Sigma-Aldrich, St. Louis, MO, USA), and the eluted fractions were lyophilized to obtain the enriched phosphopeptides.
Identification of differentially expressed proteins (DEPs) and DEPPs
The resulting peptides were desalted according to the instructions, and then collected followed by liquid chromatography coupled with tandem mass spectrometry analysis using an EASY-nLCTM 1200 UHPLC system and a Q ExactiveTM HF-X mass spectrometer (Thermo Fisher Scientific Incorporation). The specific method is outlined in the Supplemental materials. To ensure the reliability and precision of subsequent bioinformatics and statistical analyses, the search database analysis results required further data filtration. In this experiment, a stringent data filtration approach was adopted, where the accuracy of peptide and protein identifications was set with a false discovery rate (FDR) threshold of 1%. Each identified protein was required to contain at least one unique peptide. To identify DEPs and DEPPs, a fold change cutoff of ≥1.2 (either up or downregulation) combined with a P-value ≤0.05 from a t-test were used as the threshold criteria.
Combined analysis of proteomics and phosphorylated proteomics
The conjoint analysis of proteomics and phosphoproteomics was conducted to validate changes in protein phosphorylation levels within colon tissues from HSCR patients. The selection criteria for DEPs and DEPPs were set as a fold change of ≥1.2 and a P-value (from t-test) of ≤0.05. A Venn diagram was generated using the EVenn tool (http://www.ehbio.com/test/venn/#/) to compare the proteomics and phosphoproteomics data. Basic identification statistics and group comparisons were conducted using principal component analysis (PCA) and correlation analysis to outline the dataset characteristics. Expression differences were visualized through volcano plots, butterfly plots, and bar charts. We utilized the Gene Ontology (GO) and Kyoto Encyclopedia of Genes and Genome (KEGG) pathways to conduct biological function enrichment analyses of the DEPPs via the “clusterProfiler” of R package. Finally, a de-background joint analysis was performed to identify phosphorylation events genuinely regulated by kinase activity. Subcellular localization analysis was performed using WoLF PSORT 4 software (https://wolfpsort.hgc.jp/), which predicted protein subcellular localization based on sorting signals, amino acid composition, and functional motifs. For this analysis, we selected “animal” as the type of protein sequence and inputted the protein sequences in FASTA format or as a file. The WoLF PSORT software then outputs subcellular localization results for each protein.
De-background joint analysis
The phosphorylated proteins with a P-value less than 0.05 and exhibiting the most intense expression changes (50 up and 50 down respectively) were selected as target proteins for direct protein–protein interaction network analysis. Indirect interaction network analysis was performed between these 100 target proteins and all proteins identified in this project (provided in Supplemental materials). The target protein IDs were used to search for direct or indirect interactions with the target proteins in the Search Tool for the Retrieval of Interacting Genes (STRING, https://cn.string-db.org/) database. High-confidence interactions (score ≥0.7) were visualized using AnyChart software (version 8.11.0.1934). For phosphorylation upstream kinase prediction analysis, the phosphorylation modification database of the corresponding species was downloaded from the SIGnaling Network Open Resource 5 (SIGNOR) (V2.0) (https://signor.uniroma2.it/). The differentially phosphorylated sites identified in the project were then matched with the database information to obtain the upstream kinase information for these phosphorylation sites. Kinase activity prediction analysis was performed using Kinase-Substrate Enrichment Analysis (KSEA), which involved comparing our dataset of differentially phosphorylated peptides against the SIGNOR (V2.0) and PhosphoSitePlus databases (as of 24 June 2021). This comparison focused on changes in phosphorylation patterns to infer alterations in kinase activities. Z-scores were calculated based on these comparisons, where a Z-score > 0 indicated increased kinase activity, while a Z-score < 0 suggested decreased activity. Higher absolute Z-scores denoted stronger predictions of kinase activation or inhibition.
In vivo animal experiments
All Sprague-Dawley rats, aged 8–9 weeks and weighing 240–260 g, were provided by Beijing Sibeifu Bioscience Co., Ltd (Beijing, China). All animal experiments were conducted following strict adherence to ethical guidelines for animal research. 25 The animals were housed in an environment that ensured their well-being and comfort, maintained in climate-controlled rooms with a 12-h light/dark cycle, at a temperature of 22 ± 2 °C and a relative humidity of 50–60%. Adequate ventilation was provided to ensure a constant supply of fresh air, and all animals had free access to food and clean water. Rats were randomly divided into the control group (Sham), the HSCR group, and an SRC kinase inhibitor intervention (1-(tert-butyl)-3-(4-chlorophenyl)-1H-pyrazolo[3,4-d] pyrimidin-4-amine, PP2) group (HSCR + PP2), with 6 rats in each group. After preoperative fasting for 12 h and water deprivation for 6 h, the HSCR model was established using benzalkonium chloride solution (BAC) as previously described. 26 Briefly, the rats in both the HSCR and HSCR + PP2 groups were anesthetized through the inhalation of 2.5% isoflurane. Following abdominal incision, a segment of the descending colon was exteriorized and maintained in a moistened state by encircling it with approximately 1 cm of gauze strip, which was intermittently soaked with 0.1% BAC solution (Sigma-Aldrich, St Louis, MO, USA) every 5 min to prevent colonic dehydration. The strips were removed after 40 min, then the serosa was washed with warm 0.9% saline and the abdomen was closed. For the control group, the rats underwent the same operation but with an equivalent volume of 0.9% saline solution. In the HSCR + PP2 group, the model rats were administered 2 mg/kg of PP2, which served as the inhibitor of SRC kinase, via intraperitoneal injection per day for 2 weeks. 27 After 4 weeks, rats were deeply anesthetized by inhaling 2.5% isoflurane (Rayward, Shenzhen, China) for 2–3 min and then euthanized by cervical dislocation. Blood was collected via cardiac puncture using sterile syringes to ensure minimal contamination and maintain the integrity of the samples for subsequent biochemical analysis. The colon tissues were harvested for imaging, weighing, measuring the cross-sectional area, and other histological examinations.
All animal experiments were conducted following strict adherence to ethical guidelines for animal research, including the “Guide for the Care and Use of Laboratory Animals, 8th Edition.” 25 We made concerted efforts to minimize the number of animals used and to decrease their suffering throughout the study. This included using appropriate statistical methods to determine the minimum number of animals required for valid results, employing humane endpoints to avoid unnecessary distress, and utilizing anesthesia or analgesia during all procedures. The reporting of this study conforms to ARRIVE 2.0 guidelines. 28 The protocol for this study was reviewed and approved by the Guangzhou Medical University Experimental Animal Ethics Committee (China, Guangzhou). The approval number is G2023-403, and the date of approval is 28 February 2023.
Hematoxylin and eosin (H&E) staining
The colon tissues were fixed in 4% paraformaldehyde overnight, paraffin-embedded, and sectioned into 4-micrometer-thick slices. These sections were dewaxed with xylene, rehydrated through a series of ethanol solutions, and stained with H&E. Finally, the stained sections were rinsed, dewaxed, sealed, and monitored under a fluorescence microscope (IX71, Olympus, Tokyo, Japan).
Enzyme-linked immunosorbent assay (ELISA)
The acetylcholinesterase (AchE) content was measured by an ELISA kit (Esebio, Shanghai, China). Briefly, the collected serum was centrifuged, and aliquots were dispensed into 96-well plates, followed by incubating with biotinylated antibodies, and streptavidin-conjugated horseradish peroxidase. Finally, the concentrations of samples were detected by a microplate reader (ELx808, BioTek, Winooski, VT, USA) and calculated using a standard curve.
Western blot analysis
Total protein was extracted, quantified, passed through SDS-PAGE, and then electroblotted onto polyvinylidene fluoride membranes. The membranes were then blocked with 5% non-fat milk for 2 h, followed by overnight incubation at 4°C with the respective primary antibodies targeting SRC (ab133283, 1:1000, Abcam, Cambridge, UK), pCAV1 (ab38468, 1:1000, Abcam), CAV1 (ab32577, 1:1000, Abcam), FLNA (ab76289, 1:250000, Abcam), PGP9.5 (ab109261, 1:1000, Abcam), and β-actin (4967S, 1:1000, Cell Signaling Technology). After washing, the membranes were incubated with the corresponding secondary antibodies (1:5000; Beyotime, Shanghai, China), then the immunoreactive protein bands were detected by an imaging system (Tanon 5200, Shanghai, China) and quantified using Image J software (V1.8.0.112, NIH, Madison, WI, USA), with β-actin as an internal control.
Statistical analysis
In both proteomic and phosphoproteomic analyses, peptide and protein identifications were rigorously filtered using a 1% FDR threshold adjusted by the Benjamini & Hochberg method to ensure high-confidence matches. Proteins were required to contain at least one unique peptide for unambiguous identification. For the integrated analysis of proteomics and phosphoproteomics data, DEPs and DEPPs were defined by a dual threshold: an absolute fold change ≥1.2 (indicating upregulation or downregulation) combined with a statistically significant P-value ≤ 0.05 derived from two-tailed Student's t-tests. For all experimental data, we performed statistical analyses using GraphPad Prism 8.0 (GraphPad Software, San Diego, CA). Continuous variables with normal distribution (verified by Shapiro-Wilk test) are expressed as mean ± standard deviation (SD) and analyzed by two-tailed unpaired Student's t-test for two-group comparisons. For multi-group comparisons, one-way ANOVA with Tukey's post-hoc test was applied after confirming variance homogeneity (Levene's test, P > 0.05). Statistical significance was defined as P < 0.05.
Results
Distribution of detected proteins and phosphoproteins
We identified and quantified numerous proteins and phosphoproteins between HSCR and normal samples. The identifications and quantifications results were presented in the bar graphs (Figure 1(A) and (B)) (Supplemental Table 1). By comparing the proteomics and phosphoproteomics data, there were 3557 protein groups in both non-phosphorylated and phosphorylated states (Figure 1(C)).

Distribution of detected proteins and phosphoproteins. (A) Differentially expressed proteins (DEPs) in HSCR tissues. (B) Differentially expressed phosphorylated proteins (DEPPs) in HSCR tissues. (C) Venn diagram highlighting the number of unique proteins identified in the proteome (purple circle) with the number of unique phosphoproteins (orange). The intersection shows proteins identified in both the proteome and phosphoproteome.
Identification of differentially expressed proteins and phosphoproteins
After data processing, a total of 356 DEPs were screened, with 257 upregulated and 99 downregulated proteins among the groups (Figure 2(A)). Similarly, 4183 DEPPs were found, including 2301 upregulated and 1882 downregulated phosphoproteins (Figure 2(B)). Volcano plots displayed all DEPs and DEPPs, respectively (Figure 2(C) and (D)). The top 15 most DEPs and phosphoproteins (up-regulated and down-regulated) were represented by butterfly diagrams (Figure S1A-B). The top 10 enriched GO terms in cellular component (CC), biological process (BP), and molecular function (MF) of DEPs (Figure S2A-C) and DEPPs (Figure S2D-F) were screened and visualized in the butterfly charts. KEGG enrichment analysis results of DEPs and DEPPs revealed the top 10 pathways with the lowest P-values (Figure S3A-B).

Identification of differentially expressed proteins and phosphoproteins. (A) The bar graph of up- and down-regulated DEPs. (B) The bar graph of up- and down-regulated DEPPs. (C) Volcano plot highlighting DEPs among groups. Upregulated DEPs are colored blue, and downregulated proteins are colored green. (D) Volcano plot showing DEPPs among groups. The blue represents the significantly up-regulated phosphoproteins and the green is the significantly down-regulated phosphoproteins.
Conjoint analysis proteomics and phosphoproteomics
To further evaluate changes in protein phosphorylation levels within colon tissues from HSCR patients, we conducted a combined analysis of data about proteomics and phosphoproteomics. A total of 5725 DEPPs were extracted, with 3239 being upregulated and 2486 downregulated, which were depicted in a volcano plot and a bar chart (Figure S4A-B). Besides, a heat map of all DEPPs was generated (Figure S4C).
To gain deeper insights into the biological processes and pathways in which these 5725 DEPPs were involved, thereby influencing the onset and progression of HSCR, functional enrichment analysis was performed. The top 10 results from the GO analysis were shown under each item of BP including regulation of cell morphology and axon guidance; MF such as actin filament binding and protein kinase C binding; and CC like tubulin complex, focal adhesion (Figure 3(A) and (B)). KEGG pathway with top 20 pathways mainly participated in proteoglycans in cancer, regulation of actin cytoskeleton, and tight junction (Figure 3(C) and (D)).
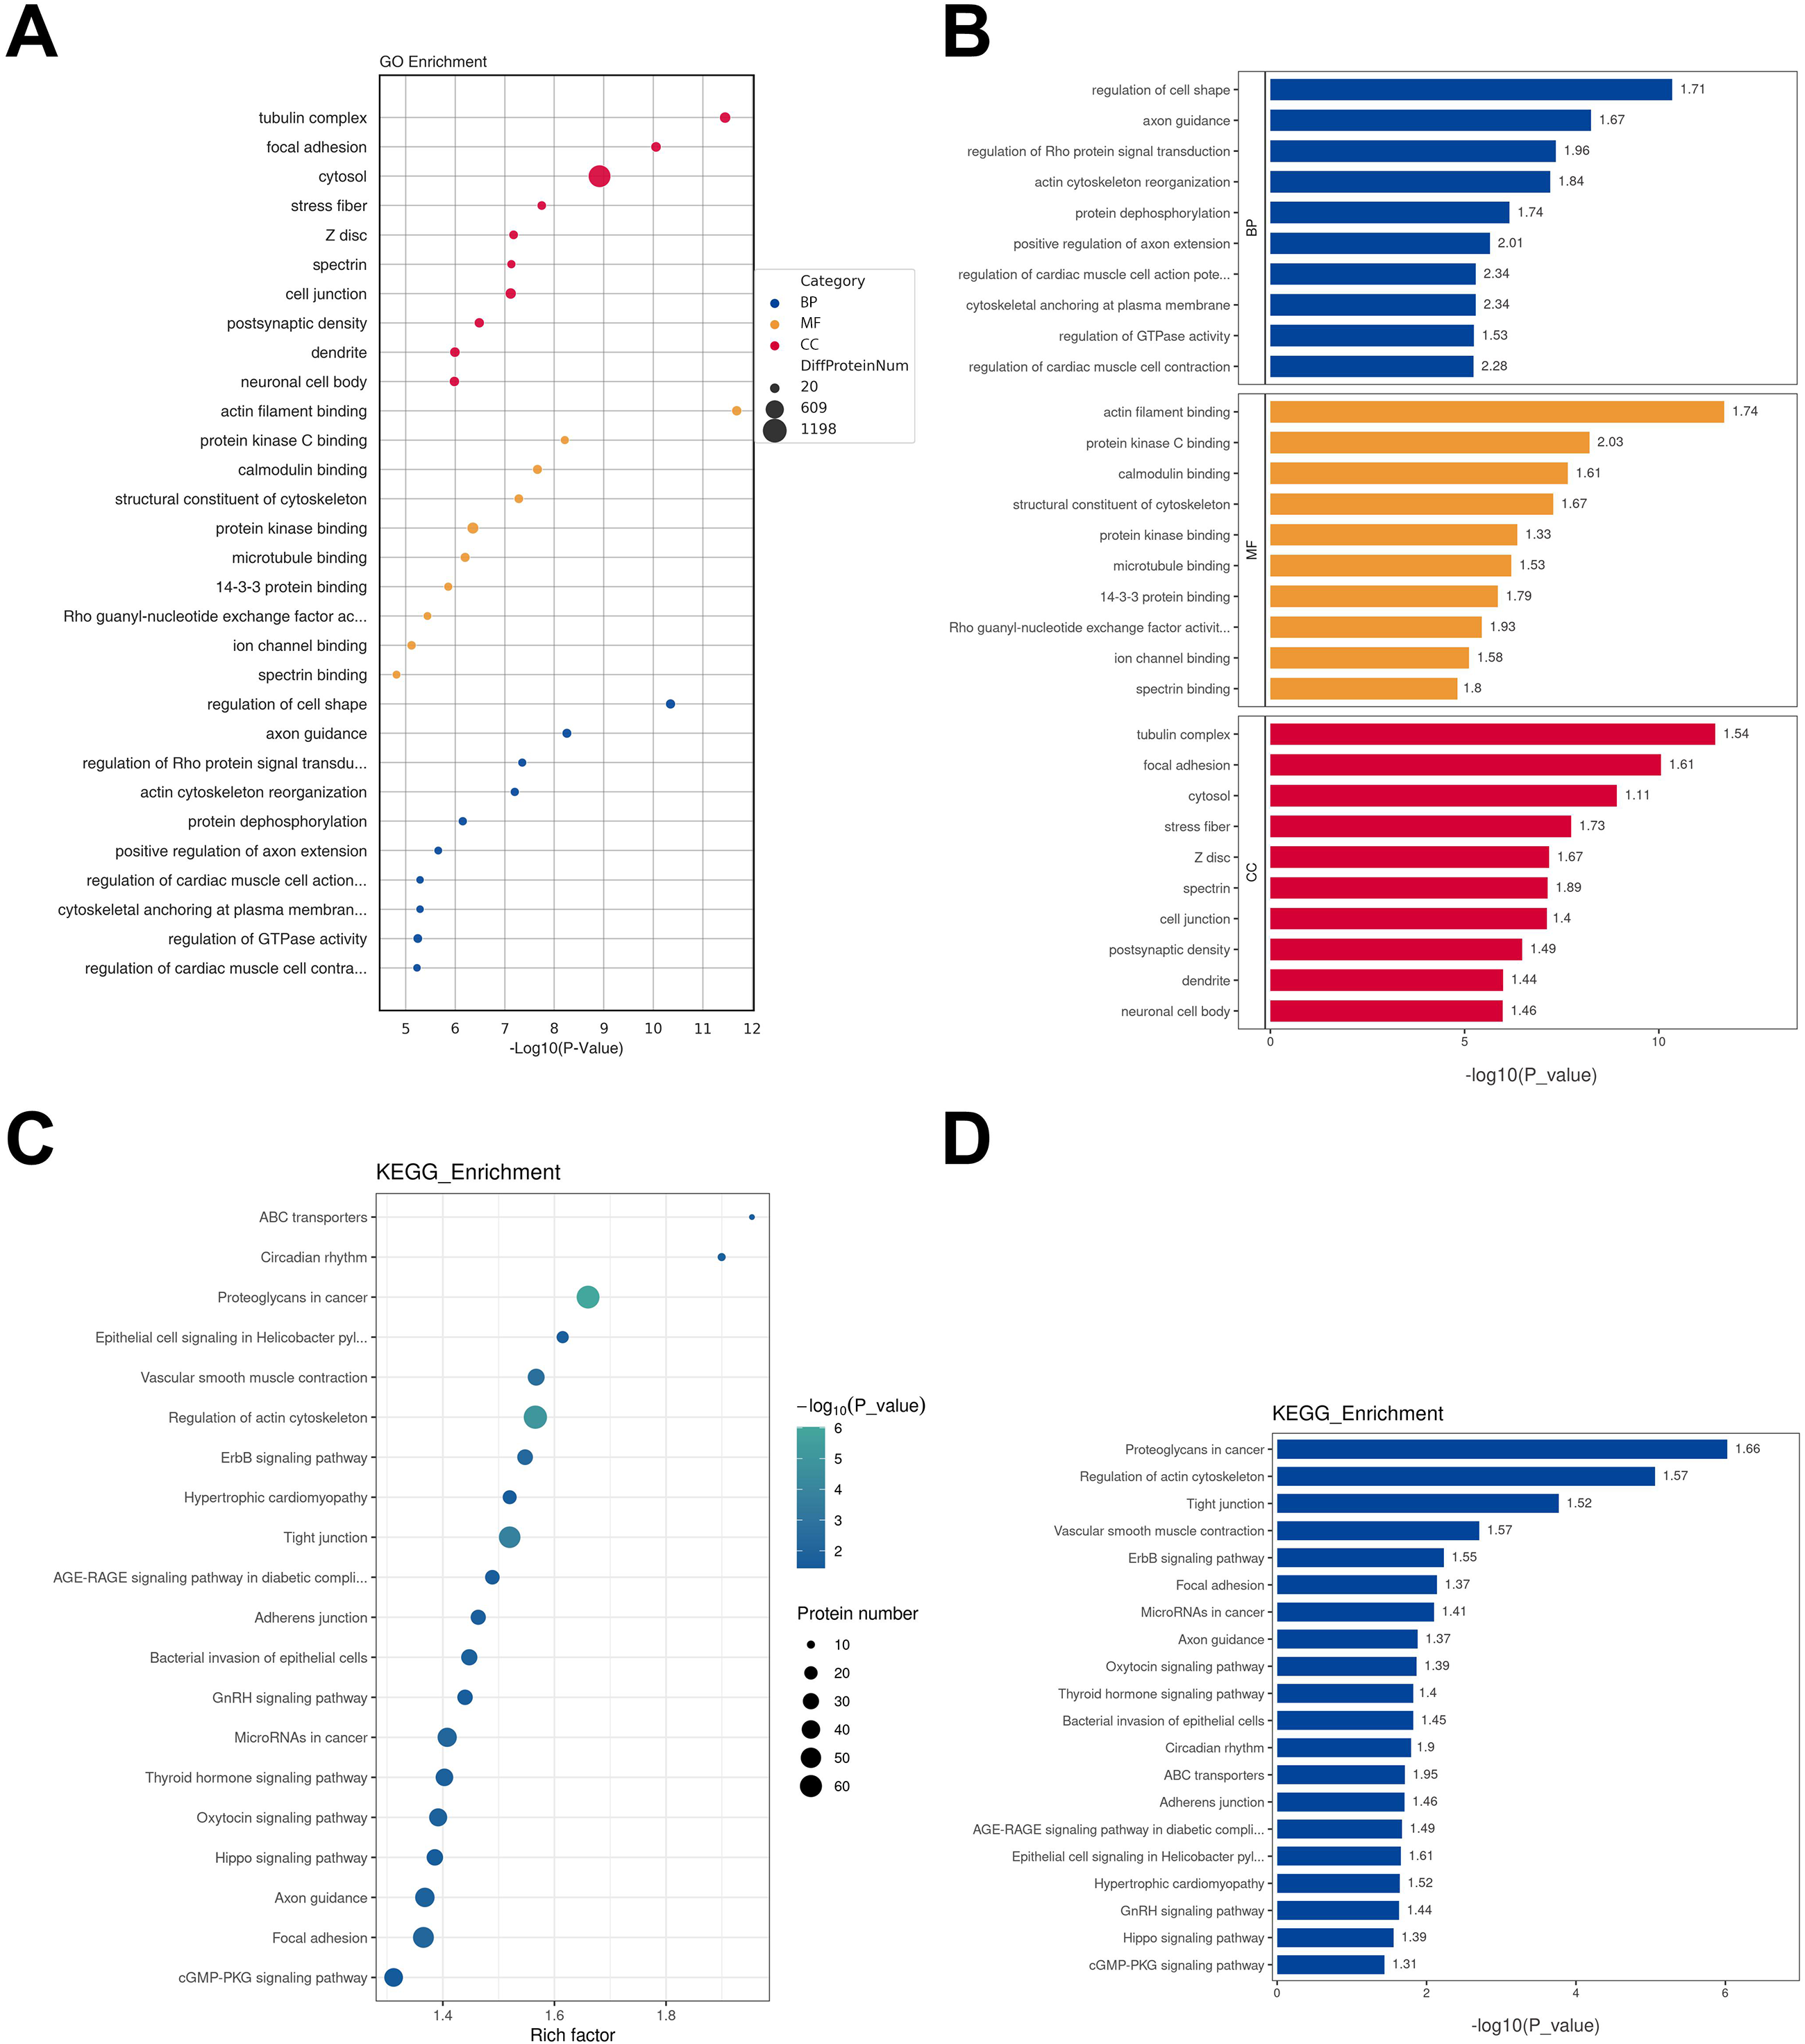
Gene ontology (GO) and Kyoto encyclopedia of genes and genome (KEGG) enrichment analysis of DEPPs. (A) GO functional analysis bubble plot. (B) The bar graph of GO functional analysis. Top 10 GO enrichment terms in biological process (BP), molecular function (MF), and cellular component (CC) categories of the DEPPs, respectively. BP: biological process; MF: molecular function; CC: cellular component. (C) The bubble plot displays the results of the KEGG pathway analysis. (D) KEGG pathway analysis bar chart. The first 20 KEGG enrichment pathways of DEPPs.
Analysis of DEPPs’ subcellular location and transcription factors phosphorylation changes
To elucidate the functional mode of DEPPs, the WoLF PSORT software was employed to predict their subcellular localization of DEPPs. The results demonstrated that these DEPPs were mainly located in the nucleus, plasma membrane, and cytosol (Figure 4(A)). Additionally, Figure 4(B) displayed the top 10 differentially expressed transcription factor families and the number of downstream-regulated target genes.

Analysis of DEPPs’ subcellular location and transcription factors phosphorylation changes. (A) The distribution of DEPPs’ subcellular location. (B) Statistics on the top 10 differentially expressed transcription factor families.
Identification of core proteins
To further evaluate the core proteins that play a critical role in the occurrence of HSCR, the interaction network of DEPPs was constructed using the STRING tool, followed by the AnyChart analysis. The results demonstrated that the SRC protein occupied a core position, suggesting that SRC might be a crucial regulatory protein in the development of HSCR (Figure 5).
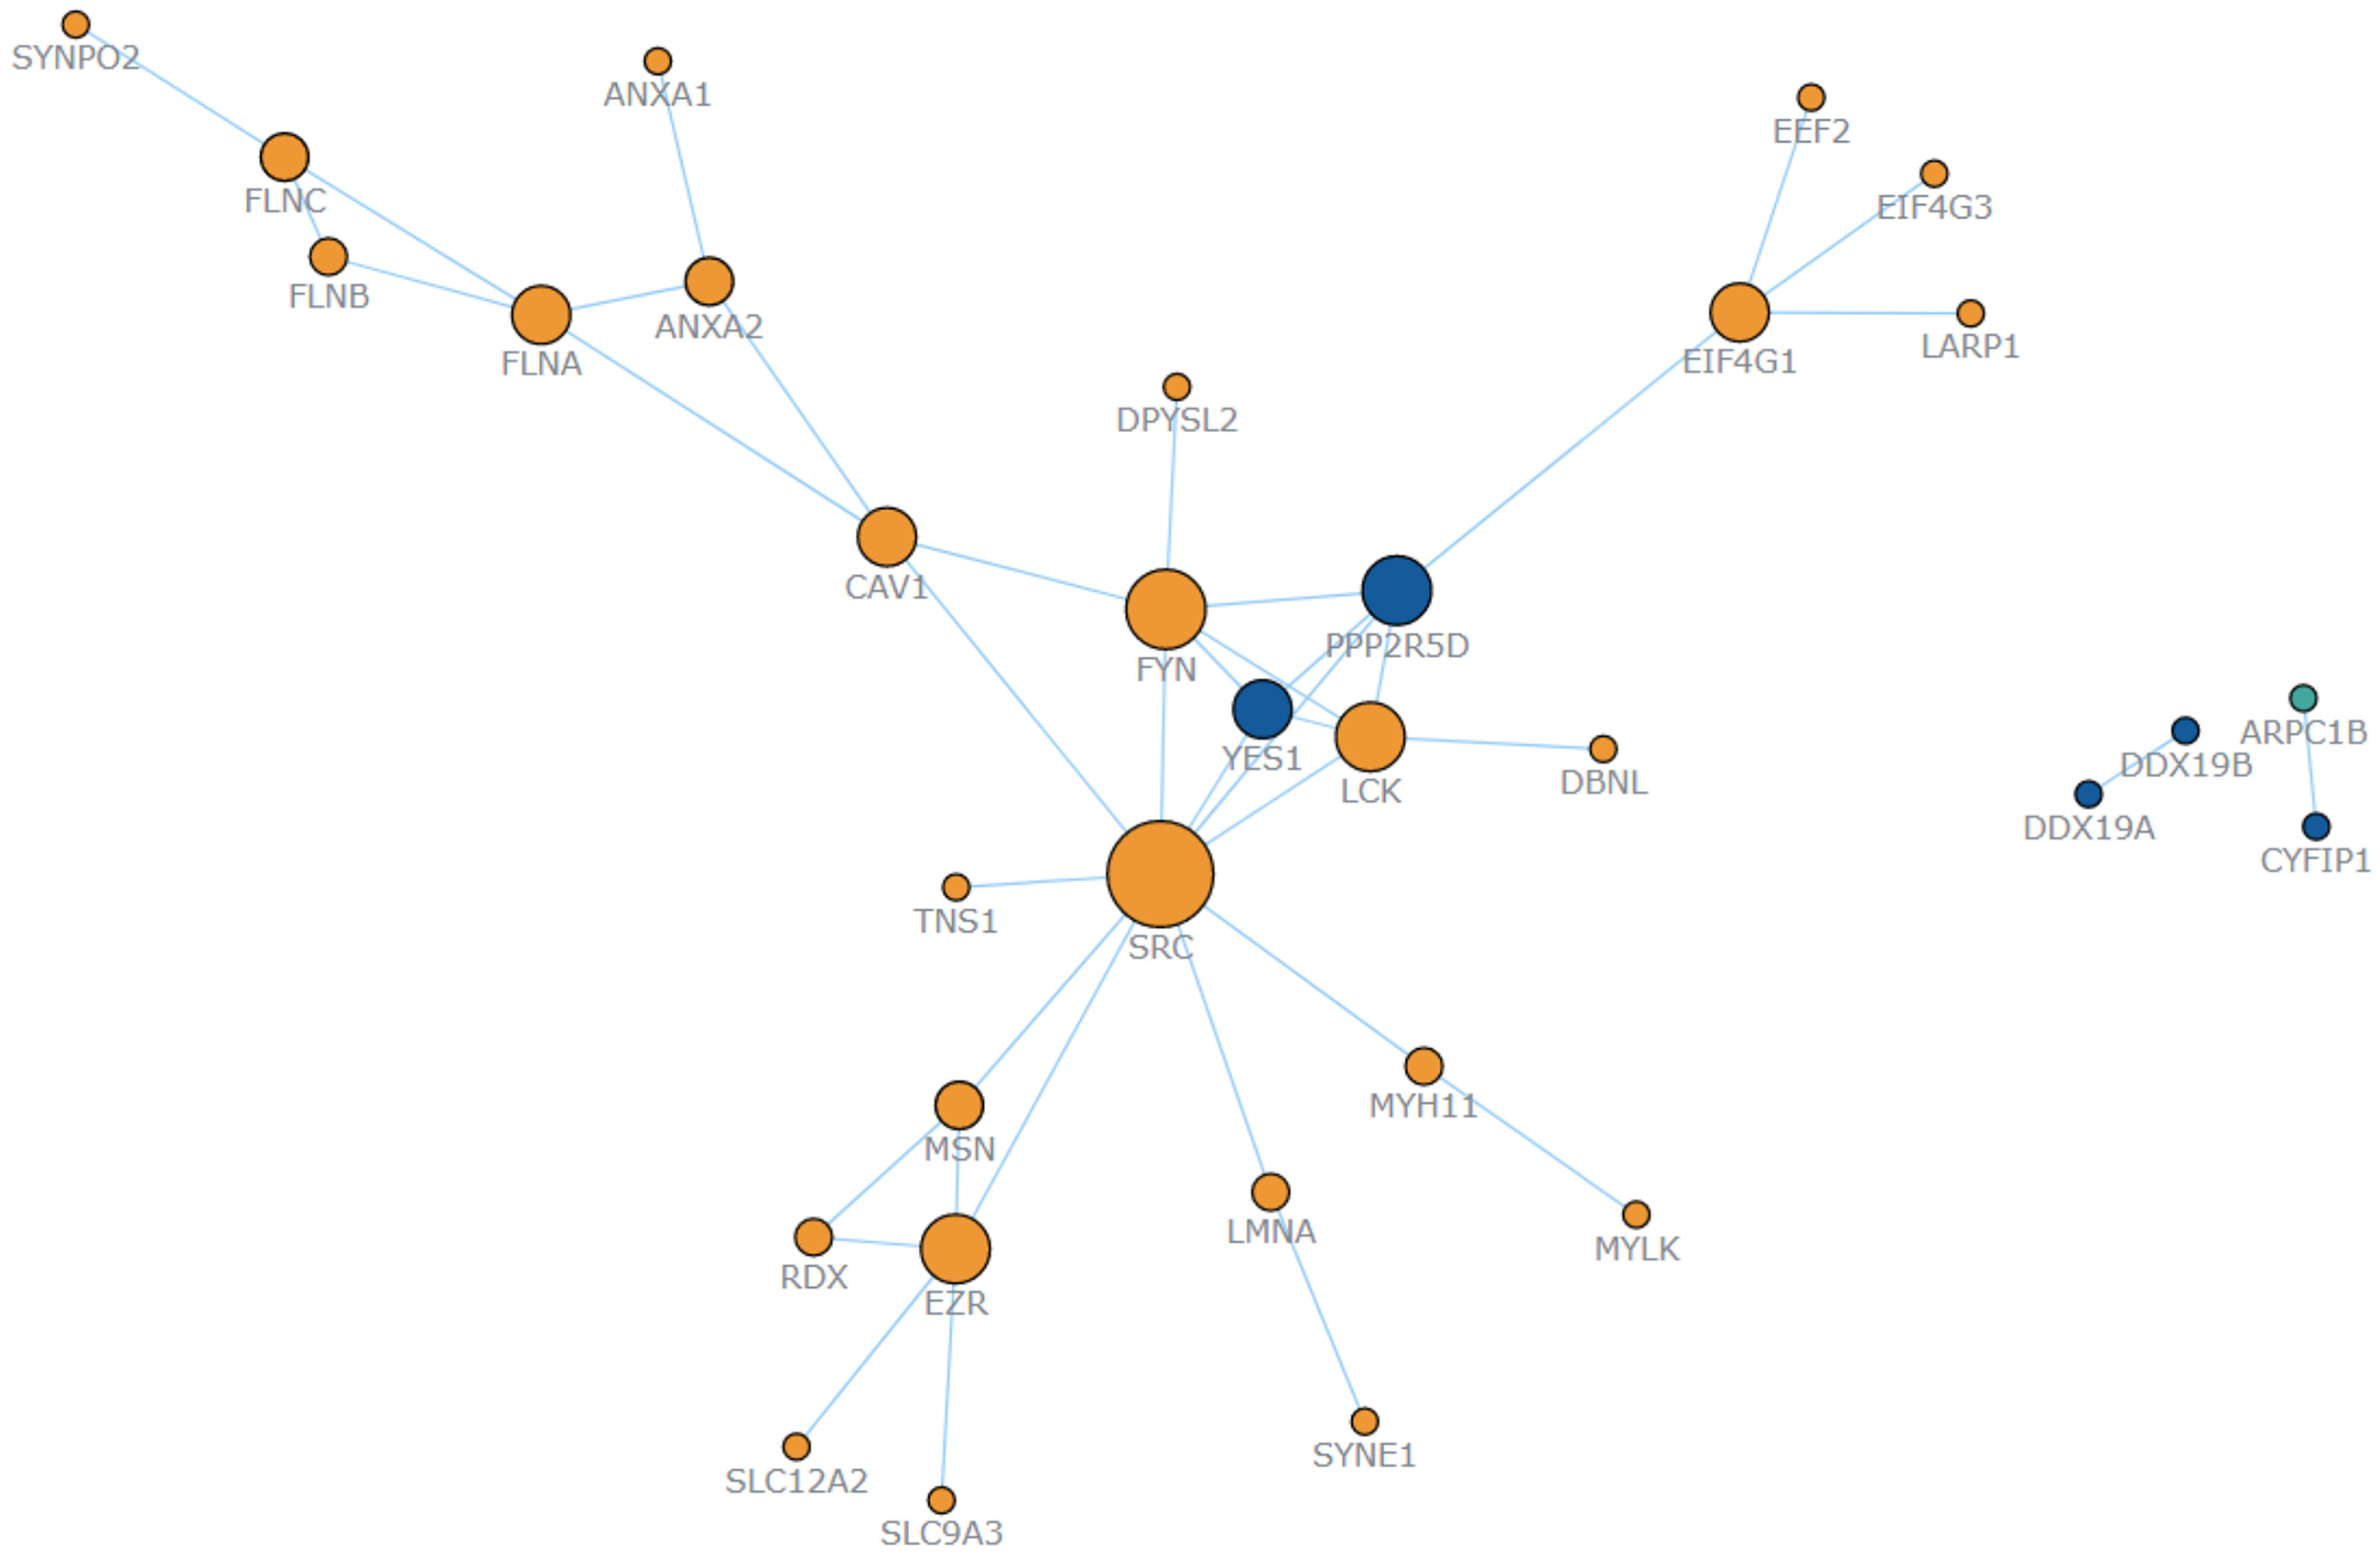
Interaction network of DEPPs shows the interaction of DEPPs. SRC occupies a central position, suggesting that SRC may be a key regulatory gene.
Phosphorylated upstream kinases correlation analysis
Next, we mapped our identified differential phosphorylation sites to the SIGNOR database to obtain upstream kinases based on phosphorylation site. This revealed 20 kinases, such as GSK3B, CDK5, MAPK1, PRKACA, and CDK1 with the highest ability to modify DEPPs (Figure 6(A)). Subsequently, to better understand the relationship between upstream kinases and substrates, a chord diagram was generated (Figure 6(B)). Finally, following the KSEA, SIGNOR, and PhosphoSitePlus database analysis, SRC with the highest activity was identified, further indicating that SRC might act as a crucial regulatory protein in HSCR progression (Figure 6(C)). The 7 DEPPs modified by SRC were provided in Supplemental Table 2.
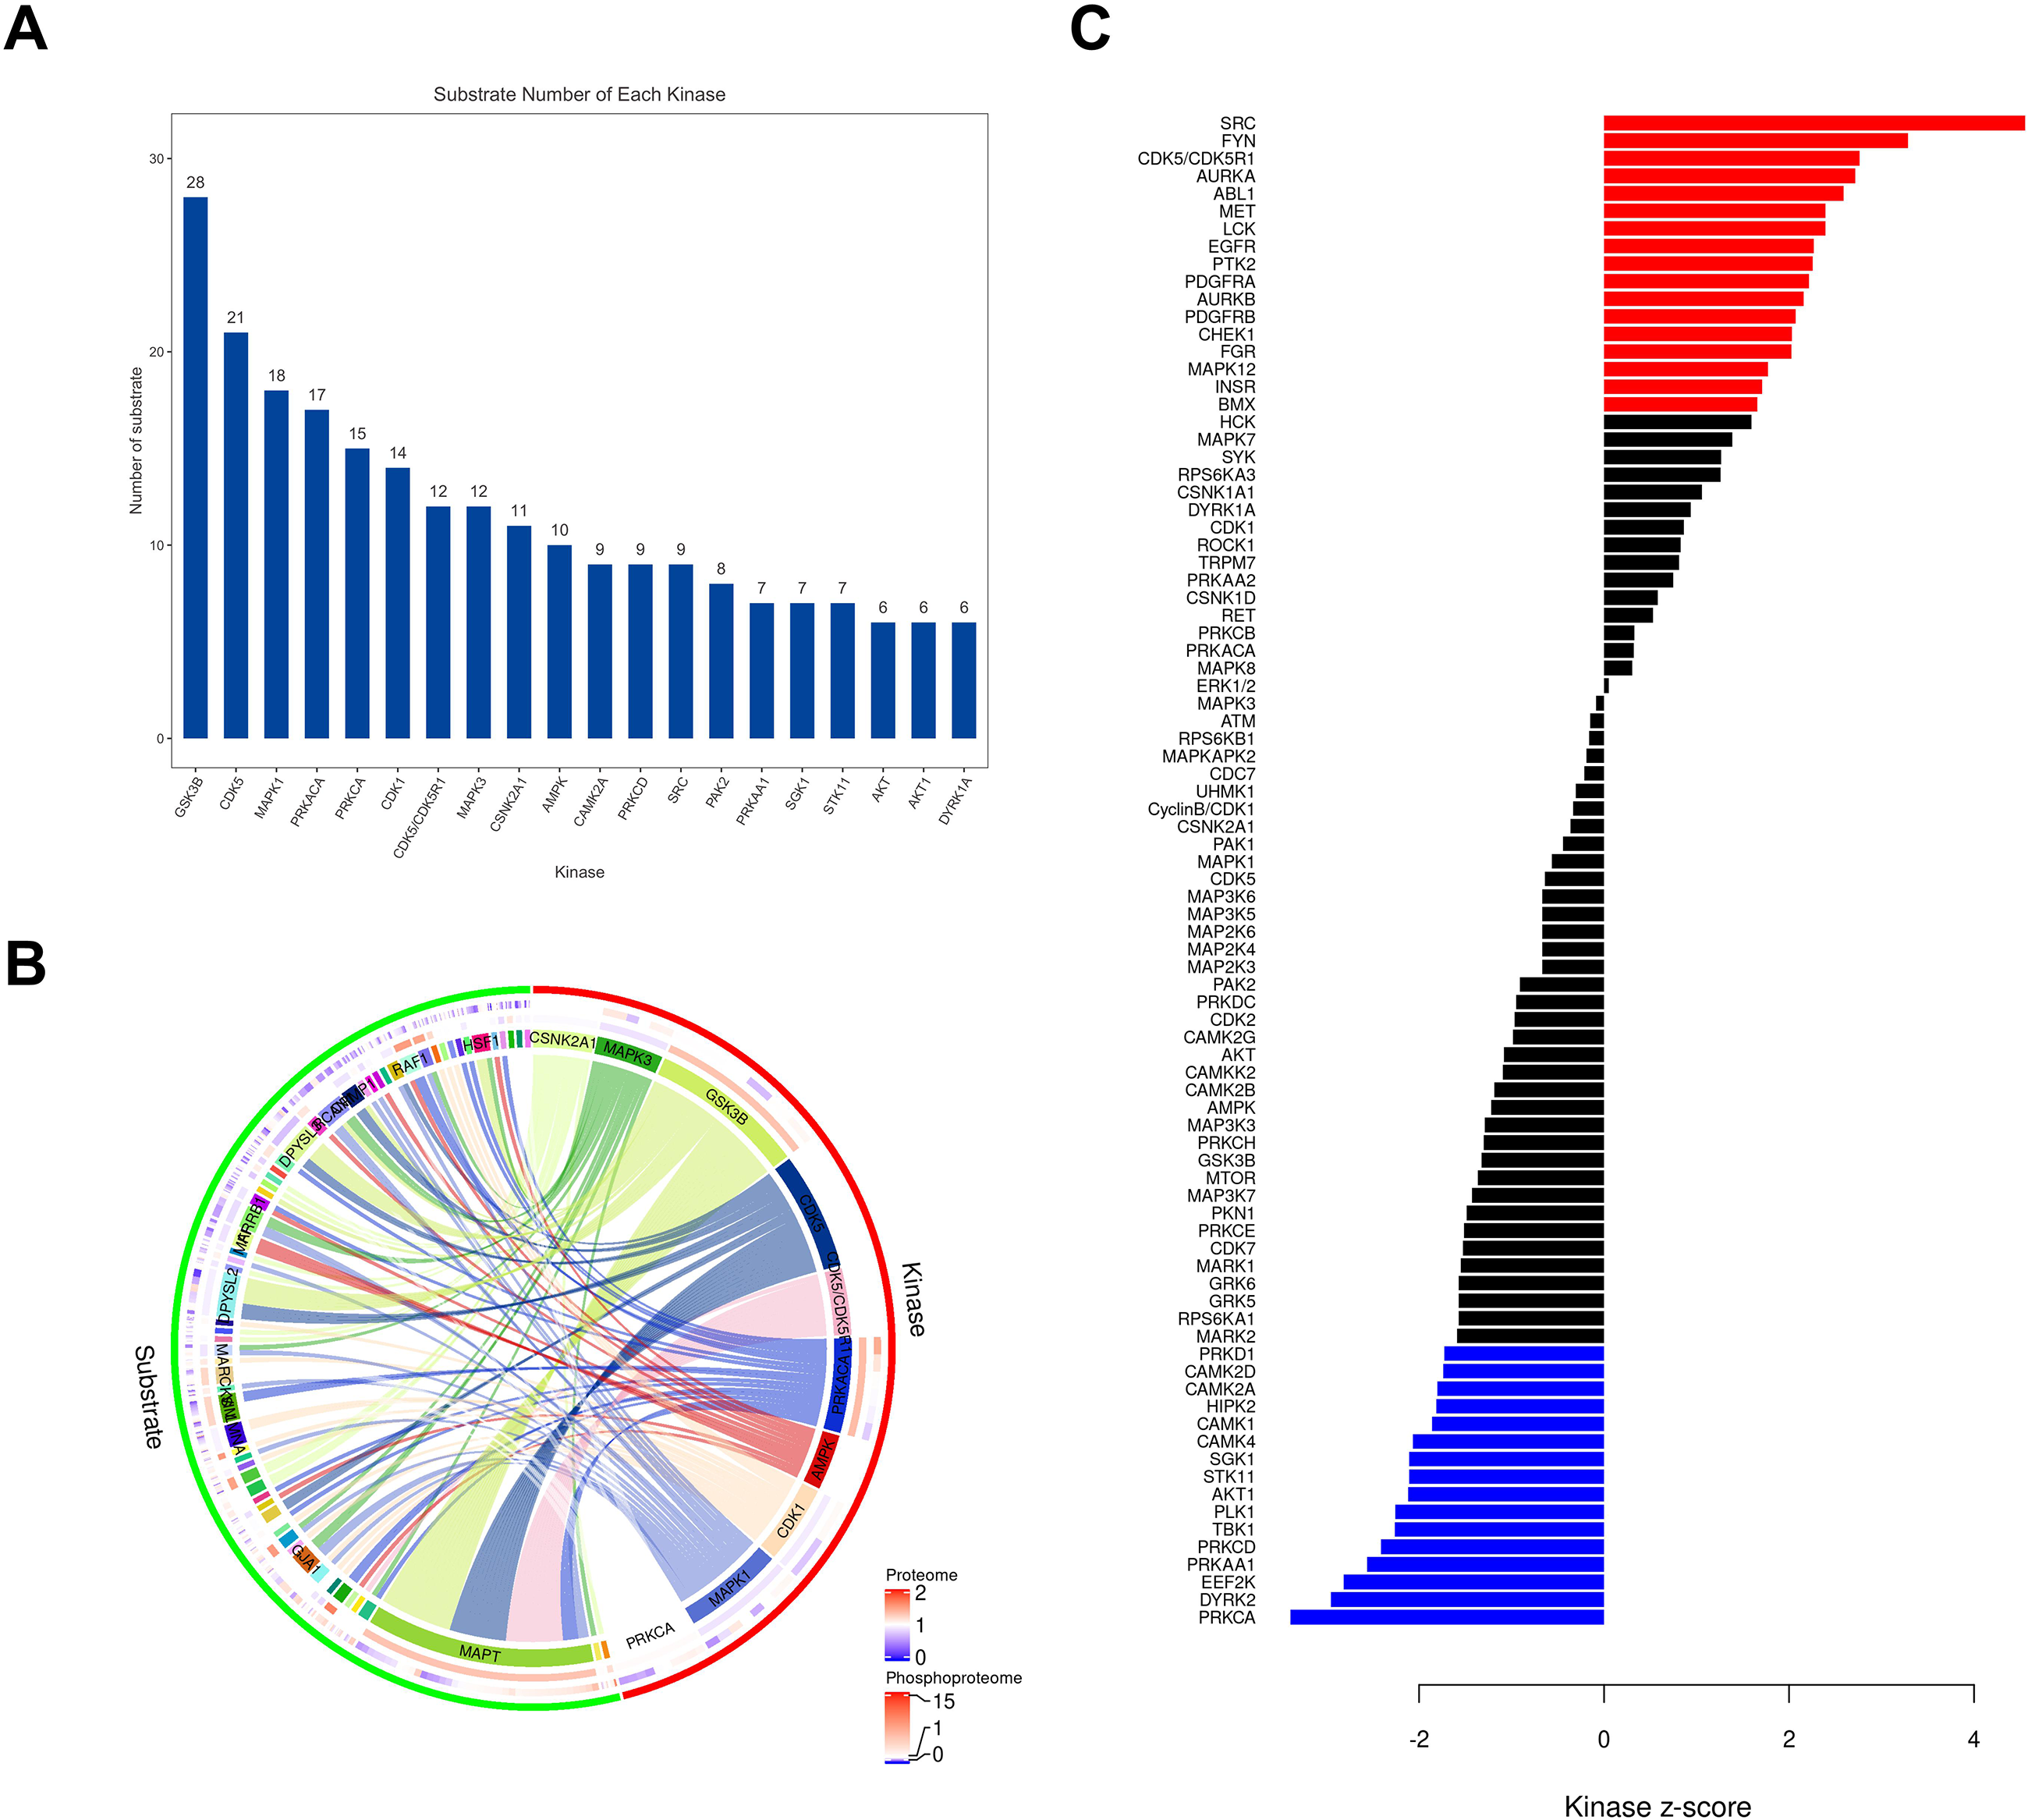
Phosphorylated upstream kinase correlation analysis. (A) The bar graph of kinase-substrate. (B) The chord diagram of kinase-substrate. (C) The results of kinase activity analysis. The y-axis listed the names of the kinases. The x-axis indicates the corresponding Z-score values for each kinase. Red bars represent kinases with a Z-score ≥ 0 and a p-value ≤ 0.05, indicating a statistically significant increase in kinase activity. Blue bars represent kinases with a Z-score ≤ 0 and a p-value ≤ 0.05, indicating a statistically significant decrease in kinase activity. Black bars indicate kinases where the change in activity is not statistically significant.
SRC, phosphorylated CAV1 and FLNA are activated in the HSCR model
According to the literature review, SRC kinase is a common proto-oncogene as a phosphorylated kinase, CAV1 protein can be phosphorylated by SRC regulation, and FLNA is the downstream regulatory target of CAV1.29,30 Therefore, we chose SRC, CAV1, and FLNA as the subsequent research objects. To further unravel the potential mechanism of SRC in HSCR, we developed HSCR rat models. The rats exhibited significant weight gain over time both in the Sham and HSCR groups. However, the weight of rats in the HSCR group was significantly lower than that in the Sham group (Figure 7(A)). Compared to the Sham group, the HSCR group displayed a marked increase in both the colon cross-sectional area and colon weight (Figure 7(B) to (D)). The normal nerve plexus in the colon wall, abundant ganglion cells in normal quantity, and the colonic mucosa with regular shape were observed in the Sham group. In contrast, in the HSCR group, ganglion cells within the intermuscular and submucosal nerve plexus were with small shape and scarce quantity, as well as abscess and enlargement of colonic mucosal recess were found (the black arrow represents the mucosal layer) (Figure 7(E)). We detected the expression of the neuronal marker PGP9.5, which demonstrated a notable decrease in expression in the HSCR group compared to the Sham group (Figure 7(F)). Protein expression levels of SRC, pCAV1, CAV1, and FLNA were examined, revealing upregulation of SRC, pCAV1, and FLNA in the HSCR group (Figure 7(G)). Collectively, these findings indicated that SRC, phosphorylated CAV1 and FLNA were activated in the HSCR model.

SRC, phosphorylated CAV1, and FLNA are activated in the HSCR model. (A) The weight of rats in the Sham and HSCR groups was monitored, N = 6. (B) The colon tissues of rats were photographed. (C) The colon cross-sectional area of rats, N = 6. (D) The colon weight of rats, N = 6. (E) Hematoxylin and eosin (H&E) staining of tissue sections. The black arrows indicated the myenteric plexus (magnification: 200×, scale: 50 μm), (magnification: 400×, scale: 20 μm). (F) The expression of neuronal marker PGP9.5 was detected by Western blot. Each experiment was repeated three times. (G) Expression of SRC, pCAV1, CAV1, and FLNA were detected by Western blot. Each experiment was repeated three times. All data represent mean ± SD. Error bars indicate SD. Comparisons between two groups were assessed by Student’s t-test: **P < 0.01 versus Sham.
SRC positively regulates the CAV1/FLNA expression in the HSCR model
To further verify the correlation between SRC and CAV1/FLNA, we utilized PP2, a specific inhibitor of SRC. It was observed that PP2 treatment led to a reduction in both the colon cross-sectional area and colon weight of rats, compared to the HSCR group (Figure 8(A) to (C)). Notably, compared to the HSCR group, the expression of PGP9.5 was considerably reduced in the HSCR + PP2 group (Figure 8(D)). An increasing number of nerve cells in the mucosal layer of the colon and slightly enlarged crypt were found in the HSCR + PP2 group (Figure 8(E)). The AchE level was downregulated in the HSCR group, but elevated after PP2 intervention (Figure 8(F)). In addition, PP2 treatment also reduced SRC, pCAV1, and FLNA levels when compared to the HSCR group (Figure 8(G)), suggesting SRC may be positively involved in the regulation of CAV1/FLNA molecules in HSCR.

SRC positively regulates the CAV1/FLNA expression in the HSCR model. (A) The colon tissues of rats in each group were photographed. (B) The colon cross-sectional area of rats in each group was measured, N = 6. (C) Statistical data of colon weight in each group, N = 6. (D) The expression of neuronal marker PGP9.5 was detected by Western blot. Each experiment was repeated three times. (E) H&E staining was performed to detect histopathological changes. The black arrows indicated the myenteric plexus (magnification: 200×, scale: 50 μm), (magnification: 400×, scale: 20 μm). (F) The levels of acetylcholinesterase (AchE) were detected using Enzyme-linked immunosorbent assay (ELISA), N = 6. (G) Protein levels of SRC, pCAV1, CAV1, and FLNA were verified by western blot. Each experiment was repeated three times. All data represent mean ± SD. Error bars indicate SD. Statistical significance was analyzed by one-way ANOVA with Tukey’s post-hoc test: **P < 0.01 versus Sham, ## P < 0.01 versus HSCR.
Discussion
HSCR, a complex genetic neurocristopathy, is characterized by impaired migration, proliferation, and differentiation of the enteric nervous system progenitors within the gastrointestinal tract.31,32 Further investigation into the etiology and pathogenesis of HSCR may greatly help improve the progression of HSCR. In this research, SRC as the key protein, along with its substrates, were discovered through the construction of an interaction network and phosphorylated upstream kinases correlation analysis. Additionally, SRC protein kinase activity might positively modulate CAV1/FLNA expression to attenuate the severity of HSCR.
Herein, a total of 5725 DEPPs were extracted combining comprehensive bioinformatics methods following proteomics and phosphoproteomics. As suggested by our GO and KEGG analysis, the screened DEPPs were enriched in focal adhesion, and tubulin complex pathways, and participated in the regulation of the actin cytoskeleton. Proteomic studies on patients with HSCR have identified 16 proteins with differential expression in ganglionic segments, involving functions related to cytoskeletal proteins and regulatory proteins. 33 Bioinformatics analysis based on biopsies taken from the aganglionic and ganglionic colon segments of patients with HSCR identified 97 DEPs, with cellular retinoic acid binding protein 1 highlighted as a potential marker for the disease. 34 Through proteomic and sequencing analysis of the normal and aganglionic post-colon in patients with HSCR, 15 proteins have been identified, representing categories such as biomarkers of intestinal ganglia, extracellular matrix proteins, LIM domain proteins, serum proteins, and other pleiotropic proteins. 35 A quantitative proteomic analysis of colonic tissues from 21 patients has identified a total of 5341 proteins in human colonic tissue, involving pathways such as ribosome, endocytosis, spliceosome, oxidative phosphorylation, and cell adhesion. 36 The downregulation of focal adhesion proteins has been shown to inhibit the migration of enteric neural crest cells stimulated by fibronectin. 37 Decreased expression of β-tubulin throughout the intestinal tract, including the proximal ganglionic segments, may potentially hinder the transmission of enteric neurons in HSCR. 38 One of the possible mechanisms underlying the failure of cell polarization and migration is attributed to cytoskeleton and related protein damage, which may be interrelated to the pathogenesis of HSCR. 39 Thus, we hypothesized that the DEPPs involved in these processes might be correlated with the pathogenesis of HSCR, providing a theoretical reference for mechanism studies of HSCR.
The activity of PTK2 (FAK) is modulated by SRC, thereby controlling the migrated capacity of neurons. 40 Suppressing SRC/EGFR-targeting STAT3 improves the overall survival of mice with pancreatic ductal adenocarcinoma through remodeling the tumor stroma. 41 The phosphorylation of ANXA2 by SRC kinase is essential for invasion and metastasis in multidrug-resistant breast cancer cells. 42 In chronic myeloid leukemia cells, the cytoplasmic retention of pSTAT5A, mediated by Src-family kinases, leads to reduced expression of the target gene and colony formation. 43 The SRC kinase inhibitors can reduce GAB1 phosphorylation, which correlates with an increase in apoptotic cell death and may be crucial for cardioprotection against ischemia/reperfusion oxidative injury. 44 Consistently, our findings demonstrated that SRC as the most active kinase, with CAV1, PTK2, EGFR, STAT5A, ANXA2, and GAB1 proteins were modified by SRC.
Of importance, SRC kinase acts as a major upstream regulator of cellular connections and the cytoskeleton. SRC kinase inhibitor treatment can reverse the effects of cell adhesion structure modification, de-adhesion, and increased apoptosis induced by oxidative stress in a heart ischemia-reperfusion injury model. 45 In vivo studies using SRC knockout mouse model and in vitro cellular experiments have validated SRC's regulatory role in both osteoclasts and osteoblasts, indicating SRC tyrosine kinase is a prospective therapeutic target for bone diseases. 46 The inactivation of SRC reduces the phosphorylation of several signaling molecules, like Smad3, EGFR, and STAT3, which are linked to renal fibrosis induced by unilateral ureteral obstruction. 47 In experimental diabetic retinopathy, erythropoietin preserves the inner blood-retinal barrier by preventing microglia phagocytosis through the SRC/AKT/cofilin pathway. 48 Inhibition of SRC alleviates degeneration of neuromuscular tissue in spinal and bulbar muscular atrophy mediated by polyglutamine. 49 In this study, SRC expression was upregulated in the HSCR group, and treatment with the SRC-specific inhibitor PP2 resulted in a decrease in the colon cross-sectional area, and colon weight. PP2 significantly improved the pathological injury in the colons of HSCR mice, indicating a therapeutic effect on HSCR.
We found that the phosphorylated forms of CAV1 and FLNA were elevated in the HSCR rat model and CAV1 phosphorylation may be modified by SRC kinase. Research indicates that, in HSCR-associated enterocolitis, endothelial cells with mutated Oncostatin-M receptors exhibit dysregulation of the endocytic pathway, as suggested by the downregulation of CAV1. 50 SRC inactivation has been shown to restore the normal cell polarity and wound healing defects observed in CAV1-deficient fibroblast cells. 51 SRC directly interacts with CAV1, and inhibiting SRC activity can reduce CAV1-mediated Ca2+ influx, thereby attenuating the restoration of intestinal epithelial function. 52 Additionally, Fyn-kinase and CAV1 participate in the alveolar barrier function impairment caused by TGF-β/bleomycin, contributing to the early stages of pulmonary fibrosis. 53 Elevated expression of FLNA has been found in patients with Moyamoya disease, where it is associated with its pathogenesis and pathology of cerebrovascular intimal hyperplasia. 54 Similarly, FLNA expression is upregulated in liver tissues from cirrhosis patients, as well as in mice models of non-alcoholic fatty liver disease. 55 Ribosomal S6 kinase has been shown to regulate the activities of FLNA through phosphorylation, thereby modulating the actin cytoskeleton. 56 Herein, the expression levels of pCAV1 and FLNA were upregulated in the HSCR model, and inhibiting SRC activity could reduce CAV1/FLNA molecules’ expression.
Despite these promising findings, several limitations must be acknowledged. Ideally, it would be valuable to compare HSCR patients to healthy controls or to use transgenic animal models of HSCR compared to their wild-type counterparts. Unfortunately, ethical and practical constraints prevent us from obtaining colonic biopsies from healthy children, who would be the ideal comparison group. This study utilized a sample size of N = 6 for both sequencing and animal experiments. While this sample size was determined based on ethical considerations and resource availability, we acknowledge that the absence of a formal power analysis may reduce the statistical power to detect subtle biological effects. Future studies with larger cohorts are warranted to validate these findings. Additionally, due to the limited duration of our experimental period, we are currently unable to perform experiments involving transgenic animal models. Future research involving larger sample sizes, including healthy controls, and utilizing transgenic animal models will be crucial to validate and expand upon our observations.
Conclusion
To summarize, SRC with the highest kinase activity, along with its six substrates, was discovered by combining comprehensive bioinformatics analysis after proteomics and phosphoproteomics. Additionally, we elucidated that inhibition of SRC protein kinase activity might attenuate the severity of HSCR via impairing CAV1/FLNA expression. Collectively, the findings of this study contribute to a better understanding of the pathogenesis of HSCR and highlight the preliminary potential of SRC kinase for the treatment of HSCR.
Supplemental Material
sj-docx-1-sci-10.1177_00368504251336287 - Supplemental material for Suppression of SRC protein kinase activity alleviates the severity of aganglionosis by impairing CAV1/FLNA expression
Supplemental material, sj-docx-1-sci-10.1177_00368504251336287 for Suppression of SRC protein kinase activity alleviates the severity of aganglionosis by impairing CAV1/FLNA expression by Xiaogang Xu, Yanqing Liu, Menglong Lan, Fei Liu, Huimin Xia and Jixiao Zeng in Science Progress
Supplemental Material
sj-docx-2-sci-10.1177_00368504251336287 - Supplemental material for Suppression of SRC protein kinase activity alleviates the severity of aganglionosis by impairing CAV1/FLNA expression
Supplemental material, sj-docx-2-sci-10.1177_00368504251336287 for Suppression of SRC protein kinase activity alleviates the severity of aganglionosis by impairing CAV1/FLNA expression by Xiaogang Xu, Yanqing Liu, Menglong Lan, Fei Liu, Huimin Xia and Jixiao Zeng in Science Progress
Supplemental Material
sj-docx-3-sci-10.1177_00368504251336287 - Supplemental material for Suppression of SRC protein kinase activity alleviates the severity of aganglionosis by impairing CAV1/FLNA expression
Supplemental material, sj-docx-3-sci-10.1177_00368504251336287 for Suppression of SRC protein kinase activity alleviates the severity of aganglionosis by impairing CAV1/FLNA expression by Xiaogang Xu, Yanqing Liu, Menglong Lan, Fei Liu, Huimin Xia and Jixiao Zeng in Science Progress
Supplemental Material
sj-zip-4-sci-10.1177_00368504251336287 - Supplemental material for Suppression of SRC protein kinase activity alleviates the severity of aganglionosis by impairing CAV1/FLNA expression
Supplemental material, sj-zip-4-sci-10.1177_00368504251336287 for Suppression of SRC protein kinase activity alleviates the severity of aganglionosis by impairing CAV1/FLNA expression by Xiaogang Xu, Yanqing Liu, Menglong Lan, Fei Liu, Huimin Xia and Jixiao Zeng in Science Progress
Supplemental Material
sj-pdf-5-sci-10.1177_00368504251336287 - Supplemental material for Suppression of SRC protein kinase activity alleviates the severity of aganglionosis by impairing CAV1/FLNA expression
Supplemental material, sj-pdf-5-sci-10.1177_00368504251336287 for Suppression of SRC protein kinase activity alleviates the severity of aganglionosis by impairing CAV1/FLNA expression by Xiaogang Xu, Yanqing Liu, Menglong Lan, Fei Liu, Huimin Xia and Jixiao Zeng in Science Progress
Supplemental Material
sj-docx-6-sci-10.1177_00368504251336287 - Supplemental material for Suppression of SRC protein kinase activity alleviates the severity of aganglionosis by impairing CAV1/FLNA expression
Supplemental material, sj-docx-6-sci-10.1177_00368504251336287 for Suppression of SRC protein kinase activity alleviates the severity of aganglionosis by impairing CAV1/FLNA expression by Xiaogang Xu, Yanqing Liu, Menglong Lan, Fei Liu, Huimin Xia and Jixiao Zeng in Science Progress
Footnotes
Ethical considerations
The animal experiments conformed to the Guide for the Care and Use of Laboratory Animals. The authors confirm that the animal experiments in this study were approved by the Guangzhou Medical University Experimental Animal Ethics Committee (China, Guangzhou). The approval number is G2023-403, and the date of approval is 28 February 2023. The manuscript reporting adheres to the ARRIVE guidelines. This study adhered to the principles of the Declaration of Helsinki (1975, revised 2013). Informed consent forms were provided to and signed by the legal guardians of the infant participants. The authors confirm that the research in this study was approved by the Ethics Committee of Guangzhou Women and Children Medical Center (Guangzhou, China). The approval number is 2017102706, and the date of approval is 2 November 2017.
Author Contributions/CRediT
Xiaogang Xu: substantial contributions to conception and design, data acquisition, drafting the article. Yanqing Liu, Menglong Lan and Fei Liu: data acquisition, drafting the article. Jixiao Zeng and Huimin Xia: data acquisition; reviewing the article. All the authors took part in the experiment. All the authors read and approved the manuscript
Funding
The author(s) disclosed receipt of the following financial support for the research, authorship, and/or publication of this article: Xiaogang Xu thanks the supporting of Guangzhou Science and Technology Plan of Municipal University (Institute) Joint Funding (SL2024A03J01490). Jixiao Zeng thanks the supporting of National Natural Science Foundation of China (82170528); Natural Science Foundation of Guangdong Province (2022A1515012254); Guangzhou Science and Technology Plan of Municipal University (Institute) Joint Funding (202201020612); Guangzhou Clinical Characteristic Technology Project (2023C-TS48).
Conflicting interests
The author(s) declared no potential conflicts of interest with respect to the research, authorship, and/or publication of this article.
Data availability
All data in the manuscript is available through the responsible corresponding author.
Supplemental material
Supplemental material for this article is available online.
References
Supplementary Material
Please find the following supplemental material available below.
For Open Access articles published under a Creative Commons License, all supplemental material carries the same license as the article it is associated with.
For non-Open Access articles published, all supplemental material carries a non-exclusive license, and permission requests for re-use of supplemental material or any part of supplemental material shall be sent directly to the copyright owner as specified in the copyright notice associated with the article.