
Abstract
Understanding aerodynamic entrainment, a critical process in wind-blown sand dynamics, remains challenging due to the difficulty of isolating it from other mechanisms, such as impact entrainment. Aerodynamic entrainment initiates the movement of surface particles, influencing large-scale processes like sediment transport and dune formation. Previous studies focused on average aerodynamic shear stress to estimate entrainment, but the role of impulse events, which cause significant shear stress fluctuations, remains under-explored. We used 12 hot-film shear sensors to measure the spatiotemporal distribution of aerodynamic shear stress during wind-blown sand flow development. We identified impulse events exceeding the entrainment threshold and analyzed their intensity, classifying particle movement as rocking, rolling, or saltation. Results indicate that after a 2-m fetch, sediment mass flux stabilizes, with aerodynamic shear stress decreasing to 78% of the entrainment threshold. We identified key trends, including the stabilization of rocking events beyond x = 4.5 m and a significant decrease in saltation frequency, indicating fully developed wind-blown sand flow. Impulse characteristics stabilize at a greater distance (4.5 m) than sediment transport (2 m) because turbulent airflow evolves more slowly. Our findings show that impulse events significantly influence aerodynamic entrainment. These insights enhance understanding of sediment transport dynamics and improve modeling of sand dune movement.
Introduction
Wind-blown sand poses significant risks to human health and causes substantial damage to infrastructure, leading to significant annual economic losses. 1 Understanding the mechanisms of sand drift, which involve the transfer of momentum from airflow to sand particles, is crucial for mitigating these hazards.2,3 This process, known as entrainment, plays a crucial role in initiating and sustaining wind-blown sand flow. 4
Aerodynamic entrainment and impact entrainment are the two main processes that generate airborne particles in wind-blown sand flows.5,6 Aerodynamic entrainment occurs when surface particles are lifted by aerodynamic drag, while impact entrainment results from collisions between airborne particles and surface particles.7–9 Research suggests that aerodynamic entrainment initiates wind-sand flow, while impact entrainment dominates in fully developed air-sand flows.10,11 Recent studies emphasize the importance of accurately determining the aerodynamic entrainment threshold to control global sediment transport and dune formation. Sauermann et al. 12 developed a continuous saltation model that shows how this threshold influences particle movement initiation and the formation and migration of sand dunes. Zhang et al. 13 also showed a non-linear relationship between sand flux and wind shear velocity, where small reductions in the aerodynamic entrainment threshold can cause exponential increases in sand transport. These changes are critical for predicting desert expansion and the development of new dune systems globally. However, the presence of airborne particles makes it difficult to isolate aerodynamic entrainment from other physical processes during direct observation. Consequently, scientists have focused on measuring wall shear stress directly to quantify the aerodynamic drag exerted by wind on surface. 14
Earlier studies have used average aerodynamic shear stress to estimate particle entrainment, but this method is insufficient due to turbulence-induced fluctuations.15,16 Diplas et al. 17 introduced the concept of impulse, which provides a deeper understanding by accounting for “impulse events”—brief but significant fluctuations in aerodynamic shear velocity that exceed the threshold needed to dislodge particles from the bed. This concept aligns better with both simulations and experiments.18,19 Impulse events are essential for driving rocking, rolling, and saltation motions.20–22 Recent research highlights the crucial role of coherent structures in particle entrainment. Experimental studies have shown how these structures influence particle movements like creeping, rocking, and full particle entrainment. 23 The thresholds and movement patterns of rocking, rolling, and saltation have also been studied in both aeolian and fluvial environments. 24
This study aims to investigate the movement of bed particles induced by aerodynamic entrainment. Fluctuations in wall shear stress during the development of wind-blown sand flow were recorded to detect impulse events. The intensity of these impulse events was analyzed, and particle movement patterns were identified based on momentum conservation. The observed movement patterns, including rocking, rolling, and saltation, varied with impulse intensity. The frequency and probability of these particle movements were quantified throughout the development of the sand flow. These findings offer new insights into the relationship between coherent structures and particle entrainment in sand-laden flows.
Materials and methods
Experimental setup
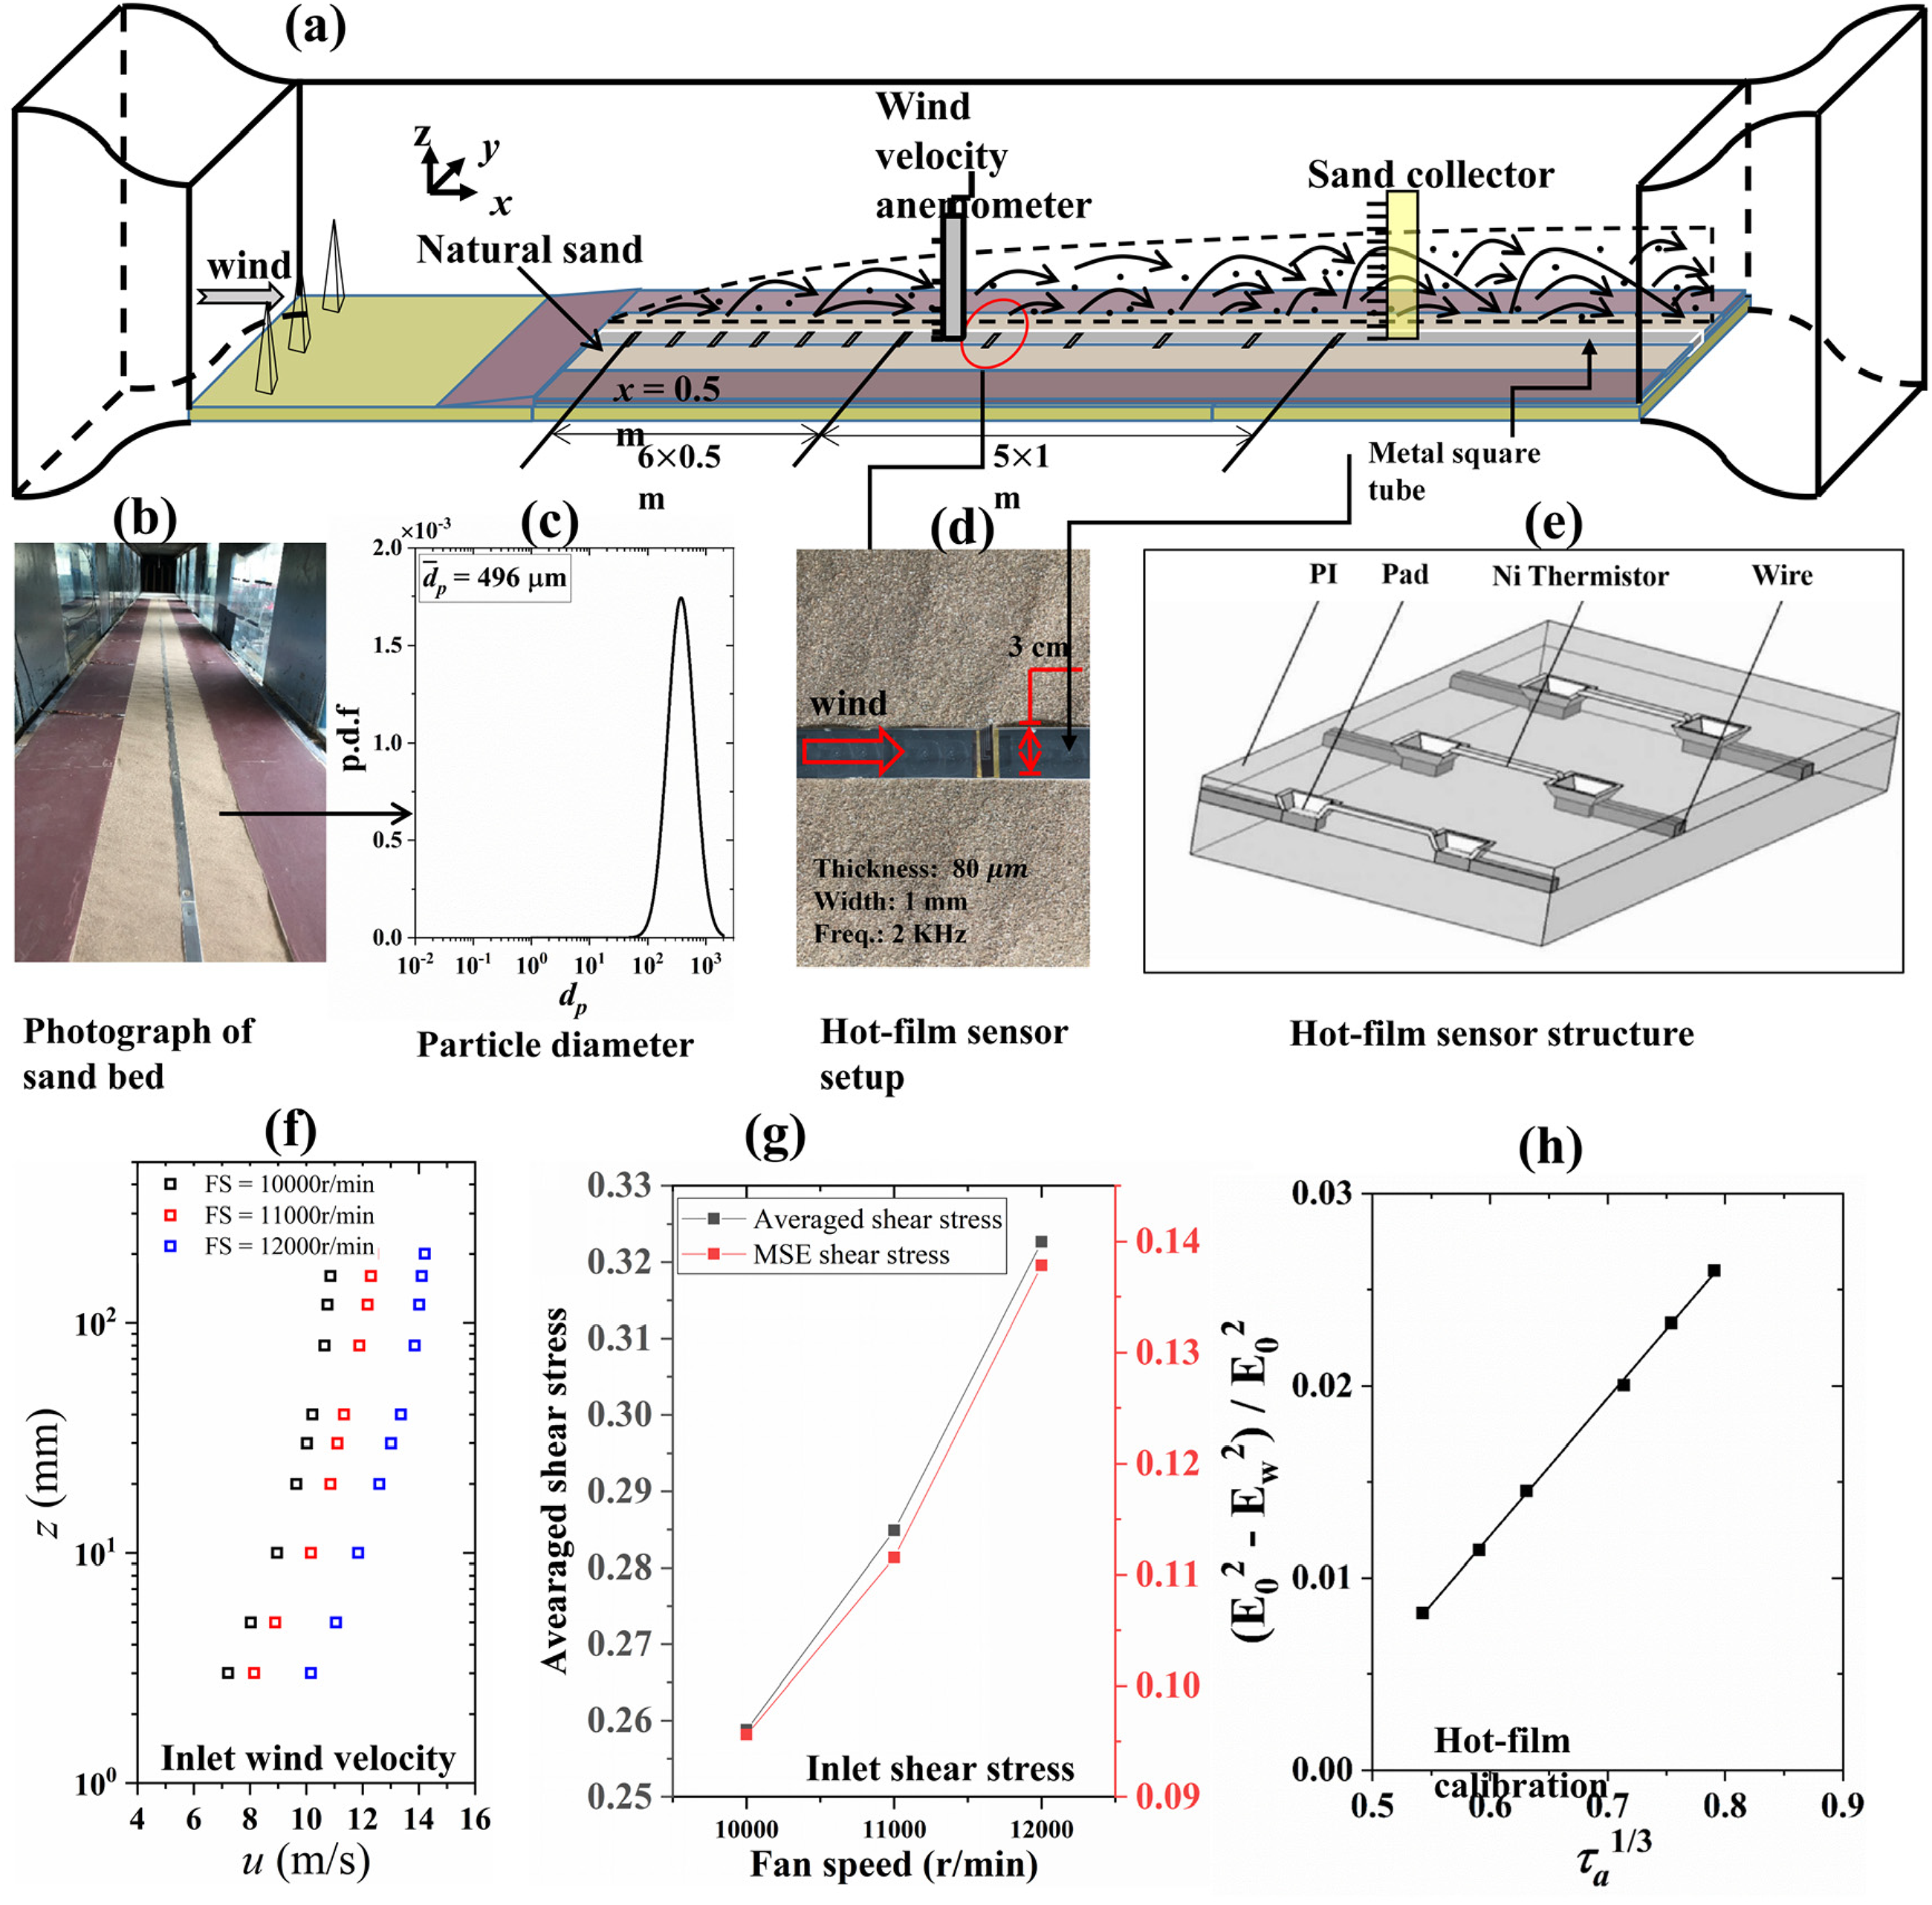
The experimental setup is schematically depicted in Figure 1(a). Wind-blown sand experiments were conducted in the environmental wind tunnel at Lanzhou University, with a working section measuring 22 × 1.45 × 1.3 m³, corresponding to the streamwise (X), spanwise (Y), and vertical (Z) directions. As shown in Figure 1(b), a sand bed of 0.5 m in width and 0.08 m in thickness was placed along the streamwise direction. The sand particles had an average diameter of 496 μm, as illustrated by the size distribution in Figure 1(c).
Experimental setup in the wind tunnel.
A metal square tube was installed along the mid-line of the wind tunnel floor to provide a smooth, stable surface for the hot-film sensors, ensuring that the tube's upper surface was level with the sand bed. The inlet wind profile measured at x = 0 m is presented in Figure 1(f), with the wind speed at 20 cm above the surface designated as the incoming wind speed,
Aerodynamic shear stress in the wind-blown sand was measured using 12 hot-film sensors arranged along the flow direction. Figure 1(d) details the key specifications of the hot-film sensors, including film thickness, hot element length, and sampling frequency. The polyimide substrate's thermal insulation properties improve both sensitivity and thermal response speed. Figure 1(e) shows the components of the flexible hot-film sensors. The polyimide substrate, pads, wires, and thermistors are all flexible thin films with a total thickness of less than 80 μm, minimizing interference with the measured surface. The polyimide substrate's thermal insulation also enhances sensitivity and accelerates thermal response. The system's sampling frequency reaches up to 4 kHz with an accuracy of ±5%. Given that large-scale wall shear stress fluctuations drive aerodynamic entrainment, we set the sampling frequency at 2 kHz, which is sufficient for the required observational accuracy.
Sensor calibration
Before starting the wind-blown sand experiments, we calibrated the hot-film sensors. Wind velocity profiles were measured at six different fan speeds using an anemometer and were fitted to a logarithmic curve:


Data collection
Three inlet wind velocities (uin = 10.9 m/s, 12.3 m/s, and 14.2 m/s) were applied to induce wind-blown sand flow in the boundary layer. Data from all 12 sensors were recorded simultaneously after the hot-film sensor outputs had stabilized. After each recording session, the wind tunnel was turned off, and the sand bed was renewed for subsequent trials.
Wind velocity and sand mass flux profiles were measured carefully to prevent damage to the hot-film sensors. A wind anemometer with ten pitot probes was positioned at heights ranging from 3 to 200 mm above the sand bed. For sand flux measurements, we employed a CAREERI, CAS-designed sand collector, which is widely recognized for its accuracy in wind-blown sand particle mass flux measurements. The sand collector, with 20 vertical openings (0.02 × 0.02 m² each), was used.
The sediment mass flux Q was calculated using the equation:
Mitigation of experimental bias
The wind tunnel dimensions can significantly affect boundary layer development and introduce wall effects, which may distort turbulence and shear stress, thus impacting the accuracy of sediment transport simulations. 26 To minimize wall effects, a 0.49-m gap was left between the sand bed and the tunnel side walls. Additionally, the sand bed and instruments were aligned along the tunnel's mid-line.
To prevent significant surface changes in the sand bed during continuous wind conditions, which could affect results, the data collection window was shortened. Wind velocity profiles and sand flux measurements were taken with the sand bed re-leveled after each measurement. Since wall shear stress measurements are more sensitive to changes in the bed surface, possibly leading to reduced shear stress fluctuations as the bed erodes, the data collection period for these measurements was shortened to 10–20 seconds, followed by re-leveling of the sand bed.
Results
Development characteristics of wind-blown sand flow
Studies have provided valuable insights into the role of saturation length in controlling sediment transport. 27 The wavelength at which a dune pattern emerges from a flat sand bed is controlled by the sediment transport saturation length, which length refers to the distance required for sediment transport to reach an equilibrium state after a change in wind conditions or surface characteristics.
Figure 2 shows the horizontal velocity profiles of airflow, both with and without saltation. In airflow, the logarithmic layer's height increases between 0.5 m and 4 m downstream. In air-sand flow, sand particles reduce horizontal wind velocity, forming a low-velocity zone up to 4 cm high at x ≤ 2 m. Beyond x ≥ 4 m, this zone reaches over 16 cm in height with little change due to saturation in wind-sand flow.
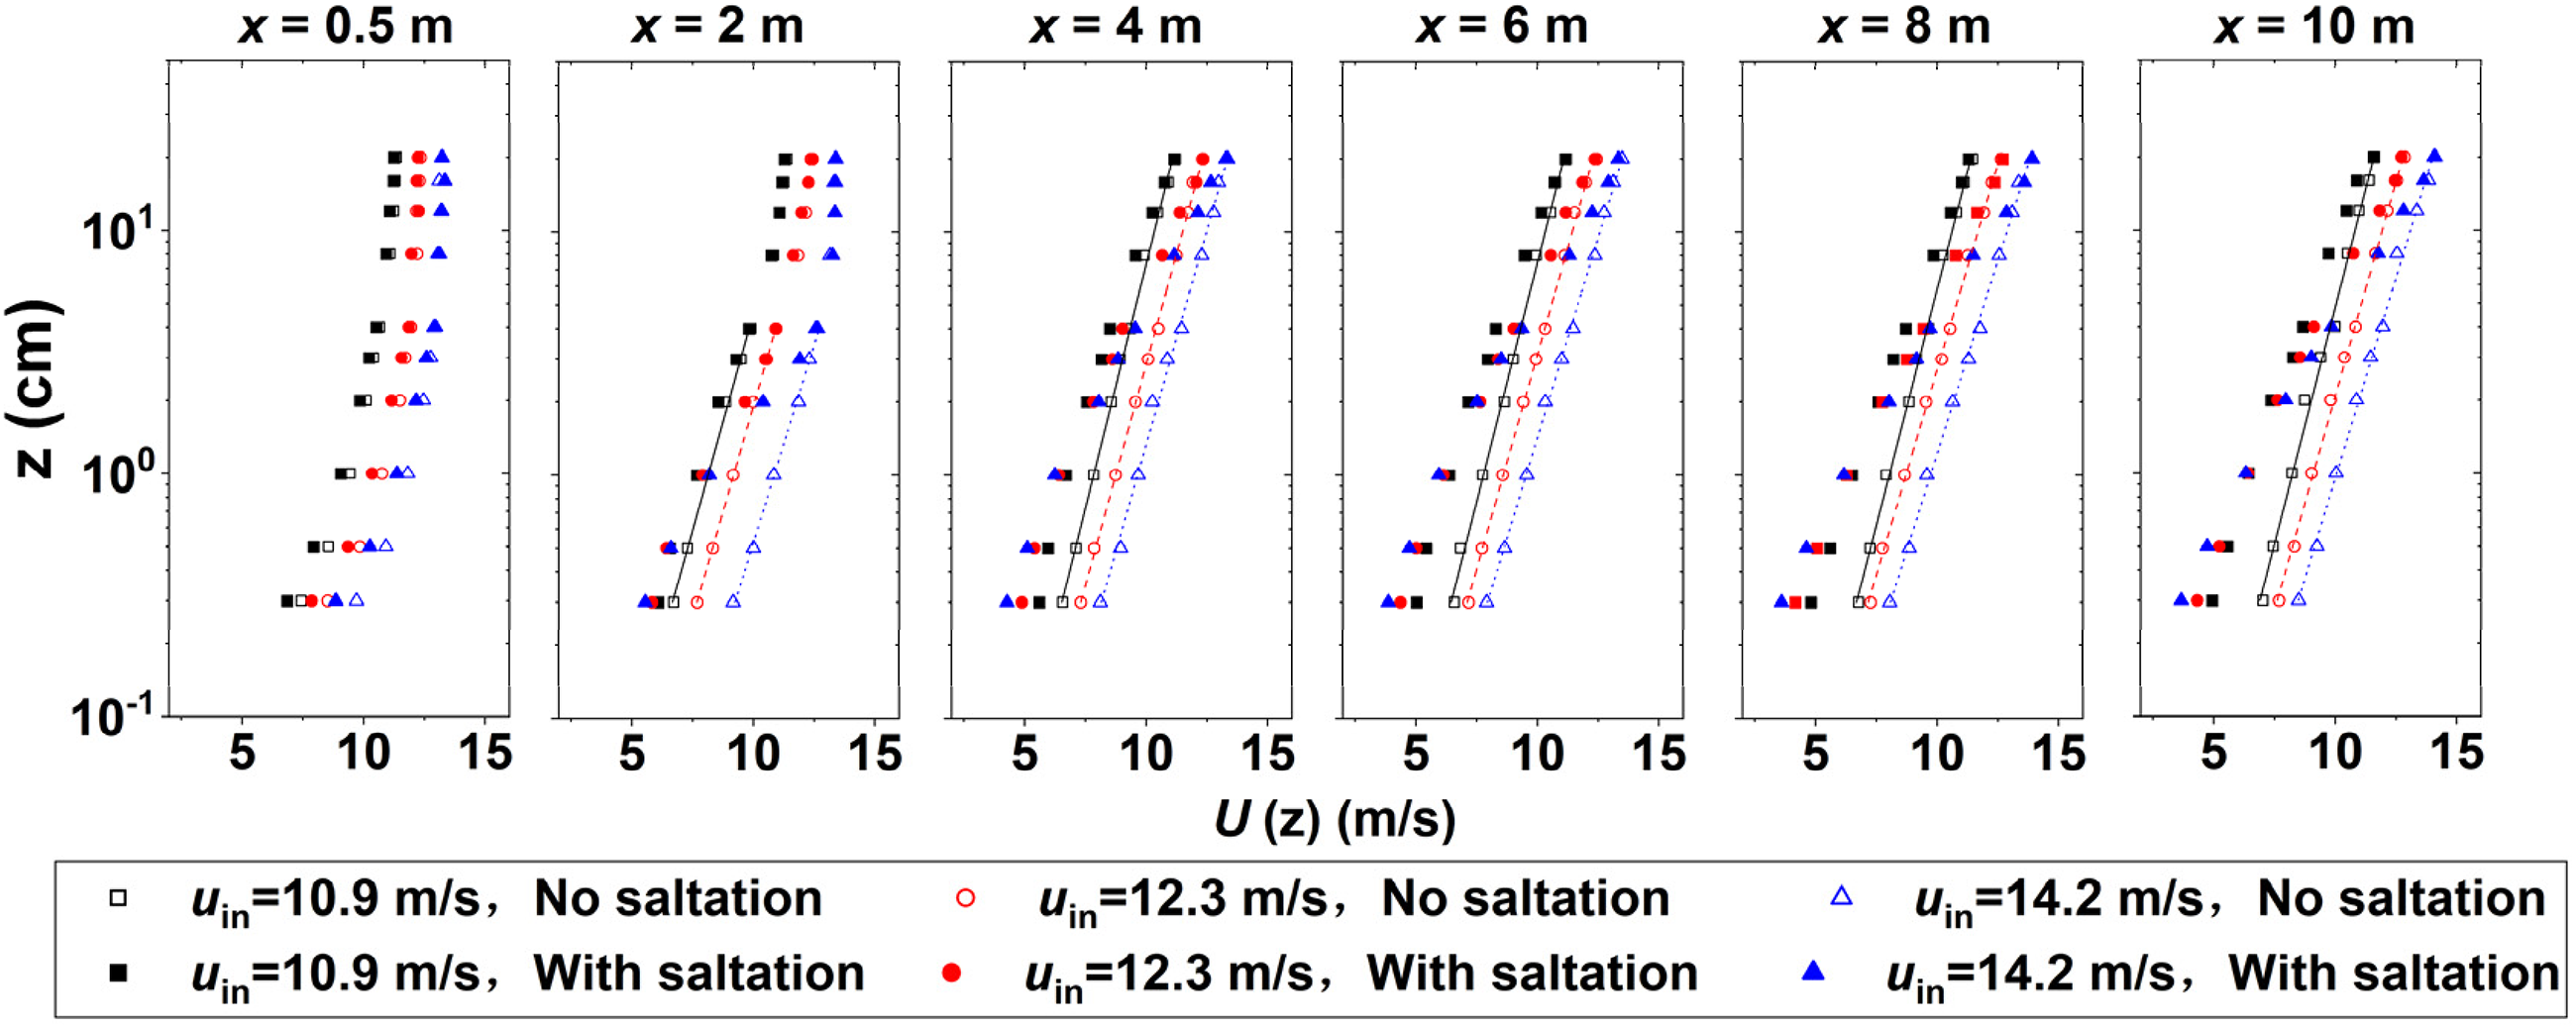
Horizontal velocity profiles along the streamwise direction with and without airborne sand particles.
The boundary layer development in the wind tunnel impacts the accuracy of critical shear stress measurements. 26 In our experiment, the fully developed boundary layer reached 20 cm, confirming that the tunnel dimensions were adequate to generate a thick boundary layer, enhancing the relevance of the results to real-world scenarios.
Figure 3(a) compares the sediment mass flux measured in this experiment to previous wind tunnel and field observations. For comparison, we used the same dimensionless scaling as Kol et al.:
11


(a) Comparison of the dimensionless sediment mass flux of our experiment and measured in wind tunnel (Iversen and Rasmussen, 29 Creyssels et al., 30 Ho et al. 31 ) and field (Li et al. 32 ) experiments for sand with a diameter of ∼250 m. (b) Sediment mass flux along the streamwise direction in our experiment, indicating a normalized fetch length, 1.86.
As illustrated in Figure 3(b), the sediment mass flux along the streamwise direction in this experiment indicates that the wind-blown sand flow reaches equilibrium around x = 2 m, corresponding to the fetch or saturation length. Saturation length represents the distance needed for sediment transport to reach equilibrium following changes in wind conditions or surface characteristics. This concept is akin to the fetch distance observed here. The dimensionless fetch length in this experiment is approximately 1.86, consistent with Pähtz et al. 28 This indicates that despite varying environmental conditions, relaxation processes in sediment transport remain relatively unaffected by external flow variations, resulting in similar saturation lengths.
Aerodynamic shear stress
This section investigates the characteristics of aerodynamic shear stress
Time-averaged aerodynamic shear stress
Figure 4(a) presents fluctuating


(a) Example of fluctuating shear stress,

Figure 4(b) displays the ratios between
Probability of aerodynamic shear stress
Figure 4(c) illustrates the log-normal distribution of
Probability of

The analysis further reveals that higher wind velocities maintain a greater probability of
Further analysis reveals that the non-linear probability decay, characterized by a faster drop in the initial region (0–3.5 m) and a slower decline at greater distances, emphasizes the dynamic nature of the flow near the inlet. Beyond 5.5 m, the system stabilizes, indicating the flow achieves stable for both sediment transport and aerodynamic entrainment at this point.
Discussion
Impulse events and particle movement
Figure 5 presents an example of an impulse event identified in the 

Impulse events in the
The impulse acting on a sand particle is derived as:
To analyze surface sand particle movement during each impulse event, we establish a threshold criterion based on a spherical assumption.
33
When the friction velocity exceeds the threshold for aerodynamic entrainment, particles tend to pivot. However, this does not describe subsequent particle movements. Adopting the classification of particle movement states from existing literature, we categorize the movements as rocking, rolling, and saltation. Figure 6(a) illustrates that if a particle rolls upward due to an impulse but does not reach the dashed line, it rocks within its bed pockets. If it reaches or surpasses this line, it slowly rolls along the surface, denoted by the critical impulse
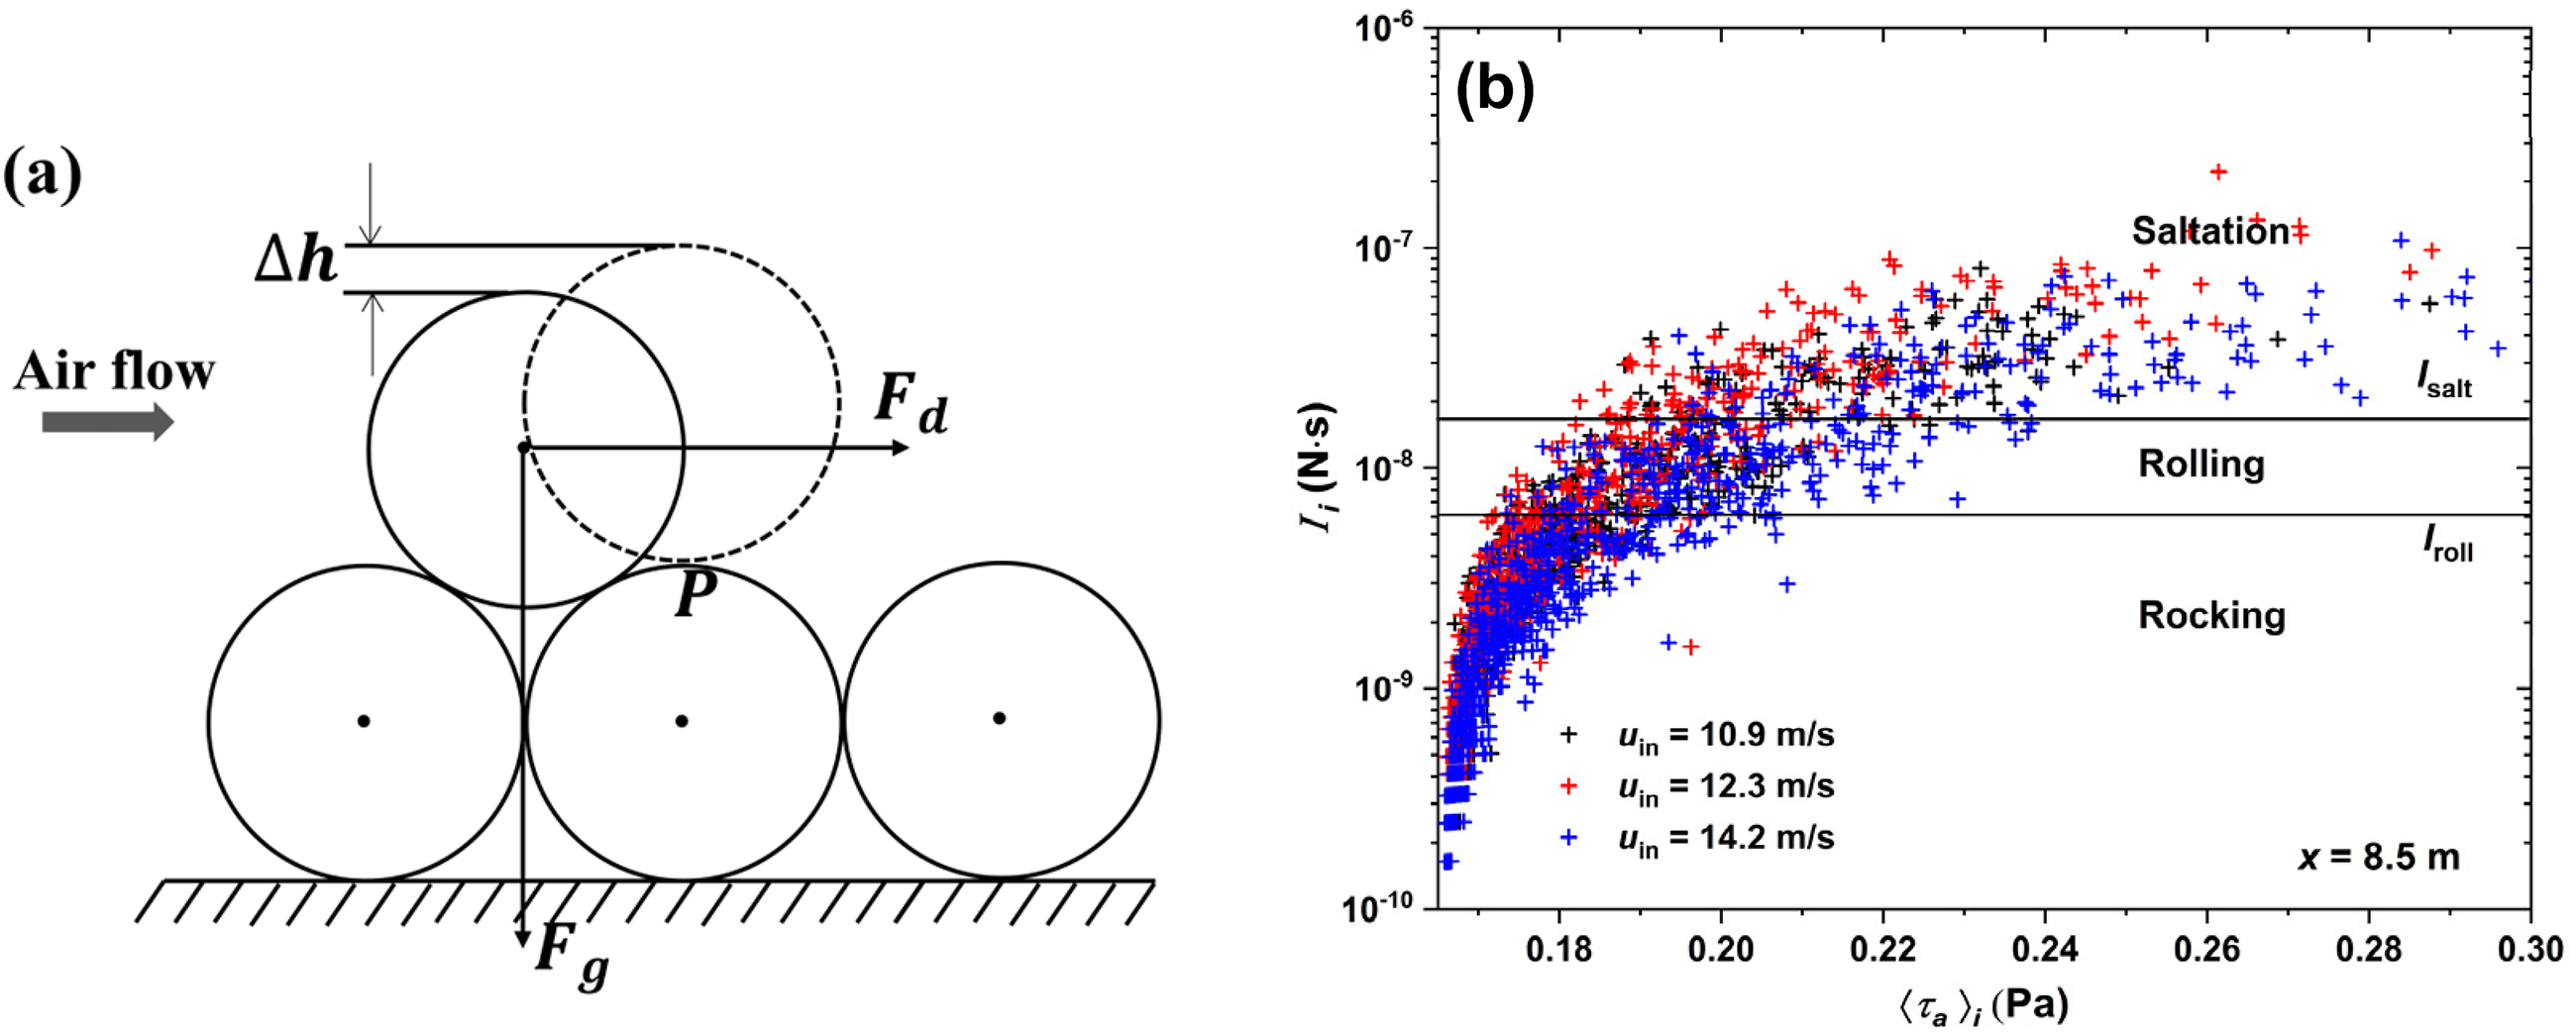
(a) Forces acting on a particle resting on the surface under the influence of an air stream, and (b)
The initial velocity 

Figure 6(b) illustrates the estimation of aerodynamic entrainment based on the aforementioned theoretical analysis. The impulse values
Spatial variability of particle movement modes
The data in Tables 2, 3, and 4 present the frequency and average duration of impulse events generating rocking, rolling, and saltation at various positions (x = 0.5–8.5 m). These tables provide key insights into the variability of particle movement modes as wind-blown sand flow develops, particularly focusing on the fetch of x ≥ 4.5 m.
Number and averaged duration of impulse events generate saltation, rocking, and rolling per second with

Number and averaged duration of impulse events generate saltation, rocking, and rolling per second with

Number and averaged duration of impulse events generate saltation, rocking, and rolling per second with

The number of rocking events generally increases with distance from the starting point, stabilizing beyond x = 4.5 m. For example, at x = 8.5 m, the number of rocking events reaches 4.12/s, significantly higher than at x = 0.5 m (1.17/s). The duration of rocking events remains relatively stable across positions. Rolling events are less frequent than rocking events at all positions, with their frequency generally below 1/s. The average duration of rolling events remains consistent across positions, further stabilizing beyond x = 4.5 m.
Saltation events display greater variability. The frequency of saltation events decreases as x increases up to 4.5 m, suggesting a gradual dissipation of wind energy or changes in surface roughness that hinder particle lifting. Beyond x = 4.5 m, the frequency and average duration of saltation events stabilize, indicating a saturated wind-blown sand flow. For instance, saltation events decrease from 1.37/s at x = 0.5 m to around 0.7/s at x = 8.5 m.
To further study the probability of sand grains undergoing rocking, rolling, and saltation, the proportion of each impulse event type over the entire time series was calculated. Figure 7 illustrates the probability of instantaneous

The probability of instantaneous
The probability of generating rocking
Entrainment thresholds and global sediment transport
The aerodynamic entrainment threshold plays a crucial role in global sediment transport, controlling the initiation of particle movement and sand dune development. Sauermann et al. 12 introduced a continuous saltation model that emphasizes dune formation's dependence on aerodynamic entrainment.
Figure 7 shows that even in saturated wind-blown sand flow, there is a 15.1% probability that impulse events cause surface particles to reach the threshold required for saltation. Considering the vast number of particles on the bed surface, aerodynamic entrainment may begin even before the surface shear stress reaches the known threshold. Our findings suggest that aerodynamic entrainment of surface particles may occur with the impulse effects of aerodynamic shear stress being a critical factor to consider. This implies that when considering impulse effects, random surface particle release may occur before the shear force reaches the aerodynamic threshold, leading to an actual threshold lower than the mean-based
Variations in this threshold could significantly alter the frequency and magnitude of sand movement, thereby affecting dune morphology and migration rates globally. If the aerodynamic entrainment threshold is reduced, previously insufficient wind speeds may become effective, leading to increased particle entrainment. As Zhang et al. 13 demonstrated, sand flux and wind shear velocity are non-linearly related, meaning even a slight decrease in the threshold can exponentially increase sediment transport. The aerodynamic entrainment threshold is crucial for understanding desertification mechanisms. Similarly, the research by Tsoar et al. 34 showed that the formation and migration of different dune types are also influenced by the aerodynamic entrainment threshold. This highlights the importance of understanding the role of this threshold, not only in localized environments but also in predicting broader phenomena such as desertification.
Conclusion
The potential for aerodynamic entrainment in wind-blown sand flow was assessed using 12 hot-film sensors placed along the streamwise direction. The 8-m experimental setup effectively captured nearly all stages of wind-blown sand flow development. By analyzing impulse events where the instantaneous aerodynamic shear stress exceeded the threshold, we determined the movement patterns of surface particles. The main conclusions are as follows:
Streamwise variations in sand mass flux and wind velocity profiles indicate a normalized saturated fetch of 1.86. As wind-blown sand develops, the time-averaged aerodynamic shear stress decreases to a stable level, approximately 78% of the aerodynamic entrainment threshold, The study successfully identified impulse events in wind-blown sand flow through time series analysis. Using threshold shear stress as a criterion, we assessed the aerodynamic forces acting on surface particles, revealing the dynamics of impulse events leading to particle movements such as rocking, rolling, and saltation. The study highlights notable spatial variability in particle movement modes—rocking, rolling, and saltation—along the streamwise direction of wind-blown sand flow. The frequency of rocking events increases with distance and stabilizes beyond 4.5 m, while rolling events remain infrequent. Saltation events decrease as the wind-blown sand flow develops and stabilize at a fetch length of 4.5 m. The reason the impulse characteristics stabilize at a greater distance (4.5 m) compared to sediment transport (2 m) is due to the different dynamics involved. Sediment transport reaches equilibrium faster because it is directly influenced by mean shear stress. In contrast, the impulse in aerodynamic shear stress reflects the unsteady, turbulent nature of airflow. These fluctuations take longer to stabilize as turbulence evolves more slowly over distance, continuously influenced by coherent airflow structures and airborne particles. This leads to the impulse characteristics of the wind field stabilizing over a greater distance. In fully developed wind-blown sand flow, the frequency and probability of saltation induced by aerodynamic entrainment are the primary focus. This finding can be used to incorporate the fluid-driven release of surface particles into simulations of saturated wind-blown sand flow, enhancing simulation accuracy and realism. Despite certain simplifications, such as assumptions about sand grain geometry and threshold levels, our findings provide valuable insights into estimating the potential for aerodynamic entrainment in wind-blown sand flow. By applying the impulse concept to link turbulent particle-laden flow with sand entrainment, these results improve our understanding and modeling of a wide range of wind-blown sand flows.
Footnotes
Author contributions
Xiaojiang Xu performed the data analysis and wrote the manuscript; Wei He performed the experimental operation and formal analysis; Jie Zhang performed the validation.
Declaration of conflicting interests
The authors declared no potential conflicts of interest with respect to the research, authorship, and/or publication of this article.
Funding
The authors disclosed receipt of the following financial support for the research, authorship, and/or publication of this article: This investigation was supported by the projects numbered ZG2023003 and KZX2022070016.
The youth project of Wenzhou University of Technology, the Wenzhou Science and Technology Bureau has initiated the project (grant numbers KZX2022070016, ZG2023003).