
Abstract
Keywords
Introduction
Nasal cavity (NC) mass is a prevalent lesion encountered in clinical practice in otorhinolaryngology. The most common presenting symptom of an NC mass is a unilateral nasal obstruction; however, several of these lesions may also have atypical symptoms, such as rhinorrhea, epistaxis, hyposmia, headache, and diplopia along with oral, ear, and orbital involvement.1,2 Although there are various neoplastic lesions including malignant tumors in the NC, there is no significant difference in the presenting symptoms of each tumor. For this reason, nasal endoscopy has been routinely performed as the first step for the initial investigation of the NC mass, which is a safe, and rapid means to directly visualize and detect NC mass in clinical practice.2–5
The advances in office-based nasal endoscopy over the past few decades have enabled even inexperienced clinicians to detect most of these lesions and have made presumptive diagnosis possible in several cases. 6 This may initiate early treatment, lead to reduced morbidity, faster recovery, and shorter hospital stays. Clinically, the most important thing is to differentiate between the types of pathological masses because the clinical features and treatment strategies may be different.4,7–10 However, the endoscopic visual assessment of NC lesions is subjective and this challenging work requires the examiners’ experience. 11
The study aimed to investigate the accuracy of the clinical visual assessment (CVA) of NC mass lesions based on endoscopic images and determine whether there is a difference in the accuracy according to the pathologic class of lesion and the level of experience of the examiners.
Methods
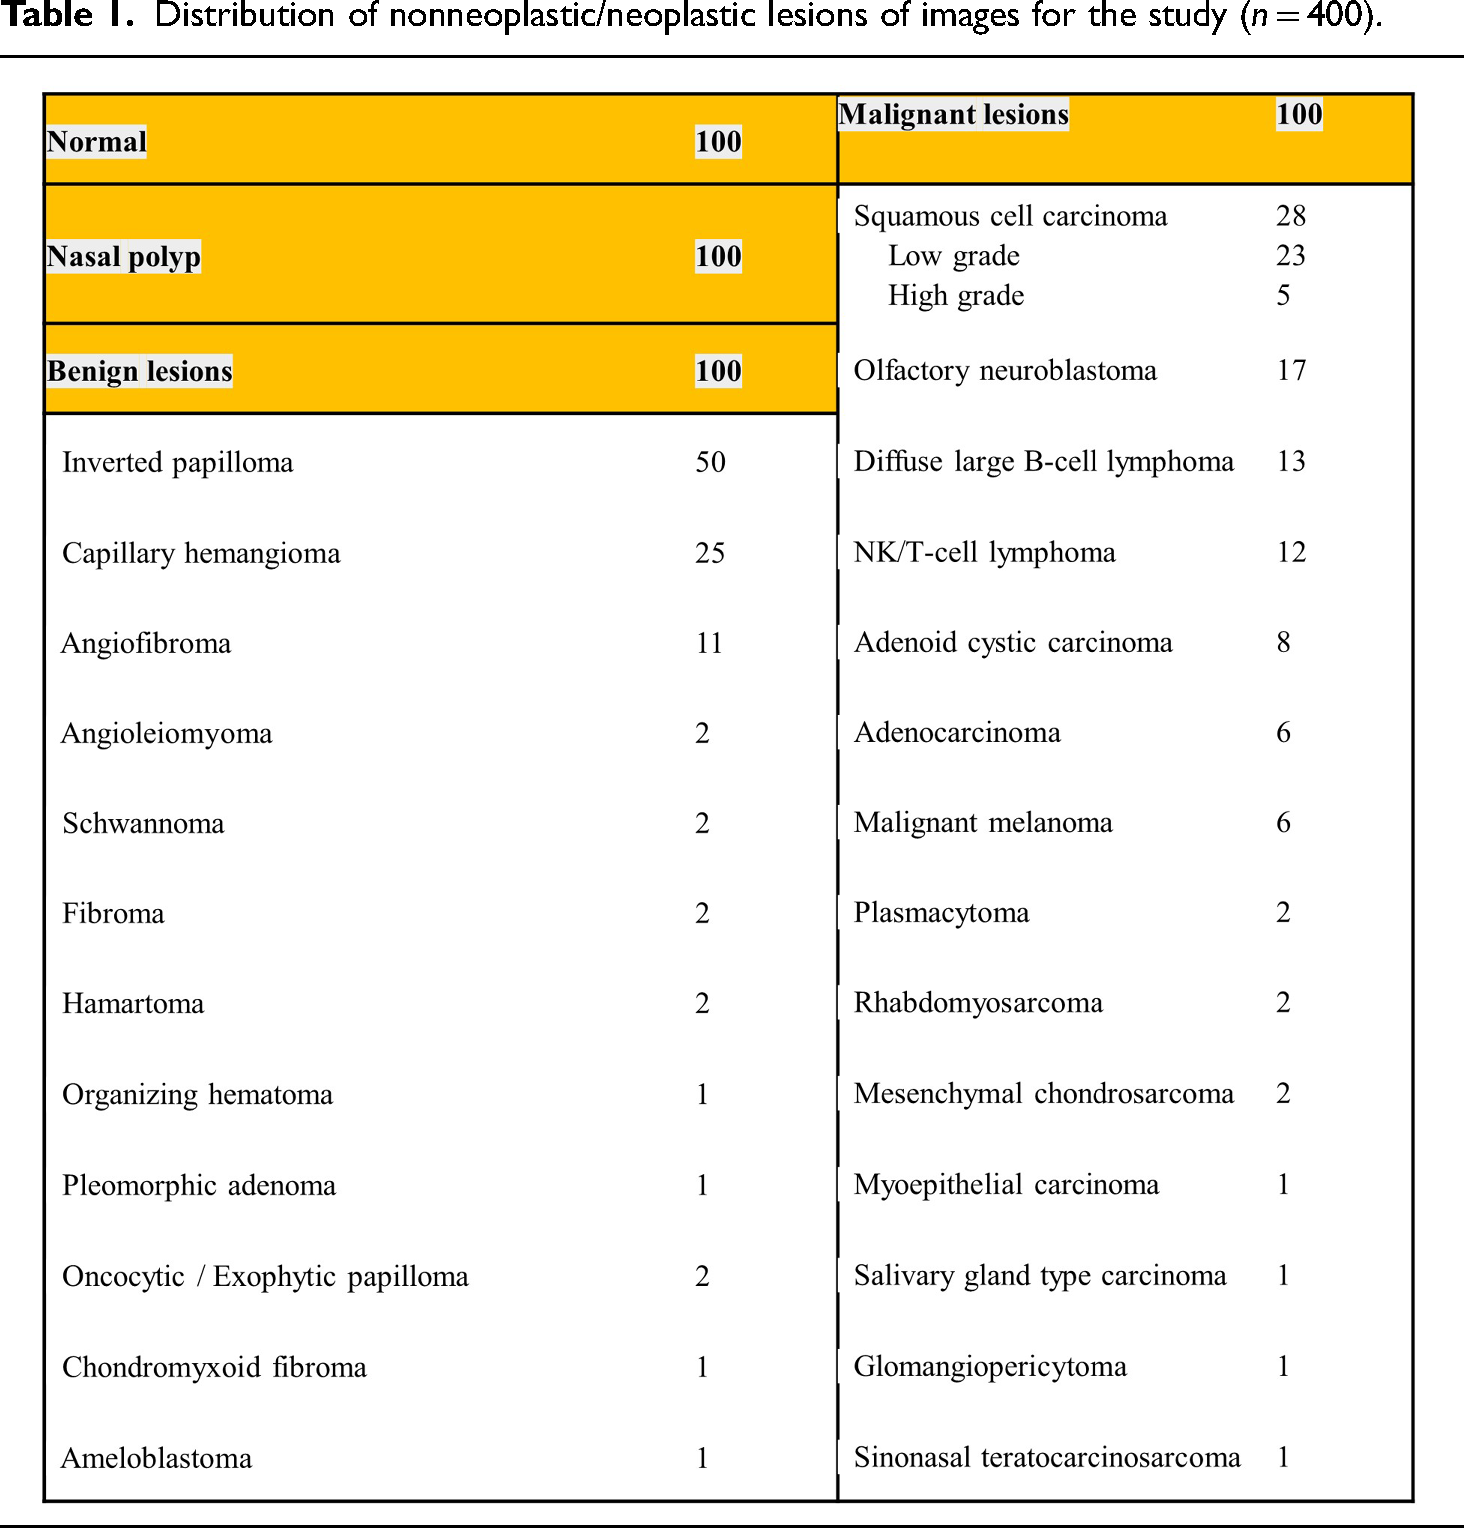
The nasal endoscopic images and clinicopathologic data from patients who underwent routine clinical screening for sinonasal diseases between January 2016 and December 2020 were retrospectively retrieved from the departmental archive of Asan Medical Center, a tertiary hospital in South Korea. Exclusion criteria for the dataset included low-quality endoscopic images with issues such as blurring, inadequate lighting, instrument interference, or lesion obscuration by foreign substances, crust, or purulent discharge. We randomly collected nasal endoscopic images from 100 patients with a normal NC who arrived for rhinoplasty surgery without any nasal symptoms (normal class). Additionally, pathologically confirmed 300 cases of NC mass were involved in the study. The cases included 100 patients with nasal polyps (NP class), 100 patients with benign tumor (Benign class), and 100 patients with malignant tumor (Malignant class), for a total of 400 images. The sample size was determined based on the effect size observed in a preliminary study, 11 and was considered sufficient for effectively identifying and comparing diagnostic features across all classes. Figure 1 shows the typical nasal endoscopic images of each class for this study. The pathologic distribution of the images is shown in Table 1. 12

Example of nasal endoscopic images of each class of lesions. (A) Normal (B) Nasal polyp (C) Benign tumor; Inverted papilloma (D) Malignant tumor; Squamous cell carcinoma.
Distribution of nonneoplastic/neoplastic lesions of images for the study (n = 400).

All the images were captured using a rigid 4-mm nasal endoscope (Olympus Medical Systems Corp., Tokyo, Japan) and an endoscopic capture recorder (OTV-S7Pro; Olympus Medical Systems Corp., Tokyo, Japan). The images had widths and heights ranging from 300 and 600 pixels and were either in PNG or JPG format. A total of 400 randomly mixed endoscopic image datasets were prepared; 18 otolaryngologists classified the images into four groups considering the type of pathology through only visual evaluation. All participants were asked to assess images without a time limit. Notably, six of the 18 otolaryngologists were board-certified rhinologists with >5 years of experience in nasal endoscopy; six otolaryngologists were senior residents with three to four years of experience, and the remaining six otolaryngologists were junior residents with one to two years of experience from a single institution. They conducted blinded assessments according to the appearance of the nasal endoscopic images, without time constraints or additional information.
Diagnostic performance was assessed using sensitivity, F1-score, overall accuracy, and the area under the receiver operating characteristic (ROC) curve (AUC), with comparisons made between different clinician groups. Sensitivity refers to the true-positive rate as the proportion of correctly classified images, which can be obtained as follows: TP/(TP + FN). The F1-score was calculated by applying the following formula: TP/(TP + 0.5(FP + FN)), where TP represents the number of true-positives, FP and FN are the false-positives and false-negatives, respectively. Overall accuracy represents the ratio between the number of correctly classified images and the total number of testing images. ROC curves and AUC were calculated with the help of R studio (RStudio Team, 2021) using R version 4.1.1(R Core Team, 2021) and the packages of pROC. The confusion matrix of the four-group classification task was evaluated to compare the diagnostic accuracy for each pathologic class and also to count the correct and incorrect predictions in each class. The student's t-test was used to compare the accuracy rate between the clinician groups. ROC curves and dichotomized tables were used to analyze the sensitivity and specificity. The SPSS version 20 software package (SPSS Inc., Chicago, IL) was used for all statistical analyses. A p-value of less than .05 was considered as significant. The present study did not require direct interaction with patients or alterations in patient care. This study was approved by the Ethics Committee of Asan Medical Center (2021–0795), and the need for informed consent was waived due to its retrospective design.
Results
The diagnostic performance was significantly different according to the pathological class of the NC mass lesions. All the participated clinicians achieved an overall accuracy of 0.701 ± 0.207 with the following class accuracies: Normal = 0.926 ± 0.100, NP = 0.819 ± 0.135, Benign tumor = 0.580 ± 0.112, and Malignant tumor = 0.478 ± 0.187. The F1 score value also reveals the discrepancies among the pathologic classes: Normal = 0.937 ± 0.076, NP = 0.730 ± 0.093, Benign tumor = 0.549 ± 0.080, and Malignant tumor = 0.554 ± 0.146. The detailed values for diagnostic performance are summarized in Table 2. In the result, the sensitivity, overall accuracy, and F1 score were high in the order of normal, NP, benign tumor, and malignant tumor. Notably, this result demonstrates that clinicians are better at classifying normal and NP images but tend to be inaccurate at discriminating benign and malignant tumor images.
Comparison of 4 class image classification performance and diagnostic accuracy between groups of clinicians with different experience levels.

Each value shows mean ± standard deviation. The average accuracy intervals (values in the square parenthesis on the right column) represent 95% confidential intervals. All values were rounded to the nearest thousandths; that is, 5 and higher values were rounded up at the last digit.
We reported the confusion matrix of the accuracy of the four-class lesions and also compared the diagnostic performance between each examiner group in terms of the confusion matrices of the four-class classification as shown in Figure 2. All the examiners’ groups presented higher performances in the normal class than in the malignant lesion class in the order of normal, NP, benign tumor, and malignant tumor.
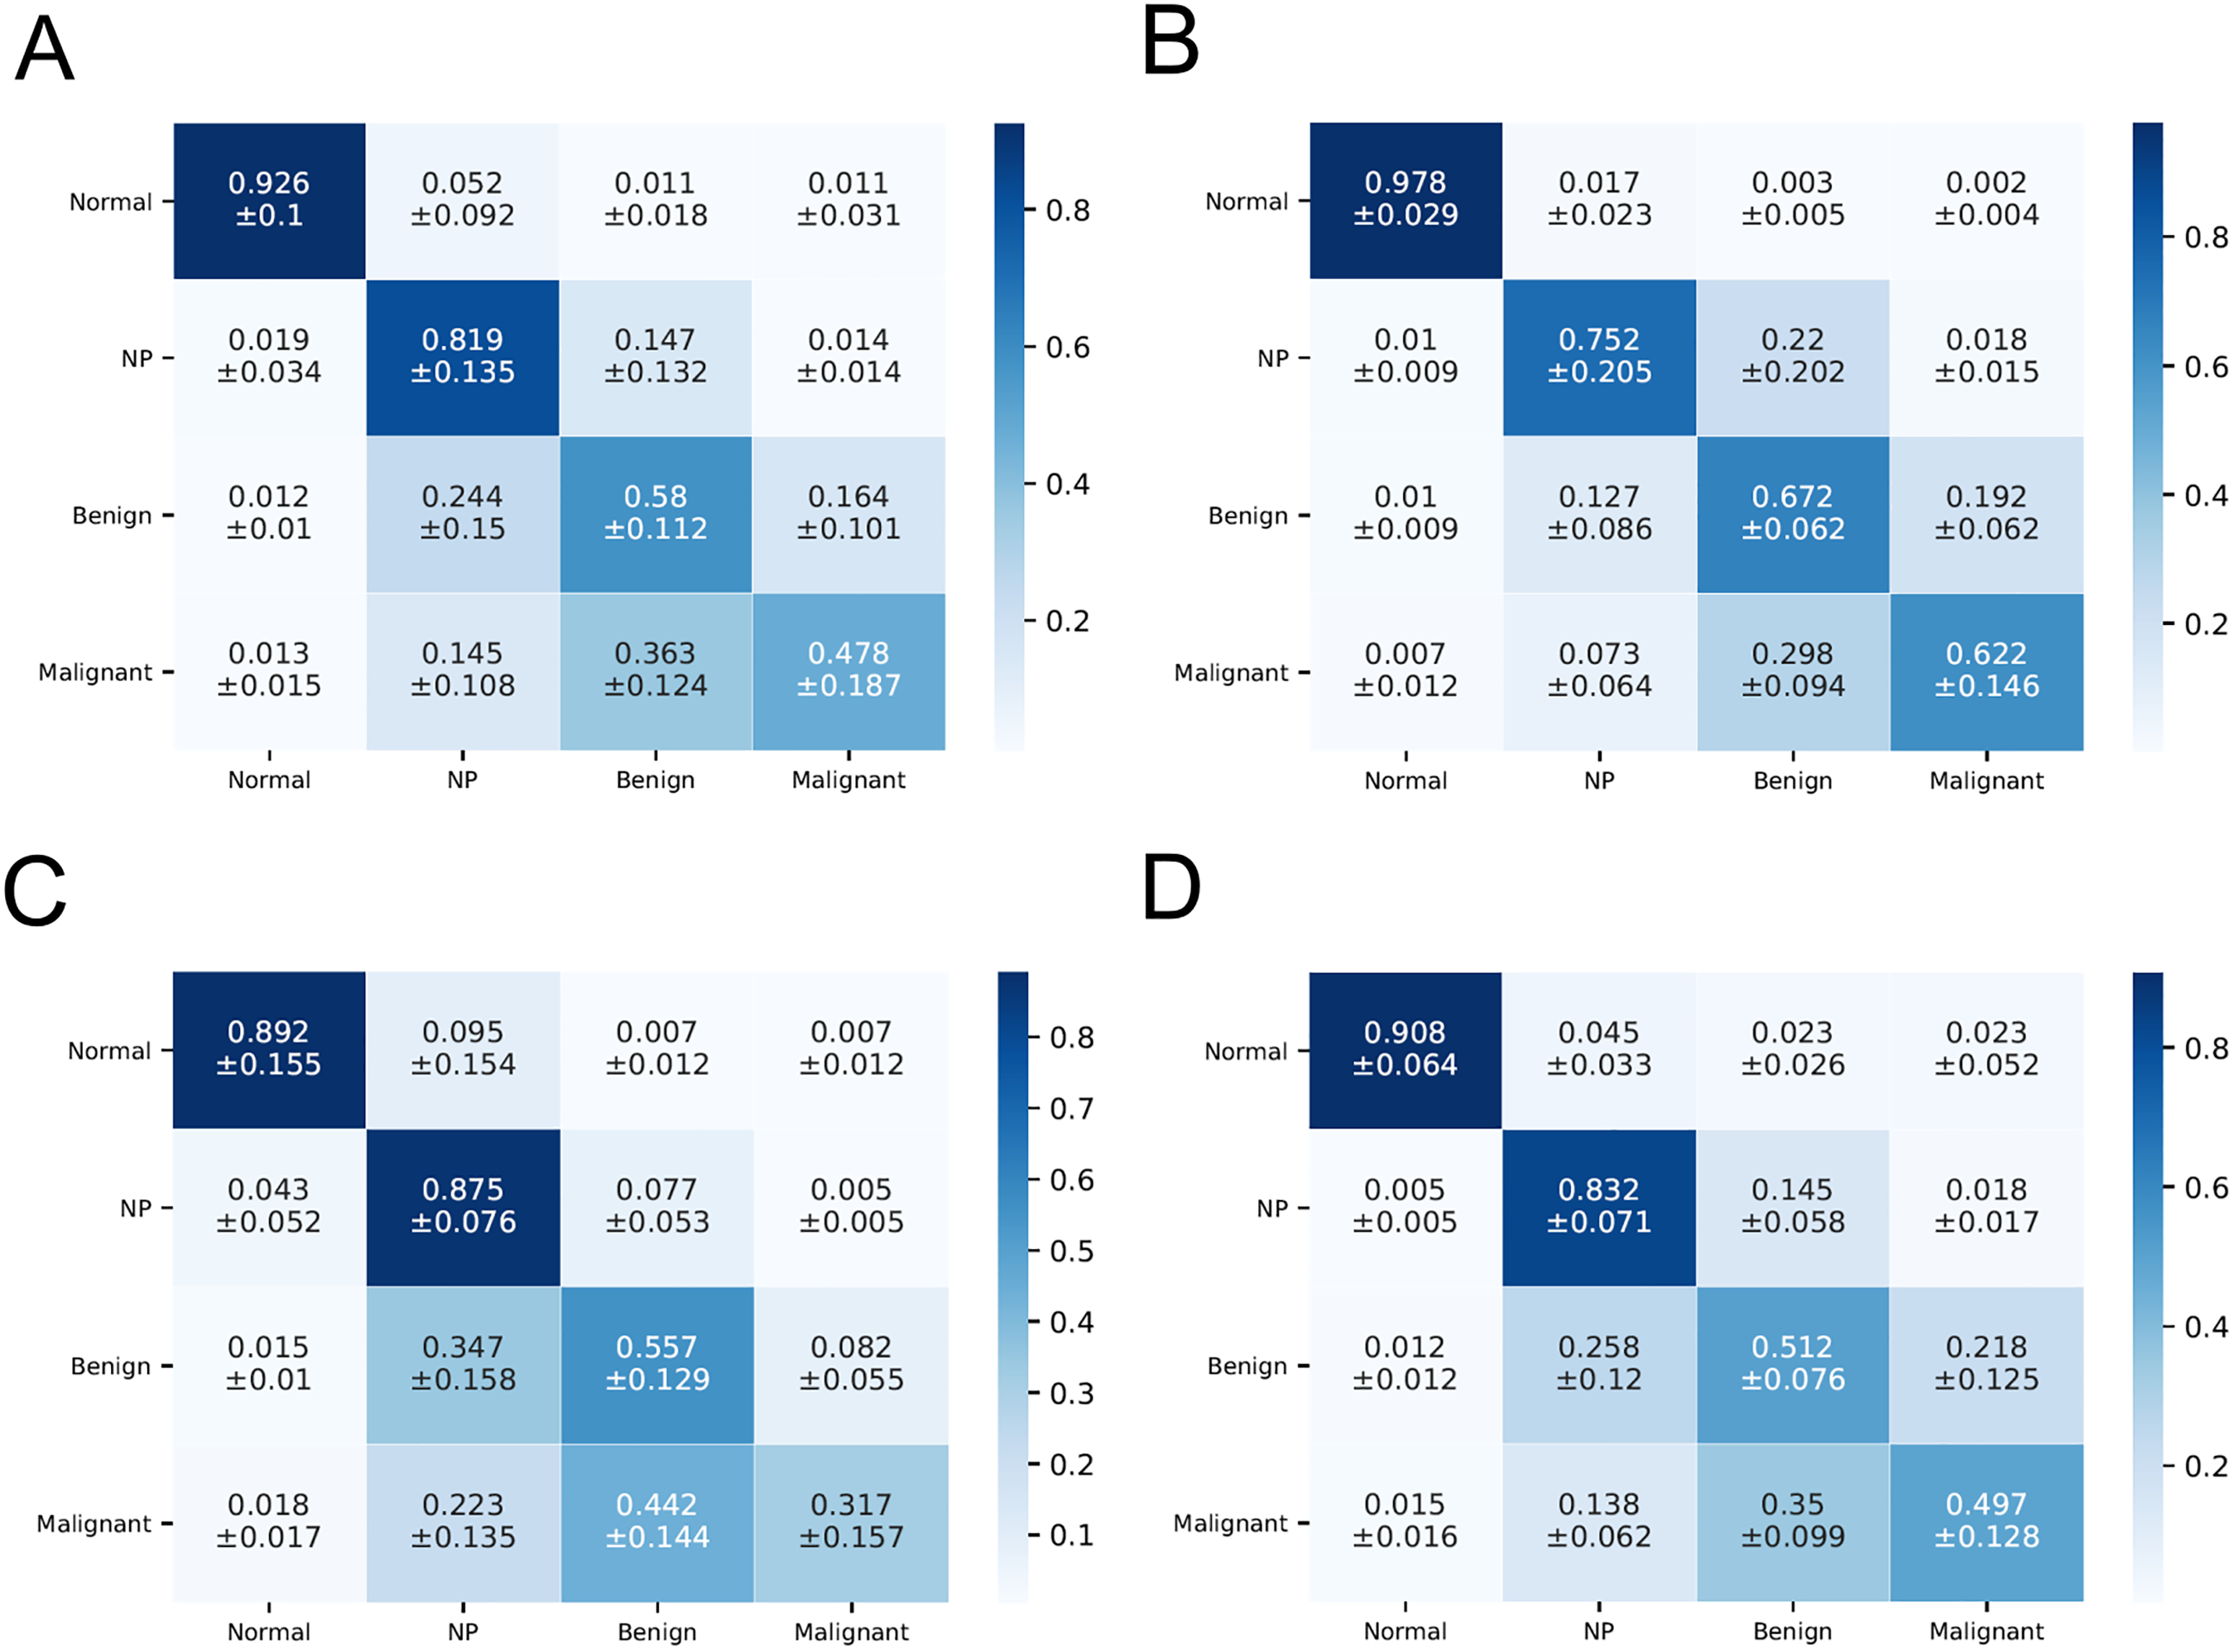
Confusion matrix of the performance of visual assessments by otolaryngologists. For each confusion matrix, the vertical labels represent the true class of the lesion, whereas the horizontal labels represent the predicted class by the examiners. (A) Average of all clinicians, including six expert rhinologists, six junior residents and six senior residents. (B) Average of six rhinologists. (C) Average of six senior residents. (D) Average of six junior residents. Each value in the matrix table shows the mean ± standard deviation.
The confusion matrix table also shows the different rates of misclassification in the pathologic class. In particular, the misclassified ratio of malignant tumor to the benign tumor (0.363 ± 0.124), and benign tumor to NP (0.244 ± 0.150) were relatively high, followed by the benign tumor to malignant = 0.164 ± 0.101, NP to benign tumor = 0.147 ± 0.132, malignant tumor to NP = 0.145 ± 0.108 (Figure 2A). Some actual misclassified examples are shown in Figure 3.

Examples of most misclassified endoscopic images. (A–D) Malignant to benign tumor mismatched cases; (A) Rhabdomyosarcoma (B) Olfactory neuroblastoma (C) Plasmacytoma (D) B-cell lymphoma. (E–F) Benign tumor to nasal polyp mismatched cases; (E) Inverted papilloma (F) Schwannoma.
The ROC curves show a high diagnostic sensitivity for the normal class as indicated by the closer proximity of all of the curves to the upper left corner while indicating a relatively low performance for the benign and malignant tumor class. With the same meaning, the value of AUC demonstrates an inferior performance in classifying the benign and malignant tumor class compared to the normal class (p < .05) in the order of normal, NP, benign tumor, and malignant tumor (AUC of normal = 0.96 ± 0.06, NP = 0.84 ± 0.07, benign = 0.71 ± 0.08, malignant = 0.70 ± 0.05) (Figure 4).

Receiver operating characteristic (ROC) curves and area under the ROC curves (AUC) to compare the diagnostic performance for each class of lesions. p-value for comparison of AUC between the different pathologic classes.
The comparison of the diagnostic accuracy of CVA between the clinician groups is shown in Table 2. Comparing the level of experience of the examiners, the expert rhinologist group showed a higher overall accuracy (0.756 vs. 0.680; p < .05) and F1 score for all four classes than the average resident group (F1 score of normal = 0.976 vs. 0.918, NP = 0.752 vs. 0.719, benign = 0.617 vs. 0.516, malignant = 0.617 vs. 0.496). Especially, there was a significant difference in sensitivity for benign and malignant classes (0.672 vs. 0.535; p = 0.009, 0.622 vs. 0.407; p = 0.016, respectively), while normal and NP image classifications reveal no significant different sensitivity values (0.978 vs. 0.902; p = .058, 0.752 vs. 0.854; p = .287, respectively). On the other hand, there was no significant difference in the overall accuracy between the senior and junior resident group (0.660 ± 0.276 vs. 0.705 ± 0.239, p = .11), while the senior resident group outperformed the junior resident group in NP and benign tumor classification accuracy.
Discussion
Our study investigated the diagnostic accuracy of CVA for NC lesions using endoscopic images and the outcome was highly dependent on the pathologic class and the experience level of examiners. Our results show that the diagnostic performance of CVA was high in the order of normal, NP, benign tumor, and malignant tumor. The overall accuracy of malignant tumor was only approximately half of the normal class value. The result of AUC also reveals an inferior diagnostic performance on the benign tumor and malignant tumor class test sets, indicating that clinicians faced much difficulties in distinguishing benign and malignant lesions when compared to normal and NP lesions. To the best of our knowledge, no published studies have clearly demonstrated the diagnostic accuracy of nasal endoscopy, and this is the first study that investigated the diagnostic accuracy through CVA with NC mass images.
Classifying NC mass lesions according to their histopathological features into various types helps us to know the clinical presentation, treatment, clinical outcomes, and prognoses. Depending on the lesion, different modalities of treatment should be considered. For a case of NP, medication, such as oral or nasal steroids is the first treatment. In patients who do not respond to medication, surgery may be considered to relieve symptoms, such as nasal congestion and restore nasal function.3,13 On the other hand, in the case of benign tumors, surgical resection is the treatment of choice.5,10 In the majority of cases of malignant tumors, wide radical surgery, radiation therapy, and chemotherapy are the main modalities of treatment, and regular follow-up is required for the early detection of recurrence or metastases. Likewise, an early diagnosis and timely treatment will reduce the burden of morbidity and mortality of NC mass lesions, especially in malignant cases.9,14
Compared to the traditional nasal examination method using a nasal speculum or mirror, nasal endoscopy has improved the sensitivity to identify masses of variable appearance. This safe, and rapid means is gaining popularity in the clinical settings of otolaryngologists and has become the gold standard for NC examination. 6 The recent advances in high-resolution endoscopic systems have improved the visualization of epithelial and subepithelial microvascular patterns, which play an important role in the early detection of NC mass lesions. With regard to the advantage of visual assessment using endoscopy, different pathological NC mass lesions generally have characteristic appearances, which may easily suggest the diagnosis. For example, a typical NP is a semitransparent, pale gray or pinkish lobular mucosal tissue with a smooth and glossy surface (Figure 1B). 8 Similarly, inverted papilloma (IP) is also a pale, polypoid mass, but has a more irregular vascularized surface and a granular mulberry-like appearance (Figures 1C and 3E). 4 In the case of angiofibroma, the typical appearance is that of a polypoid hypervascularized mass with a smooth surface, which usually bulges from the lateral wall behind the middle turbinate.5,15,16 Schwannoma appears on endoscopy as a large polypoid mass with a hyper-vascularized surface that usually fills the NC entirely (Figure 3F).5,15,17,18
However, endoscopic evaluation has some limitations in diagnosing the NC mass lesions in clinical practice. First, a similar gross appearance between the different lesions makes it difficult to differentiate the pathology. For example, NP, IP, olfactory neuroblastoma, and lymphoma occasionally have typical pale and edematous endoscopic appearances, and each one requires different treatment options. Second, when two other pathologies are mixed at the same time, differentiating the mass can be more challenging. For instance, in the case of SCC dysplasia from IP or the concomitant presence of inflammatory polyps, it is sometimes difficult and less clear to distinguish inverted papilloma. Additionally, examiners may confuse a mass lesion with a normal NC structure like an inferior/middle turbinate (IT/MT), ethmoid bulla, or uncinate, and also a normal anomaly, such as a double MT or concha bullosa. Despite these limitations, clinicians often rely too much on endoscopic findings to diagnose lesions. Especially in malignant lesions, not infrequently, the treatment is delayed or inadequately managed due to a wrong presumptive diagnosis based on the examiner's subjective evaluation.
Regarding the result of low accuracy of malignant tumor class, we suppose several possible reasons. First, as the incidence of malignant sinonasal tumors is rare compared to benign tumors or NP, clinicians have not experienced many cases in clinical practice. Additionally, malignant tumors consist of epithelial/nonepithelial neoplastic lesions and are divided into various subtypes according to their origin. There are several differences in the appearance depending on the pathologic type, location, malignancy grade, size, and progression. For these reasons, it can be challenging to differentially diagnose malignant lesions solely based on the nasal endoscopic evaluation. The most mismatched cases in our study were rhabdomyosarcoma, olfactory neuroblastoma, plasmacytoma, and B cell lymphoma (Figure 3A–D). This provides some insight into how clinicians made the erroneous decisions about smooth-surface malignant tumors and confused them with benign tumors.
We also observed that the rhinologist expert group showed better classification accuracy for all pathologic classes compared to the resident groups, which supports the idea that the endoscopic visual assessment of NC lesions is subjective, and the use of nasal endoscopy for diagnosis requires specific training time and examiners’ experience as well as advanced endoscopes. However, it should be noted that even in the rhinology-specialist group, the accuracy for classifying malignant tumor images is only 0.622 ± 0.146. Furthermore, there is no significant difference in the diagnostic performance between the senior and junior resident groups. Our results showed that nasal endoscopy is not an ideal stand-alone diagnostic tool for evaluating nasal cavity lesions, regardless of the examiner's level of experience. Therefore, clinicians should always further evaluate nasal cavity lesions in conjunction with radiologic imaging, such as CT or MRI rather than performing nasal endoscopy alone. An imaging study also helps to assess the extent and three-dimensional configuration of the lesion and to reveal its relationship to the surrounding structures of the NC as well as the orbit, skull base, optic nerve, and carotid artery.14,19–24,26–29 In addition, the integration of endoscopy-enhanced techniques like Narrow Band Imaging (NBI) may complement our findings by offering additional insights into the subtleties of endoscopic diagnosis.30,31 NBI's ability to enhance vascular patterns and mucosal textures could further refine diagnostic accuracy, especially in complex cases. For an accurate diagnosis, the histologic examination through biopsy of the lesion should be additionally evaluated for patients with suspected symptoms, smoking history, or old age.19–25 It should be recommended to perform nasal endoscopy in conjunction with biopsy and radiologic study regardless of the impression on endoscopy.
There are several limitations to the present study. First, since a relatively small number of nasal endoscopic images were used and only 18 otolaryngologists participated, caution is needed in interpreting our results. Further multicenter studies with additional types of lesions and especially a larger number of malignant images are needed to evaluate the diagnostic accuracy in real clinical settings. Second, the nasal endoscopy image shows intranasal lesions in a two-dimensional cross-section, which cannot completely represent the mass of the NC with complex structures and anatomical locations. To evaluate diagnostic CVA performance better in additional studies, the video format of endoscopic recordings should be considered.
Conclusion
The diagnostic accuracy of the endoscopic CVA for NC mass is highly dependent on the pathologic class and examiner's experience. Our study showed the accuracy was reliably high at normal NC, but relatively low in classifying malignant tumors, even in the rhinologist expert group. It is challenging to differentially diagnose malignant, benign tumor, and NP solely based on the nasal endoscopic evaluation. Therefore, regardless of the appearance on endoscopy, clinicians should always consider further clinical evaluation, such as a biopsy and radiologic study for suspicious cases.
Footnotes
Declaration of conflicting interests
The authors declared no potential conflicts of interest with respect to the research, authorship, and/or publication of this article.
Funding
The authors received no financial support for the research, authorship, and/or publication of this article.
Author biographies
Kyung Won Kwon is a rhinology specialist. Her area of research is endoscopic sinus surgery, nasal reconstruction and rhinoplasty.
Myeong Sang Yu is a Professor in Rhinology, specializing in advanced sinus surgery techniques. His areas of expertise include endoscopic sinus surgery, sinonasal tumor surgery, and skull base surgery.