
Abstract
The purpose of this study was to establish the dose–response curves for biological dosimetry of the Dong Nam Institute of Radiological and Medical Sciences to monitor radiation exposure of local residents in the vicinity of the nuclear power plant. The blood samples of five healthy volunteers were irradiated with gamma ray, and each sample was divided equally for analysis of chromosomal aberrations by Giemsa staining and three-color fluorescence in situ hybridization painting of the triplet (chromosomes #1, #2, and #4). The results of chromosomal aberrations followed the Poisson distribution in all individual and averaged data which include inter-individual variation in radiation susceptibility. Cytogenetics Dose Estimate Software version 5.2 was used to fit the dose–response curve and to determine the coefficients of linear–quadratic equations. The goodness of fit of the curves and statistical significance of fitted α and β-coefficients were confirmed in both Giemsa-based dicentric analysis and FISH-based translocation analysis. The coefficients calculated from the five-donor average data were almost identical in both of the analyses. We also present the results that the dose-response curve for dicentric chromosomes plus fragments could be more effective for dose estimation following low-dose radiation accidents.
Keywords
Introduction
The risk of radiation leakage from a nuclear power plant accident is ever-present. Radiation exposure occurs in two ways, external and internal.1,2 The body receives radiation that comes from radioactive materials existing on the ground or in the air, or attached to clothes or the surface of the body.1,2 Radioactive materials released from nuclear accidents settle and pollute the surrounding environment, entering the body of living things through breathing or ingestion.1–3 Nuclear power plant workers and nearby residents constantly fear radiation exposure and long-term health repercussions, such as cancer.4–7 Radiation dosimetry measures, calculates, and assesses the amount of ionizing radiation absorbed by the human body and is an essential prerequisite for adequate radiation protection. 8 It is routinely used to monitor occupational radiation workers but not residents near the nuclear power plant.9,10 Therefore, the residents live with an undue psychological burden from uncertainties regarding their radiation exposure and its health consequences.
If a radiation leak occurs, accurately estimating the radiation dose received by each resident is important for scientific risk evaluations and alerting the local community about their potential risk. Therefore, establishing biological dosimetry as a standard monitoring system for residents residing near nuclear power plants is crucial. A series of nuclear power plant accidents and rising anxiety among local communities have encouraged South Korea to develop and establish biological dosimetry capabilities as an essential part of the national nuclear emergency response system. Currently, three institutions with different purposes are operating biodosimetry laboratories in South Korea. Dong Nam Institute of Radiological and Medical Sciences (DIRAMS) the only research institute located in the southeastern part of the country near the nuclear power plants, focuses on the research and development of radiation exposure monitoring systems for nearby residents. 11
All 24 nuclear power plants operating in South Korea are pressurized water reactors, and most accidental overexposures in this system involve gamma radiation sources. 12 Thus, the biodosimetry laboratory of DIRAMS is developing an improved protocol for monitoring the radiation exposure of residents near the power plant. The protocol was applied to the radiation system with a standard dose rate using 60Co beam quality and traceability. 13 This study presented the standard dose–response curves (DRCs) from Giemsa staining-based dicentric chromosome and fluorescence in situ hybridization (FISH) painting-based chromosome translocation assay results to test irradiation ex vivo.
Materials and methods
Blood samples and irradiation
The DIRAMS Clinical Ethics Committee approved this study (Approval No. D-1602-002-001). All experimental procedures were conducted according to the DIRAMS standard operating procedures (DRSC-CH) on biodosimetry following the International Atomic Energy Agency manual (IAEA, 2011) 8 and International Organization for Standardization (ISO, 2019). 14 All volunteers provided informed consent.
We included five healthy volunteers without a history of smoking, radiotherapy, or chemotherapy; three were men aged 30, 35, and 38 years and two were women aged 29 and 30 years. Peripheral blood samples were collected in lithium-heparinized tubes (BD Bioscience, San Joes, CA, USA) and irradiated with 6 mL aliquots. Each blood aliquot was exposed to eight different radiation doses (0.1, 0.25, 0.5, 1, 2, 3, 4, and 5 Gy) with a dose rate of 0.8 Gy per minute. After exposure, the blood was kept for 2 h at 37 °C to allow DNA repair. Giemsa staining and FISH painting were performed at each radiation dose with 3 mL of the same irradiated blood sample.
A 60Co irradiator (Gammabeam X-200, BEST Theratronics, Ottawa, Canada) of DIRMAS was used as the irradiation device (Figure 1). The blood sample was irradiated in a water phantom (50 cm × 30 cm × 25 cm; w × l × h) maintained at 37 °C for exposure to irradiation under conditions close to the in vivo scenario. Physical dosimetry analyses confirmed the radiation quality for establishing the dose responses. 13 The dose was measured by using a farmer-type ion chamber (TM300013, PTW, Freiburg, Germany).15,16 Our physical irradiation measurement system is an internationally recognized calibration and testing laboratory and belongs to the Korea Laboratory Certification System (KOLAS).15–17 The measured dose rate of the ion chamber was 0.7965 ± 0.0035 Gy/min with a gamma field (10 cm × 10 cm) on the phantom surface, and the source-to-surface distance was set to 100 cm at a depth of 5 cm in the water phantom. The blood samples were irradiated under the same conditions as those used in the ion chamber. The water phantom was covered with tissue-equivalent poly(methyl methacrylate) and rotated during irradiation to prevent blood coagulation and sinking. The blood samples were positioned for exposure at least 1 m from the source for uniform irradiation.
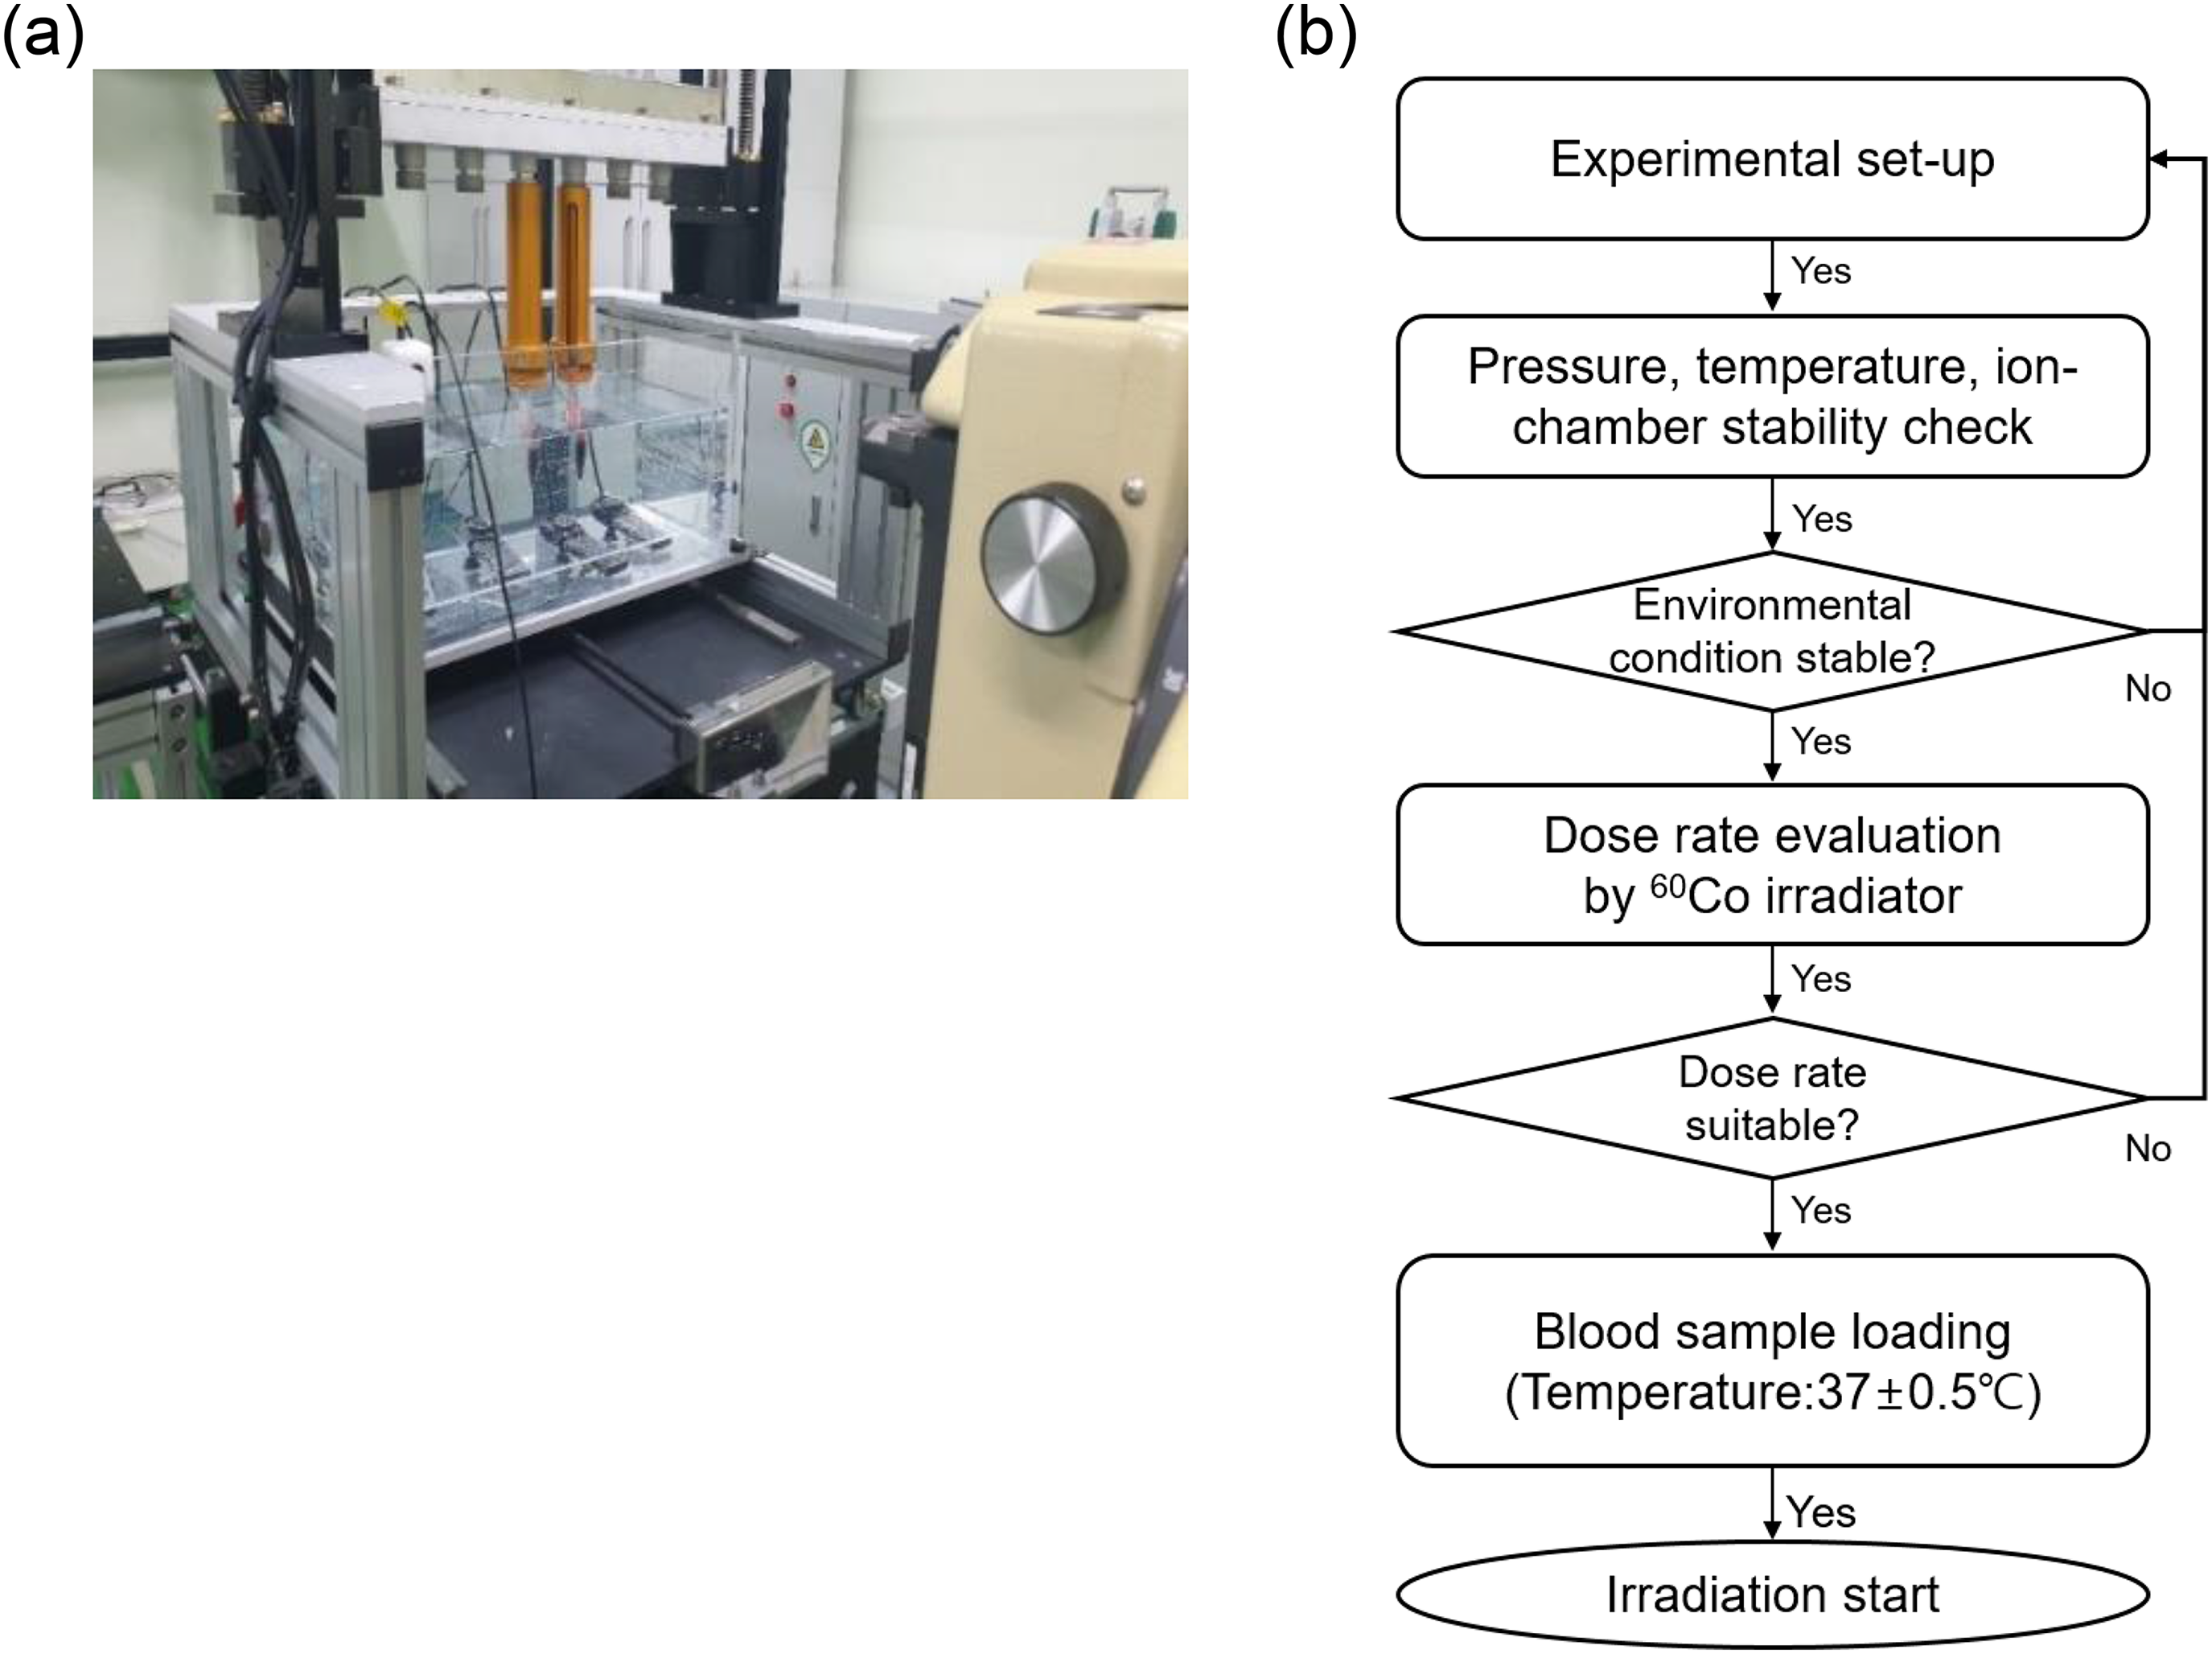
A water phantom system for blood irradiation. An exposure array was used to hold the blood samples for exposure to irradiation with a gamma-ray source. The box container of the exposure array was equipped with heaters to maintain the contents at 37 °C during irradiation. The box container was also rotated during the irradiation to ensure electronic equilibrium.
Lymphocyte isolation and cell culture
Peripheral blood mononuclear cells (PBMCs) were isolated from blood using a Cell Preparation Tube (CPT)™ cell preparation system (Becton Dickinson, Franklin Lakes, USA). PBMCs isolated from each tube were cultured in RPMI 1640 medium (Welgen, Dauge, Republic of Korea) supplemented with 20% fetal bovine serum (FBS, HyClone Laboratories Inc., USA) and 100 units/mL of kanamycin (Gibco, Burlington, Canada). For Giemsa staining, 2% phytohemagglutinin (PHA; Invitrogen, Gaithersburg, MD, USA) and 100 ng/mL colcemid (Life Technologies, Canada) were simultaneously added to the lymphocyte culture media and incubated at 37 °C in humidified 5% CO2 atmosphere for 48 h. For FISH painting PHA (2%) was added first, and the lymphocytes were cultured for 24 hours. Then, colcemid (100 ng/mL), was added, and they were cultured for another 24 hours. The cells were harvested by centrifugation at 1500 rpm for 10 minutes, treated with pre-warmed hypotonic potassium chloride solution (0.075 M), and left for 15 minutes at 37 °C. The cells were spun down again and resuspended in freshly prepared fixative (3:1 methanol/acetic acid) three times. Fixed cell suspensions were stored at −20 °C until slide preparation.8,14
Staining
Metaphase slides were prepared by treating a fixed cell suspension with a HANABI-PVI Metaphase Spreader (ADS BioTec, Chiba, Japan). For the dicentric assay, the chromosomes were stained using the Giemsa method. For the translocation assay, chromosomes were visualized using FISH.14,18,19 The prepared slide was covered with a glass coverslip after adding 9 μL of XCP-Mix probe (Mix-#1R-#2G-#4RG; MetaSystems, Altlussheim, Germany). After sealing and drying the coverslip, the slide was incubated on a ThermoBrite automatic slide hybridizer (TopBrite, Locarno, Switzerland) at 75 °C for 2 minutes followed by incubation overnight at 37 °C in a humidified chamber to allow for hybridization. After removing the glass coverslip, the slide was sequentially washed and rinsed to avoid crystal formation and then air dried at room temperature. Finally, a drop of Vectashield Mounting Medium containing 4′,6-diamidino-2-phenylindole (DAPI; MetaSystems GmbH, Altlussheim, Germany) was added to the slide for counterstaining, covered with a glass coverslip, and sealed with nail polish.
Scoring and establishment of DRCs
The slides were scanned in the AutoCapt mode using an AXIO Imager Z2 microscope (Carl Zeiss AG, Oberkochen, Germany) equipped with charge-coupled device cameras and Metafer 4 software (MetaSystems GmbH, Altlussheim, Germany). Metaphases were scanned at low magnification (10×).
The images from Giemsa stained slides were viewed by an expert scorer to determine whether the chromosomes were of a quality suitable for scoring. The images selected as candidate metaphases for scoring were imaged at high magnification (63×) and exported as JPG files. For each dose per donor, 1000 metaphases for absorbed doses under 1 Gy or metaphases containing more than 100 dicentrics for absorbed doses over 1 Gy were recorded by a scorer and cross-analyzed by another expert scorer. In addition to dicentrics, all other chromosomal aberrations, such as fragments, rings, acentric rings, and minutes, were recorded.
For the translocation assay, an expert scorer previewed the fluorescent images with three colored painted chromosomes (#1 [red], #2 [green], and #4 [yellow]) and the rest chromosomes counterstained with DAPI (blue). The images selected as candidate metaphases for scoring were imaged at high magnification (63×) and exported as MSD files. One thousand genome-equivalent cells were recorded by a scorer for each dose per donor and cross-analyzed by another expert scorer. Simple translocation (two-way or one-way) was counted as a single event. All simple translocations were recorded regardless of the cell's stability.18,19 Complex translocations were converted to an equivalent number of simple translocations based on the number of color junctions. Three pairs of painted chromosomes reflect only a part of the total genome; thus, genome equivalent corrections were applied to the translocation frequencies using the Lucas formula8,14,19: fG is the full genome equivalent translocation frequency, fP is the translocation frequency measured by FISH, and Fi is the fraction of the genome painted for each color i, obtained from IAEA (2011).
8

The chromosome aberration yields were related to the dose by the linear quadratic equation (Y = c + αD + βD2). The calculation of coefficients and the generation of dose–response calibration curves were performed using Cytogenetics Dose Estimate Software version 5.2. 20
Statistical analysis
At each experimental point, aberration-among-cell distributions were checked for consistency with the Poisson model using the variance-to-mean ratio and μ-test. The dispersion index (σ2/y) and the normalized unit of this index (u) were obtained for each dose using an equation described in the IAEA manual. 8 Dispersion index values close to 1 and u values between ±1.96 indicate conformity with the Poisson distribution. Fitting the dose–response to the linear–quadratic model was carried out by the method of iteratively reweighted least squares. The goodness of fit of the curve and significance of fitted coefficients were tested using the Chi-squared (χ2) test and the F-test, respectively. 8 Furthermore, statistical significance was tested using the Statistical Package for the Social Sciences statistical software for Windows, Ver. 18.0 (SPSS Inc., Chicago, IL, USA). Significant differences between two groups were evaluated by Student's t-test and significant differences among more than two groups were evaluated by ANOVA test for multiple comparisons. A difference was considered to be significant at p < 0.05.
Results
Chromosomal damage biomarkers
Peripheral blood lymphocytes from five donors were examined for inter-individual variations in radiation susceptibility. Giemsa staining revealed asymmetric (unstable) chromosomal aberrations, such as dicentric, ring, acentric ring, fragment, and minute aberrations (Figure 2(a)). FISH painting identified symmetric (stable) chromosomal aberrations, such as translocations, insertions, and inversions, as well as unstable types in three chromosome pairs (Figure 2(b)).

Representative metaphases illustrating unstable or stable chromosome aberrations using (a) Giemsa staining and (b) fluorescence in situ hybridization (FISH)-based chromosome painting.
Dicentric analysis using Giemsa staining clearly showed an increase in frequency rate with radiation dose. At 0 Gy, four donors had a general background level of 0–1 dicentric chromosomes per 1000 metaphase cells, whereas S-3 had two dicentric chromosomes. The dicentric chromosome frequency rate did not differ from 0.1 to 1 Gy, but individual variability was observed above 2 Gy (Figure 3(a)). The dicentric chromosomes determined by FISH painting also changed in a dose-dependent manner. However, FISH painting has a technical weakness in making the distinction of centromeres due to loss of resolution associated with fluorescence compared to bright-field staining, which results in the misscoring of dicentrics. Dicentric frequencies found in the painted chromosomes and scaled to the whole genome were lower than those of Giemsa staining (Figure 3(b) and (c)).

The frequency rates of unstable chromosome aberrations in the peripheral blood lymphocytes to test irradiation ex vivo. The dicentric chromosome frequency rates from five donors using (a) Giemsa staining and (b) fluorescence in situ hybridization (FISH) painting were examined. (c) The five-donor average dicentric chromosome frequency rates assessed by Giemsa staining and FISH painting. (d) The five-donor average frequency rates of unstable chromosome aberrations assessed by Giemsa staining. Data reported as the mean ± standard error (SE). *P < 0.05 vs. four donors (S-1, S-2, S-4, and S-5), **P < 0.05 vs. FISH painting and #P < 0.05 vs. fragment.
Regarding other unstable chromosomal aberrations, rings and fragments also showed dose-dependent patterns similar to those of dicentric chromosomes. Rings are much rarer than dicentric chromosomes. However, fragments can form concomitantly with dicentric chromosomes or independently; thus, they occur at high frequencies (Figure 3(d)). These results suggest that analyzing dicentric plus fragments may be a more useful biomarker than the dicentric assay for radiation exposure measurements, particularly at low doses.
Establishment of DRCs for dicentric assay
The dicentric yield data related to the radiation dose were constructed and analyzed for compliance with the Poisson distribution. The dispersion index was 1 or close to 1 in almost all data (Supplementary Table S1), and their corresponding u-values were between −1.96 and 1.96. The dicentric distribution for the individual donors and their averaged data were well-represented by the Poisson distribution. However, in the five-donor pool, under-dispersion (u < –1.96) occurred at 0.5 and 5 Gy, suggesting that a simple summation of the data may be inappropriate for data sampling. Thus, it was excluded when constructing subsequent DRCs. The Cytogenetic Dose Estimate software version 5.2 uses the maximum likelihood method to fit the calibration data to the linear–quadratic equation; we used this to fit the DRCs and determine the linear quadratic equation's C, α, and β coefficient values. Table 1 presents the fitted DRC coefficients (C, α, and β) when using the data from Supplementary Table S1; the standard errors were calculated using Poisson assumptions. The curve's goodness-of-fit and significance of the fitted α and β coefficients were tested using the Chi-squared (χ2) test and the z-test, respectively. The χ2 test p-values (Table 1) indicate that the fitted data points did not differ from the observed ones, confirming a good fit, especially for the five-donor averaged data. For the linear and quadratic coefficients, all coefficients for the individual donors and their averaged dicentric data were confirmed by z-test (p < 0.05), except for the α coefficient of S-3 (p > 0.05). Figure 4 illustrates the DRCs constructed using the calculated coefficients.

Dose–response curves generated from dicentric and fragment in Giemsa staining data. Plots of the individual (a) dicentric chromosome and (b) fragment frequency rates and the (c) five-donor average dicentric, fragment, and dicentric plus fragment frequency rates. Data reported as the mean ± standard error (SE).
The results of fitting the dicentric chromosome and fragment data in Giemsa staining of blood samples from five healthy donors.

DRC was constructed with Dose Estimate ver. 5.2
* p-values for coefficients : z-test
χ2: Weighted Chi Squared
df: Degreed of Freedom
p-value for Goodness-of-fit: Chi Squared Distribution Calculator
Establishment of DRCs for translocation assay
Stable translocations were scored along with unstable dicentrics in the metaphase spread of total cells without distinguishing between stable and unstable cells. The genomic translocation frequency was calculated for the painted fraction, and the observed translocation data were converted to full genome equivalences (Supplementary Table S2). The curve's goodness-of-fit and significance of the fitted α and β coefficients were tested similarly to the dicentric assay since the curve-fitting mathematics are equivalent.
Similar to the dicentric assay, the curve's goodness-of-fit and fitted α coefficient were not statistically significant for the individual translocation data of S-3. However, all coefficients were statistically significant for the five-donor average data (Table 2). Figure 5 presents the DRCs constructed using the calculated coefficients.

Dose–response curves generated from fluorescence in situ hybridization (FISH) painting translocation data. Plots of the individual or five-donor average translocation were showed. Data reported as the mean ± standard error (SE).
The results of fitting the translocation data in FISH painting of blood samples from five healthy donors.

DRC was constructed with Dose Estimate ver. 5.2
* p-values for coefficients : z-test
χ2: Weighted Chi Squared
df: Degreed of Freedom
p-value for Goodness-of-fit: Chi Squared Distribution Calculator
As most actual or suspected accidental exposures to radiation involve small doses, the minimum measurable limits for the DRCs were calculated. 21 A dose estimate was considered as a minimum measurable limit when its lower 95% confidence limit falls above zero. 21 In Supplementary Table S3 calculated from the linear/quadratic dose–response equations from the five-donor average data, the lower limits of measurement for dicentric, fragment, dicentric plus fragment, and translocation were 76, 96, 63 and 115 mGy, respectively.
Discussion
Dicentric chromosome aberrations are an exchange between the centromeric pieces of two broken chromosomes and the primary type of chromosomal aberration used for biological dosimetry.22,23 Several studies have demonstrated a close correlation between the yield of radiation-induced dicentric chromosomes and the absorbed radiation dose for in vivo and in vitro exposures.24–37 Thus, the dicentric assay has become the gold standard for radiation biodosimetry for acute whole-body exposure. 8 The standard dicentric DRCs were obtained from the blood samples of one or several healthy individuals in various countries,24–37 but most did not reflect an individual's radiation sensitivity. Instead, they were obtained based on having similar background levels of cells with dicentric chromosomes among individuals (0–1 per 1000 cells).24–37 However, among the five volunteers in this study, S-3 had a higher background level and dicentric frequency rate depending on the radiation dose. S-3 was a 30-year-old healthy woman with no history of smoking, drinking, or radiation exposure, and there was no background information or factors that could influence radiation sensitivity compared to the other four volunteers, indicating inter-individual radiation susceptibility variation. This result suggests that obtaining radiation dose–response data from various susceptible individuals is necessary to establish standard DRCs. The Poisson distribution represents the distribution of damage produced by gamma-ray irradiation. Thus, the distribution of cells with dicentric chromosomes was tested to determine whether it complied with the Poisson distribution per dose, which was used to construct the calibration curve. We used the u test statistic, the normalized units of the dispersion index (σ2/y), and all data points, including the five-donor average, complied with the Poisson distribution. 8 In the dicentric assay DRCs, the five-donor average data (including S-3) had a good fit and statistically significant coefficients, despite the insignificant result from the S-3 α coefficient. This evidence suggests that a standard DRC can be established with data from individuals with significant differences in radiation sensitivity. The fitted coefficients in the present study were compared with the values taken from many other studies related to the construction of gamma-radiation curves using 60Co sources (Supplement Table S4). Although there are some differences between the results, our values are in good agreement with those reported by others.24–37
The number of aberrant circular chromosomes lacking a centromere, fragments that have resulted from the joining of two breaks within one chromosome was increased with an increasing radiation dose.8,38 In particular, at low doses, the frequency rates were relatively high compared to dicentrics. 38 Therefore, in the low-dose dose estimation, it may be more useful to consider the frequency of dicentrics and fragments together. The formation of fragments is not specific to ionizing radiation as they may occur as a result of an interaction with some other clastogenic agents. This type of chromosomal aberrations was not used alone in biological dosimetry, however, it is still used in some cases along with other types of chromosomal aberrations.30,38,39 As a result of this study, adding fragment data to the dicentric data and fitting this to the linear quadratic equations yielded a higher linear coefficient value, and further reduced the measurement lower limit. To apply our DRCs to estimate absorbed radiation, some blind tests were performed (Supplementary Table S5). In the case of the sample irradiated with 2 Gy, almost accurate estimates were obtained from dicentrics alone, fragments alone, and dicentrics plus fragments, whereas in the sample irradiated with 0.25 Gy, the closest result was derived from dicentrics plus fragments. This result suggests that analyzing dicentric chromosomes plus fragments may provide more effective biological dosimetry results for preparedness and responses to most radiation accidents involving doses of less than 1.0 Gy.
Dicentric and fragmented chromosomes are unstable chromosome aberrations cleared from the peripheral blood lymphocyte pool at the cell renewal rate; thus, dos assessments based on these analyses are limited to acute radiation exposure. 8 Translocations are mitotically stable damages to address biological dosimetry for old or long-term exposures.8,14,18,19 However, they can fail to negotiate division if unstable structures and complex forms are present in the same cell. For this reason, it is sometimes necessary to consider the stability of the entire cell along with individual chromosomal aberration types. Calibration curve generation based on stable cell translocations is an established method for retrospective dose evaluation.8,18,19 However, our study suggests that considering the translocation yield in all cells is more appropriate for monitoring potential radiation exposure in nearby residents. Those who have lived near a nuclear power plant for a long time may have a history of old and long-term exposure, whereas other residents who recently moved may have acute exposure. After acute exposure, especially at high doses, restricting translocation to stable cells underestimates the dose because the number of unstable cells with translocations increases with the number of complex aberrations. Moreover, the DRC has an upper-level dose limit because cells free from unstable damage become increasingly rare. In this study, the calculated α and β coefficients of the linear quadratic equation based on the full genome equivalent translocation yields in all cells were nearly equivalent to those from the dicentric analysis. However, in monitoring chronic exposure over a long period of time, the most appropriate cytogenetic dose assessments can be achieved through follow-up studies with FISH and unstable aberration analyses run in parallel on irradiated accident victims starting promptly after their exposure. The follow-up FISH dose estimations are generally undertaken for cases where the exposure dose was high but protracted or after low radiation exposure a long-time ago with no medical symptoms.40–42 In contrast to acute exposure dosimetry, the linear α term of the DRC is crucial. Therefore, we are preparing a separate DRC from the translocation yield of only stable cells.
In conclusion, we generated reliable DRCs for dicentric and translocation assays of DIRAMS based on the average data of five healthy donors with inter-individual radiation sensitivity variation by ex vivo dose–response calibration experiments. Blind tests on radiation-exposed blood samples indicated that the estimated doses based on our DRCs were consistent with the known doses (Supplementary Table S5). Based on this study, we will continue to update our DRCs by increasing the sample size and the number of cells analyzed. In addition, we are improving the test method such as centromere-specific FISH so that more samples can be easily analyzed and low-dose exposure can be monitored more efficiently.
Supplemental Material
sj-docx-1-sci-10.1177_00368504231198935 - Supplemental material for Biological dosimetry dose-response curves for residents living near nuclear power plants in South Korea
Supplemental material, sj-docx-1-sci-10.1177_00368504231198935 for Biological dosimetry dose-response curves for residents living near nuclear power plants in South Korea by Soo Kyung Jeong, Su Jung Oh, Yeong-Rok Kang, HyoJin Kim, Yong Uk Kye, Seong Hun Lee, Chang Geun Lee, Moon-Taek Park, Jeong-Hwa Baek, Joong Sun Kim, Min Ho Jeong and Wol Soon Jo in Science Progress
Footnotes
Declaration of conflicting interests
The authors declared no potential conflicts of interest with respect to the research, authorship, and/or publication of this article.
Ethics approval
The Clinical Ethics Committee of the Dongnam Institute of Radiological and Medical Sciences (DIRAMS) Clinical Ethics Committee approved all experimental procedures (DIRAMS, Approval No. D-1602-002-001).
Funding
The authors disclosed receipt of the following financial support for the research, authorship, and/or publication of this article: This work was funded by a Dongnam Institute of Radiological and Medical Sciences (DIRAMS) grant funded by the Korean government (MSIT) (grant numbers 50491-2023).
A Dongnam Institute of Radiological and Medical Sciences (DIRAMS) grant funded by the Korean government (MSIT), (grant number 50491-2023).
Supplemental material
Supplemental material for this article is available online.
Author biographies
Soo Kyung Jeong is an excellent researcher who will be graduating from her doctorate this year. She was trained for five years as biodosmietry expert and has participated in DIRAMS project to establish biodosimetry system since 2019. She is working on a research project to develop dicentric chromosome assay using a deep learning-based automated system and two papers were published as co-author or first author.
Su Jung Oh is an excellent researcher with a master’s degree. She is also biodosmietry expert and was trained for five years. She is the executive secretary of biodosimetry network involving four institutions in South Korea and participate in cross analysis tests using dicentric assay and translocation assay organized by the network.
Yeong-Rok Kang is an expert in physical dosimetry and radiation safety manager of Dongnam Institute of Radiological & Medical Sciences. More than 40 papers were published as the co-author or corresponding author index by SCI(E).
HyoJin Kim is conducting research on nuclear data, radioactivity/radiation analysis, and physical dosimetry (Electron Paramagnetic Resonance spectroscopy- EPR Dosimetry). 15 papers were published as the co-author or correspondent author index by SCI.
Yong Uk Kye is an expert in Monte Carlo computer simulation related to radiation protection and the use of physical dose dosimetry.
Seong Hun Lee is graduated mater course of applied material at Chungnam University in 2019. He has participated in Material recycling and AlN synthesis project. Six papers were published as the co-author index SCI.
Chang Geun Lee is working at the Research center of Dongnam Institute of Radiological & Medical Sciences (DIRAMS). He received his PhD degree from POSTECH (ROK) majoring in development of immunotherapy. Currently, he is working on the effect of low dose radiation and the role of radiation dose rate.
Moon-Taek Park is a radiation biologist and cell biologist with expertise in the tumor microenvironment and radiation therapy efficacy. He is a senior scientist at DIRAMS with over 10 years of research experience. He served as a board member of the Korean Society of Radiation Bioscience and published about 25 papers as the first author and corresponding author.
Jeong-Hwa Baek is a radiation biologist and cell biologist with in radiation combined the anti-tumor therapy. He is a senior scientist at DIRAMS with over 3 years of research experience. Currently, he is working on the effect of low dose radiation and the role of radiation dose rate.
Joong Sun Kim is currently an Assistant Professor at the College of Veterinary Medicine, Chonnam National University in Republic of Korea. He obtained his PhD in Radiation biology from Chonnam National University. Prior to his recent appointment at the Dongnam Institute of Radiological & Medical Science, he was studied about low dose radiation effect. More than 60 papers were published as the first author or correspondent author about ‘Radiation biology’.
Min Ho Jeong is professor at Dong-A University College of Medicine in Republic of Korea and an excellent doctor research. He has various experiences such as immunology, virology, genetic toxicology, marine ecotoxicity with using Ballast treated water and CRO (Contract Research Organization). He established the GLP (Good Laboratory Practices) at a medical school for the first time in Korea and was certified by a toxicology testing agency from Ministry of Food and Drug Safety in Korea. He has published many papers in various fields so far as the first author and corresponding author.
Wol Soon Jo is co-corresponder of this paper and is establishing biodosmietry system in DIRAMS since 2019. She has various experiences such as cancer immunology, genetic toxicology, microalgae and radiation biology. She is a member of the Korean Society of Toxicology and genetic toxicologist and is also member of the Korean Society of Radiation Bioscience. She published about 30 papers as the first author and corresponding author. She published more than 30 papers as the first author or correspondent author relation to Radiation biology.
References
Supplementary Material
Please find the following supplemental material available below.
For Open Access articles published under a Creative Commons License, all supplemental material carries the same license as the article it is associated with.
For non-Open Access articles published, all supplemental material carries a non-exclusive license, and permission requests for re-use of supplemental material or any part of supplemental material shall be sent directly to the copyright owner as specified in the copyright notice associated with the article.