
Abstract
Local corrosion flaws (LCFs) widely exist in large diameter pipelines (LDPs) (e.g. steam, oil/gas pipeline) due to flow-accelerated corrosion, environmental corrosion, and material aging. Frequency-band-selecting eddy current testing (FBS-ECT), as an improved eddy current technique (ECT), has rich harmonic components in exciting signals as a pulsed eddy current technique (PECT), as well as more effective utilization of electromagnetic energy by selecting a frequency band. It is expected that FBS-ECT has promising applications in detecting and evaluating the LCFs in LDP. Therefore, a solution to the magnetic field of FBS-ECT for LCF detection in LDP is of great concern to reveal the features of the FBS-ECT signal and the parameters of the LCF. Extending our previous work, the semi-analytic expression of the magnetic flux density for FBS-ECT in regions 1 and 2 (where the magnetic sensor is located) is deduced according to the superposition principle and TREE, the computation accuracy is validated by numerical simulation; next, a semi-analytic solution to the magnetic field of FBS-ECT for LCF in LDP is proposed; then, the sampling distance in FBS-ECT is optimized by considering the magnitude of △Bz and the sensitivity of △Bz with the LCF depth; finally, a case study is carried out to verify the optimal strategy and find the mapping relationship between the radius/depth and the FBS-ECT signal. The proposed semi-analytic solution for the magnetic field of FBS-ECT is not only helpful to understand the theoretical relationship of the magnetic field and LCFs with higher computation efficiency but also lays a theoretical foundation to promote FBS-ECT to apply in the characterization of other flaws in metal components.
Keywords
Introduction
Large diameter pipelines (LDPs), whose diameter is larger than 600 mm, generally used in oil, natural gas, water hydrogen as well as carbon dioxide transportation, and the local corrosion flaws (LCFs) are widespread in LDPs. 1 For example, in the steam pipelines in nuclear power plants and oil/gas pipelines in petroleum plants, LCFs are one of the major cracks caused by environmental corrosion, flow accelerated corrosion, and liquid droplet impingement,2,3 especially, the corrosions in welded joints. 4 LCFs pose a great threat to the safe usage of the equipment and even affect the residual life of the equipment. To ensure the integrity of the above equipment, in-service inspection (ISI) is mandated to evaluate the LCFs.5,6
The LCFs in pipelines are usually expressed by the changing local thickness. The eddy current technique (ECT) is verified as an effective approach to capture this change, and many scholars have made important contributions. In 1968, Dodd and Deeds 7 presented the solutions for a coil above a semi-infinite conducting slab with a plane surface which is covered with a uniform layer of another conductor. Following that, Li et al. 8 and Fan et al. 9 derived an analytical expression for the magnetic field for multilayered specimens and proposed a relationship between the thickness of the specimen and the magnetic field. Zhao et al. 10 studied the influencing factors on the resolution of coil sensors and experimentally demonstrated the feasibility of nano-metallic film thickness measurements using ECT. Yu et al.11,12 proposed the coating thickness measurement approach and conductivity measurement by the traditional eddy current technology (ECT) and dual-frequency ECT for conductive coatings.
Compared with ECT, pulsed ECT (PECT) is excited by a pulse signal, which has rich frequency domain information. Therefore, PECT also made beneficial work for LCFs. For instance, PECT is applied to detect the coating thickness and electronic conductivity with different excitation frequencies 13 ; Xie et al. 14 developed a fast numerical solver for the simulation of PECT signals caused by volumetric defects and proposed a hybrid inverse analysis method to size corrosion defects. 6 Similarly, Cheng 15 designed a new excitation coil with a relatively small footprint and proposed an algorithm based on convolution and deconvolution operations to evaluate local wall thinning. PECT is excited by a square wave signal in practice, and energy wasting due to the dispersion phenomenon of the higher frequencies in the spectrum of the time function is a serious and unavoidable malpractice.
To effectively utilize the electromagnetic energy, frequency-band-selecting eddy current testing (FBS-ECT) is proposed for the detection of a certain depth range of flaws. 16 FBS-ECT has equally distributed spectral components in a limited frequency band and can effectively utilize electromagnetic energy. 17 Therefore, it has higher detection sensitivity, more controllability, and more specificity for flaw detection in a known depth range. 18 These advantages make it a promising ECT technique to quantify LCFs in pipelines. However, research on FBS-ECT is limited. It is urgent to investigate the analytic solution to the magnetic field of FBS-ECT to understand the features of FBS-ECT and promote its application in engineering.
In terms of the analytic modeling for ECT, based on the great contributions of Dodd and Deeds 7 as well as Theodoulidis et al. 19 studied the eddy current induction problem in a half-space conductor with a vertical borehole and presented a solution based on modal techniques; Zhang et al. 20 and Hao et al. 21 presented the approximate solution of PECT for a steel plate with a flat-bottom hole by using the TREE method; Tytko et al. 22 proposed an analytical model of a probe placed above a two-layered conductive material with a surface hole. Our group derived the analytic solutions to the magnetic field for ECT with a non-through hole 23 and the semi-analytic solutions to the magnetic field for ECT with a slit defect. 24
However, for FBS-ECT, there is no analytical expression to reveal the features of FBS-ECT in different application cases. Therefore, the one motivation of this article is to deduce the semi-analytic solution to the magnetic field of FBS-ECT with an LCF in an LDP and compute approximately the magnetic field by series expansion using the TREE method, which can not only lay the theoretical fundamental knowledge but also promote the FBS-ECT to be applied in practice. The other motivation is to propose the optimization strategy to optimize the sampling distance of FBS-ECT and realize the optimal performances of FBS-ECT in the application. The remainder of the article is arranged as follows. The FBS-ECT technique and its mathematical model are described in the “FBS-ECT and mathematical model for LCF in LDP” section; in the “Semi-analytic solutions to the magnetic field of FBS-ECT for LCF in LDP” section, an LCF is simulated by a cylindrical corrosion flaw with different radii and depths, and the analytical solution to the magnetic field for FBS-ECT is deduced and approximately computed by extending our previous work. Then, the optimal sampling distance of FBS-ECT is determined by considering the sensitivity and magnetic field magnitude for the LCF based on the proposed semi-analytical solution in the “Optimization sampling distance” section; and some conclusions are drawn in the “Conclusions” section.
FBS-ECT and mathematical model for LCF in LDP
Frequency-band-selecting ECT
Similar to traditional ECT 13 and PECT, 14 FBS-ECT can detect defects or damage in metal structures according to the electromagnetic induction principle. However, compared with ECT, the excitation signal is composed of several harmonic waves with different frequencies; compared with PEC, the bandwidth is optimized to cover a certain penetration depth range as well as sampling density in the spectrum.
For example, when the excitation frequency is 1 Hz of the pulse signal and the sampling distance △f of the FBS-ECT is 200 Hz, the excitation signal of PEC and that of FBS-ECT in the time and frequency domain are shown in Figure 1.

The features in the time and frequency domains for PECT and FBS-ECT. (a) PECT and (b) FBS-ECT (△ƒ = 200 Hz).
Comparing Figure 1(b) with Figure 1(a), the obvious feature of the FBS-ECT is an improvement in the excitation signal. The major electromagnetic energy of the excitation signal of FBS-ECT is concentrated into the effective frequency range, which ensures the concentration of energy and avoids the dispersion effect. 16 In general, the frequency range of the excitation signal of FBS-ECT can be obtained by the following steps:
Step 1: Determine the frequency band range. According to the electromagnetic properties of the pipeline (e.g. electronic conductivity and magnetic permeability), the frequency band range [f1, f2] of the excitation signal of FBS-ECT can be determined according to equations (1) and (2)


In equations (1) and (2), d1 and dn are the minimal LCF depth and the maximal LCF depth, respectively, which ensures the respective LCF depths are within the given penetration depths of the frequencies, in practice, d1 and dn can be determined according to the historic data; μ and σ are the magnetic permeability and the electrical conductivity of the LDP, respectively.
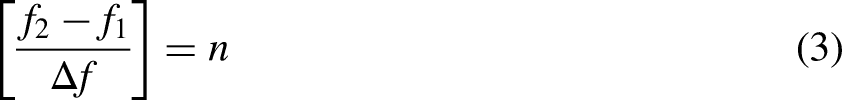
Step 2: Determine the sampling distance △f. It should satisfy equation (3)
Step 3: Determine the amplitude of harmonic components of FBS-ECT. The amplitude of each harmonic component is assumed to be equal and can be obtained according to the energy conservation with the corresponding PECT signal.
Step 4: Determine the expression of harmonic components of FBS-ECT. Assuming that the phase at each harmonic frequency is zero, we can obtain the kth harmonic components of FBS-ECT in the time domain as equation (4)

Mathematical model for LCF detection in LDP
Figure 2(a) shows an FBS-ECT probe outside an LDP with an LCF. As can be seen the LDP with an LCF is a multilayer structure and the LCF in the LDP cause discontinuous in electromagnetic parameters. For LCP, since the radius of the LDP is much larger than the radius of the FBS-ECT probe, the lift-off noise due to the curved surface of the pipeline is neglected. Therefore, in this article, the case in which an FBS-ECT coil is placed above a planar multilayered structure along the ρ direction with an LCF is considered, whose mathematic model is described in Figure 2(b).

The mathematical model for a pipeline with an LCF for FBS-ECT. (a) An FBS-ECT probe outside LDP and (b) a mathematical model.
In Figure 2, a cylindrical corrosion flaw with a radius of c and depth of l simulates the corresponding LCF, and the conductive pipeline is assumed to be linear, isotropic, and homogeneous. As shown in Figure 2, the cylindrical coil is placed between the horizontal surface of z = z1 and z = z2. When the excitation current I(t) flows in the coil, a magnetic field B1 will be generated around the coil. Due to the law of electromagnetic induction, the eddy current will be generated in LDP, and the eddy current is disturbed by the LCF. Correspondingly, a magnetic field B2 due to the eddy current will be generated, and the resultant magnetic field of B1 and B2 carries the LCF information. The other geometric and electromagnetic parameters in Figure 2 are shown in Table 1.
Geometric and electromagnetic parameters.

Based on the multilayer structure shown in Figure 2, a cylindrical coordinate system O ρ–φ–z is established. For ease of solving the problem, the solution domain is divided into six regions along the z-direction depending on the materials, which are shown in Figure 2(b). Region 1, region 2, regions 1 and 2, and region 5 are the air domain, region 4 is the conductor domain, region 3 is the mixture domain of air and conductor, and the magnetic sensor (such as the hall, giant magnetoresistance, tunneling magnetoresistance sensor) is often located in regions 1 and 2 to detect the magnetic field in practice.
Semi-analytic solutions to the magnetic field of FBS-ECT for LCF in LDP
The magnetic vector potential in regions 1 and 2 for a cylindrical coil
In our previous work, the magnetic vector potential A in different regions for a cylindrical coil with a rectangular cross-section was deduced by Yu et al. 23 Extending the previous work, the magnetic vector potential in regions 1 and 2 is computed as follows.
According to the superposition principle, the magnetic field at any point z in regions 1 and 2 (z1 < z < z2) for a cylindrical coil can be deemed the sum of the magnetic field in the region of [z2, z], and the magnetic field in the region of [z, z1]. Therefore, for the single coil, to calculate the magnetic field at the coil, we can replace z with z1 in equation (5) for the magnetic field in region 1 and replace z with z2 in equations (6) and (7) for the magnetic field in regions 1 and 2 and obtain equations (8) to (10). You can find the detailed description for equations (5) to (7) by Yu et al.
23


Finally, the z-component of the magnetic flux intensity Bz can be calculated by equation (23)
Verification by numerical simulation
To identify the calculating accuracy and efficiency of the semi-analytic expression for the magnetic field in regions 1 and 2 shown in equation (23), a two-dimensional finite element (FE) model is set up according to the modeling strategies studied by Yu et al.
25
The geometric and electromagnetic parameters in the FE model are listed in Table 1. An excitation current I(t) in the coil is a harmonic signal, which is expressed as


Comparison between finite element method (FEM) and semi-analytical solution with different depths. (a) l = 0 mm, (b) l = 2 mm, (c) l = 6 mm, and (d) l = 10 mm.
Comparison of semi-analytical calculation and the numerical simulation.
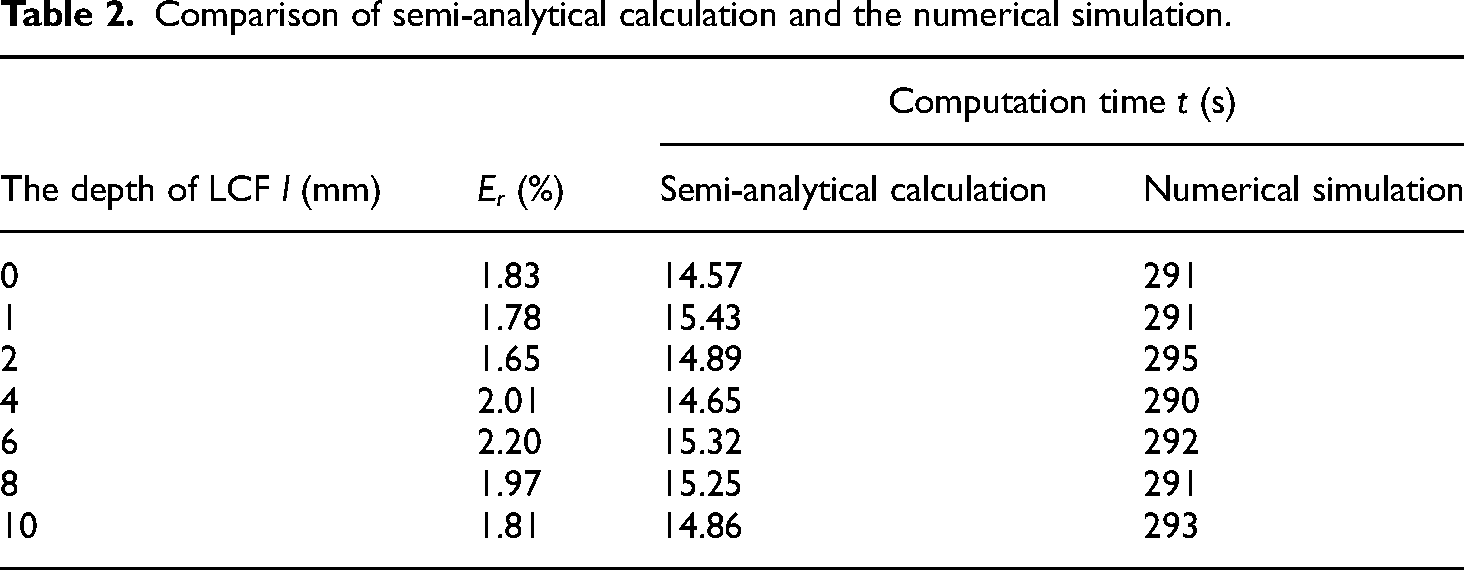
As shown in Figure 3, the deeper the LCF in LDP, the peak value of the weaker the Bz. As shown in Table 2, the relative error is < 2.20%, while the calculation time of the analytical computation is ∼ 1/20 of the numerical simulation. Generally, the time for the FE modeling occupies > 70% of the total numerical simulation, therefore, the computation efficiency is increased 40–50 times.
Semi-analytic solution to the magnetic field of FBS-ECT for LCF in LDP
The excitation signal for FBS-ECT is composed of several harmonic signals with the same amplitude. Therefore, the magnetic field of FBS-ECT for LCF detection can be deemed as the superposition of the magnetic field under these harmonic excitation signals described in the “Verification by numerical simulation” section. Therefore, the magnetic flux density detected by the magnetic sensor Bz can be expressed as
Therefore, the calculation approach of equation (27) to the magnetic field of FBS-ECT is described in Figure 4.

The calculation flowchart of the magnetic field of frequency-band-selecting eddy current testing (FBS-ECT).
Optimization sampling distance
The approach for optimizing sampling distance
According to Figure 1, we can see that the number of harmonic components depends on the sampling distance △f; therefore, it is necessary to optimize the sampling distance when the minimal depth and maximal depth are determined.
The peak value of the differential pickup signal △Bz (the difference between the detection signal when there is an LCF Bz and the standard signal when there is no flaw Bz0) of the magnetic field is generally applied as the characteristic signal in PECT.26–28 To obtain the optimal sampling distance of FBS-ECT, two key factors need to be considered: the magnitude of △Bz and the LCF detection sensitivity. In this article, the LCF detection sensitivity is denoted by the slope of the relationship between △Bz and the LCF depth. Therefore, an approach to optimize the sampling distance is proposed and shown in Figure 5.

Flowchart for optimizing the sampling distance.
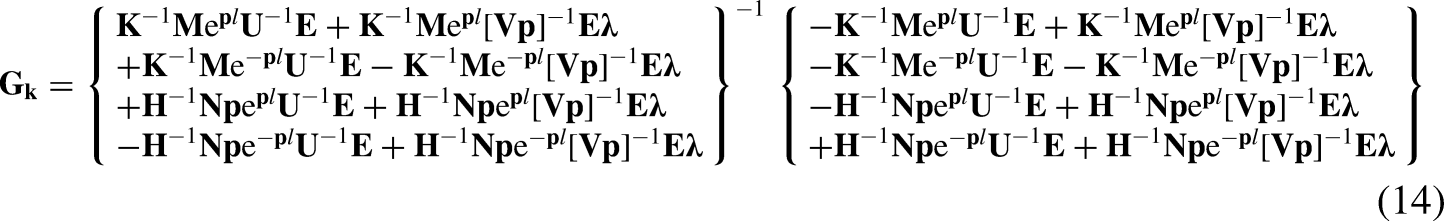
In Figure 5, the matrix
According to Figure 5, first, we can obtain the magnitude of △Bz for different sampling distances Δfp for each LCF depth; therefore, we can obtain the corresponding Δf for the maximal △Bz and denote it as Δfo1. Then, for the different LCF depths, we can obtain the △Bz for the different LCF depths dq for each sampling distance and obtain the relationship between △Bz and LCF depth, following which we obtain the maximal slope of the linear relationship between △Bz and LCF depth and output the corresponding sampling distance denoted as Δfo2. Finally, if Δfo2 is equal to Δfo1, we denote the optimal sampling distance Δfo = Δfo1 = Δfo2; if not, we will refine the initial value of Δfp by m = m + 1, until the condition that Δfo1 = Δfo2 is satisfied.
Case study
Previous research 28 discovered that the PECT is capable of detecting flaws deeper than 0.15 mm; therefore, in this case study, we assumed that the LCF depth in the LDP varies in the range of 0.15–10 mm. According to the values of the geometric parameters and the electromagnetic parameters shown in Table 1, we can calculate f1 = 3 Hz and f2 = 803 Hz; therefore, the excitation frequency band is determined to be [3 Hz, 803 Hz].
When m = 2, we can obtain Δf = [50, 100, 200, 400]. When

The influence of sampling distance Δf and local corrosion flaw (LCF) depth d on △Bz. (a) Δf∼△Bz and (b) d∼△Bz.
Then, we also obtain the relationship of △Bz and LCF depth
In this case, when the optimal frequency interval is 200 Hz and the LCF depth is 10 mm, we also investigated the relationship between the LCF radius and △Bz, which is shown in Figure 7. As shown in Figure 7, the radius has an obvious influence on the magnetic field of FBS-ECT in the time domain, and the peak value increases approximately linearly with the LCF radius. Therefore, the radius and depth of the LCF can be readily characterized by the peak value of △Bz.
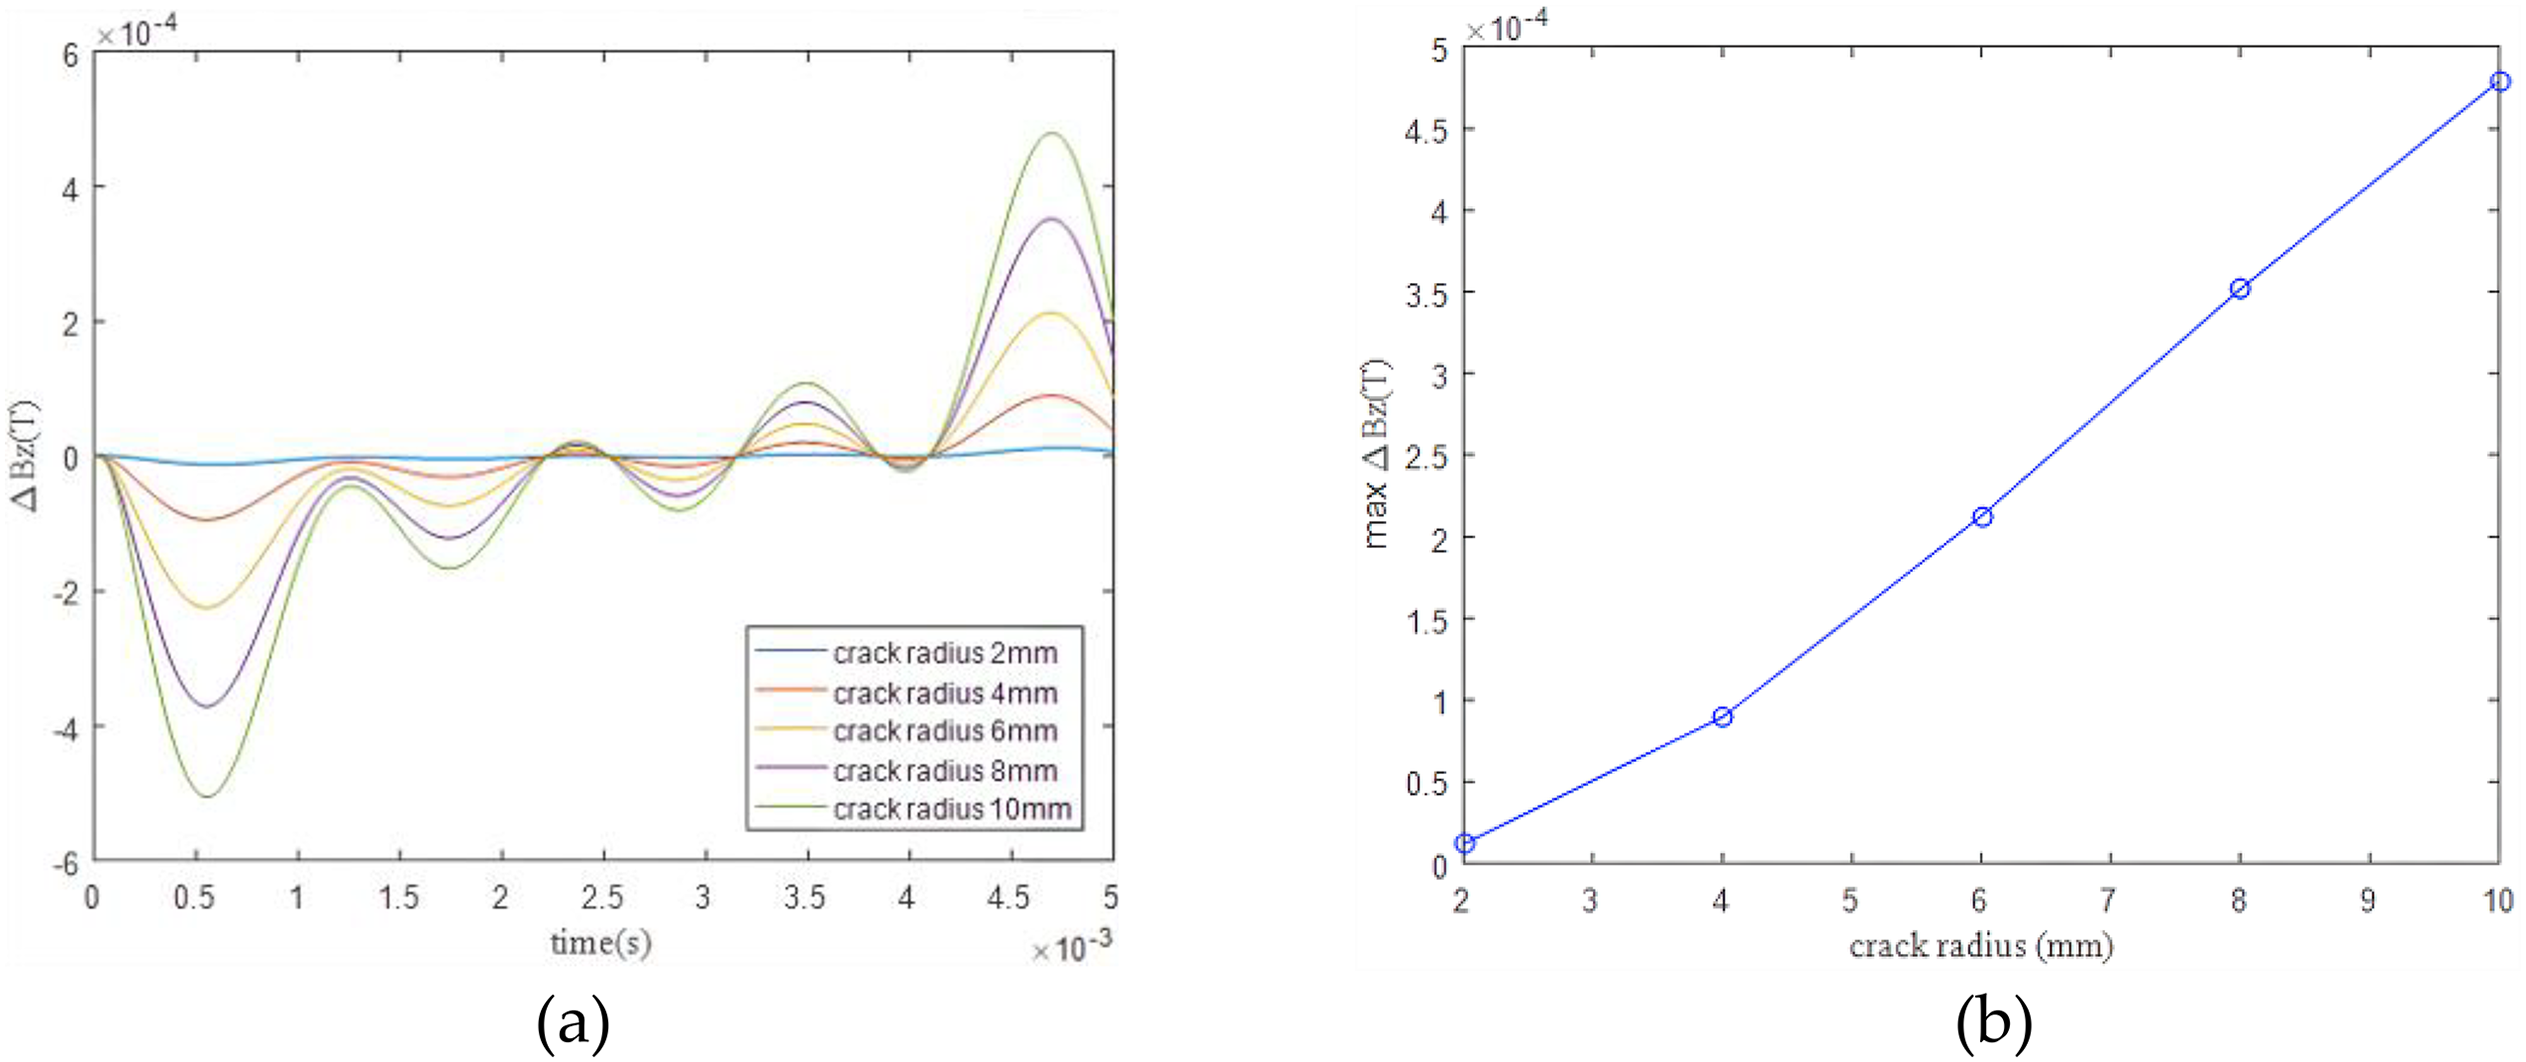
The influence of the LCF radius on the △Bz of FBS-ECT. (a) △Bz in the time domain and (b) the peak value of △Bz.
Conclusions
In this article, a semi-analytical solution is proposed to address a forward problem of FBS-ECT for the characterization of the LCFs in LDP. The FBS-ECT technique and the mathematical model are described. Then, the analytic expression for the magnetic flux density in the coil region (regions 1 and 2) for ECT is deduced and verified by numerical simulation by FEM, and then the semi-analytic expression for the magnetic flux density is proposed for FBS-ECT based on the superposition principle because the excitation signal of FBS-ECT is composed of several harmonic signals with the same amplitude. Finally, an approach to optimize the sampling distance △f of FBS-ECT is proposed by considering the magnitude of △Bz as well as the sensitivity of △Bz and the LCF depth according to the semi-analytic expression of FBS-ECT. As a case study, the proposed semi-analytical solution seeks the optimal sampling distance and investigates the relationship of the LCF depth and radius on the peak value of △Bz in FBS-ECT. Some conclusions are summarized as follows:
The magnetic vector potential in 1 and 2 regions (where the magnetic sensor is located in application) in FBS-ECT mathematical model is deduced. Compared with the numerical simulation results, the computation errors are smaller than 2.20%, while the computation time is reduced to 1/20. The semi-analytic approach for the magnetic field in FBS-ECT can save more computation time with reasonable computation accuracy. The sampling distance is optimized by considering the strength and the sensitivity of the signal of FBS-ECT to the LCF in LDP. The case study verified the optimal strategy and indicated that the FBS-ECT with the optimal sampling distance not only has a stronger signal but also is more sensitive to the radius and depth of LCFs in LDP. The mapping relationship between the radius and △Bz as well as that between the depth and △Bz of FBS-ECT are finding out under the optimal sampling distance. This approach can be extended to the other material (with different electric conductivity and magnetic permeability) of the steel LDP.
Therefore, the analytic solution for FBS-ECT can not only investigate the quantitative relationship between the depth and radius of LCFs and the detection signal in LDP, but also lay the foundations to utilize FBS-ECT to characterize other flaws (such as fatigue rolling contact defects, slits, and holes) in other structures such as rail tracks, oil/gas/steam pipelines, and steel bridges. In the future, more efforts can be carried out to deduce the magnetic field with the natural local corrosion crack in theoretically; and to investigate the performances of the FBS-ECT in detecting the LCFs in LDP, such as the repeatability, the detection range in depth and radius of LCF, and so on.
Footnotes
Abbreviation list
Author contributions
Conceptualization, Kuan Fu, Pengchao Chen, RuiLi, Yating Yu, and Cheng Sun; methodology, Yating Yu; software, Kuan Fu, Yiming Fan; validation, Wei Wang, Bowen Liu; investigation, Yiming Fan, Wei Wang, Bowen Liu; original draft preparation, Yating Yu; writing—review and editing, all authors. All authors have read and agreed to the published version of the manuscript.
Declaration of conflicting interests
The author(s) declared no potential conflicts of interest with respect to the research, authorship, and/or publication of this article.
Funding
The author(s) disclosed receipt of the following financial support for the research, authorship, and/or publication of this article: This research was funded by the Science and Technology Research Project of Pipechina grant number, WZXGL202104; and by the National Natural Science Foundation of China, grant numbers 52275522, 61960206010; and by the Natural Science Foundation of Sichuan province, grant number 2022NSFSC032.
Data availability statement
Not applicable.