
Abstract
As a low-carbon and cost-effective clean energy source, natural gas plays an important role in achieving China's “Dual Carbon” target. In this article, a new three-parameter discrete grey prediction model is used to simulate and forecast the production and consumption of natural gas in China from the perspective of background value optimization. Then the minimum mean absolute percentage error as the objective function from the perspective of fractional order cumulative generation in the real number field. Last, a fractional order in the real number field three parameter discrete grey prediction model TDGM(1,1,z,r(R)) is constructed under the condition of optimal background value. Then we use the model to simulate and predict China's Natural Gas External Dependence (NGED) under the “Dual Carbon” target. The results show that the performance of the new model is better than that of the traditional model GM(1,1) and DGM(1,1), thus proving the practicability and effectiveness of the new model. Put forward relevant policy suggestions according to the prediction results of China's NGED, and provide decision-making reference for the Chinese government to achieve the “Dual Carbon” goals.
Keywords
Introduction
Under the “Dual Carbon” goals, natural gas, as a low-carbon, stable, reliable, cost-effective clean energy, plays an important role that cannot be ignored. China is a large country in global natural gas demand and production. Since joining the WTO, China's natural gas production has increased from 585 × 108 M3 in 2006 to 2075 × 108 M3 in 2021, with an average annual growth rate of 15.9%. In the same period, China's natural gas consumption increased from 561 × 108 M3 to 3726 × 108 M3, with an average annual growth rate of 35.3%. China's gas consumption is growing at a much faster rate than its production. By 2021, China becomes the world's largest importer of natural gas, and its external dependence on natural gas is accelerating. Natural gas external dependence (NGED) is a measure of a country's dependence on foreign gas resources and reflects a country's ability to secure gas supplies. It has two calculation methods. One is the proportion of a country's net natural gas imports to its total domestic consumption; the other is the proportion of the gap between domestic natural gas supply and demand in the total domestic consumption of the country. Considering that the net import of natural gas is not completely consistent with the domestic demand gap, and the NGED mainly depends on the production and consumption of natural gas. Therefore, the second calculation method is selected in this paper. Scientific and accurate prediction is the basis of decision-making. The calculation of NGED and the implementation of macro-regulation based on the results of China's natural gas production and consumption forecasts are of great practical importance for China to achieve its “Dual Carbon” target and achieve energy security.
There have been a few studies on the role of natural gas in China's “carbon neutrality” and trends in production and sales, which are generally divided into four aspects:
First, the role of natural gas in “carbon neutrality.” Zhang et al. 1 predicted that natural gas consumption would reach a peak around 2035 based on the China Global Energy Model (C-GEM), accounting for 14% of primary energy consumption, and about 800 million tons of standard coal. Zhu et al. 2 believed that natural gas played three major roles in the process of “carbon neutrality,” namely, peak shaving, replacing high carbon and high pollution fuels, and boosting the large-scale development of hydrogen energy. Zhong et al. 3 emphasized that whether natural gas could play a key role in China's energy transformation depends on its effectiveness in controlling and reducing methane emissions. Second, research and judgment on China's natural gas consumption under the “dual carbon” target. Yang and Wu 4 estimated that China's natural gas demand would reach 4800 × 108 M3 by 2025, accounting for 11.5% of total global gas demand, based on China's 2020 consumption of 3604 × 108 M3. Duan et al. 5 projected medium and long-term trends in natural gas consumption under different climate policy conditions based on eight integrated assessment models and concluded that natural gas would account for about 13.6% of primary energy consumption in China in 2060 under 2.0 °C temperature control. Li et al. 6 classified China's natural gas consumption scenarios into various scenarios based on whether carbon neutrality targets were considered or not and gave multiple scenarios of natural gas development and industrial realization paths. Li et al. 7 found that under the “carbon neutrality” target, the share of natural gas consumption in primary energy would continue to rise to 24.7% in 2020, a record high. Ding et al. 8 combined system dynamics (SD) with geographic information systems (GISs) to build an integrated SDGIS model to predict the demand for natural gas in Beijing. Li 9 predicted that China's natural gas demand would enter a peak plateau around 2040 at about 5500 × 108 M3 to 6500 × 108 M3, with an average annual growth rate of more than 2.8% during the period 2020–2040. The demand increment for natural gas mainly came from power generation and industrial fuel, which was used to support the carbon emission reduction action plan of the power and industrial sectors. Third, China's natural gas import forecast is under the “carbon neutrality” target. Chen et al. 10 established an SD model to dynamically forecast China's natural gas storage, transportation, and import demand. Liang et al. 11 calculated the natural gas imports by dynamically predicting the natural gas consumption based on the Monte Carlo simulation dynamic scenario analysis. Xue et al. 12 predicted that China's natural gas would peak in 2035–2040 and that the share of LNG imports in total natural gas imports would further increase if storage and transportation bottlenecks were broken. Xing et al. 13 used model GM(1, N), support vector machine regression (SVR), and convolutional neural network (CNN) to compare the forecast of China's natural gas imports and their errors, and concluded that China's natural gas imports would exceed 2000 × 108 M3 in 2026. Chen et al. 14 discussed natural gas consumption and imports in two scenarios, low and medium carbon prices, and high carbon prices. Under medium and low carbon prices, the demand and import of natural gas would continue to grow for 40 years. Under high carbon prices, natural gas consumption and imports would peak around 2040. Then renewable energy sources would replace natural gas to meet the “carbon neutrality” target. Fourth, in the research on China's NGED, Zhou et al. 15 studied that in 2025 China's production of various types could reach 2500 × 108 M3, while the consumption demand for natural gas would reach 4500 × 108 M3 and imported natural gas would reach 2000 × 108 M3, with an NGED up to 45%. Wang et al. 16 pointed out that China imports 1408 × 108 M3 of natural gas, with NGED reaching 43% in 2020, with incremental imports mainly originating from Russia. Hou et al. 17 and Lu et al. 18 further pointed out that, with the rising external dependence on oil and gas, it was important to actively consider how to safeguard national energy security, control external dependence at a reasonable level, and seize the lead in the energy technology revolution in a low-carbon and green energy revolution.
The above studies show that China's natural gas production, consumption, and external dependence are influenced by many factors, such as regulatory policies, market prices, alternative energy sources, industrialization, urbanization, forms of exploration, etc. (grey factors). Production and consumption since 2006 reflect the NGED (white results). Although all of them show a growing trend as a whole, they also have certain random characteristics, that is, the “small data, uncertainty” characteristics of the grey system, which is suitable for using the grey method to study such problems. Some scholars established model GM(1,1), 19 combined with rolling mechanism GM(1,1) 20 and fractional GM(1, N) 21 to predict natural gas consumption and production. Other scholars also established model DAGM(1,1) for more big sample data with adjacent accumulation to forecast the natural gas consumption of G20 countries. 22 Because of the uncertainty of statistical data, some scholars established model MGM(1,1,⊗b) 23 for prediction. Considering the seasonal and periodic oscillation of natural gas demand and consumption, scholars discussed and established multiple models for prediction.24–29 The above-related documents are listed in Table 1. The above grey prediction models mostly consider the prediction of China's natural gas production and consumption from the perspective of positive real number fractional order and time cycle. Since the grey theory was put forward in 1982, scholars have continuously studied and improved the predictive model. On the one hand, it was the improvement of accumulation order. Wu et al. 30 first proposed the concept of fractional-order accumulation, which made the weight of new information larger and then improved the prediction accuracy of the model. Liu et al. 31 proposed the concept of reverse accumulation, which reduced the perturbation bound of the discrete grey prediction model solution. Khalil et al. 32 defined conformable fractional derivative, Ma et al. 33 and Wu et al. 34 further proposed the conformable fractional operator, which made the whitening differential equation of the model consistent with the basic form of the model and reduced the model error. Javed et al. 35 further predicted the production and consumption of biofuels, confirming the effect of the model Zeng et al. 36 proposed to combine the accumulation and inverse accumulation operators in the real number field to fully mine the gain information and difference information of the data sequence. On the other hand, optimizing the background value was also effective in improving the accuracy of the model. Madhi et al. 37 reconstructed the background value based on the non-homogeneous exponential law. Tian et al. 38 used the new information priority accumulation method in the grey forecasting model with the hyperbolic sinusoidal driving term to predict the urban natural gas supply. Ma et al. 39 introduced the Simpson formula to optimize the background value. Liu et al. 40 introduced composite integral medium value theory to build variable background values. Li et al.41,42 reconstructed the background value by increasing the parameters used to calculate the number of background values. In this article, the three-parameter discrete grey prediction model is expanded and optimized using the idea of adding the number of background-value and constructing the accumulating generation operator oriented to the real number field in Zeng et al., 36 Li et al. 42 and Li et al., 43 respectively. Based on this, the paper uses a new grey forecasting method to simulate and predict China's natural gas production and consumption. Then the predictive results are compared with those of the traditional grey model. Finally, we use the background value model with high simulation accuracy to calculate the production and consumption of natural gas, respectively, and analyze the NGED in China in the next 9 years, draw relevant conclusions, and put forward suggestions.
Research on the use of the grey model to study the consumption and production of natural gas.

This paper is divided into five sections. Section “Introduction,” which introduces the general situation and literature review of China's natural gas production, consumption, and NGED. Part of “Data preparation” selects and pre-processes statistical data that objectively reflect current patterns and trends in the evolution of natural gas in China. Section “Modeling approach and model validation” introduces the basic form of model TDGM(1,1,z), and the fractional grey generation operator in the real number field is introduced, then TDGM(1,1,z,r(R))is constructed. Part “Results and discussion” is China's natural gas production, consumption, and NGED trend forecast and discussion. The last section is the conclusion.
Data preparation
The rationality and validity of data selection are the basis of the scientific prediction model. Before choosing a quantitative natural gas forecasting model, it is necessary to find statistical data reflecting the current patterns and trends of natural gas consumption and production in China and to calculate the supply and demand gap and NGED. Since China's natural gas import began in 2006, the data for the past 16 years obtained from the Statistical Yearbook are shown in Table 2.
Consumption, production, and gap of natural gas in China 2006–2021. 1 Unit: 108 M3.

NGED: Natural Gas External Dependence.
From Figure 1 according to Table 2, it can be seen that China's natural gas production nearly meet its consumption in 2006, and it has relied on imported natural gas, including LNG, since 2007. The gap between supply and demand increased at this time, and China's NGED showed a gradual upward trend after 2009, remaining above 40% since 2018 and up to 44.29% in 2021.

Consumption, production, and Natural Gas External Dependence (NGED) of natural gas in China 2006–2021.
Modeling approach and model validation
Basic form of model TDGM(1,1,z)
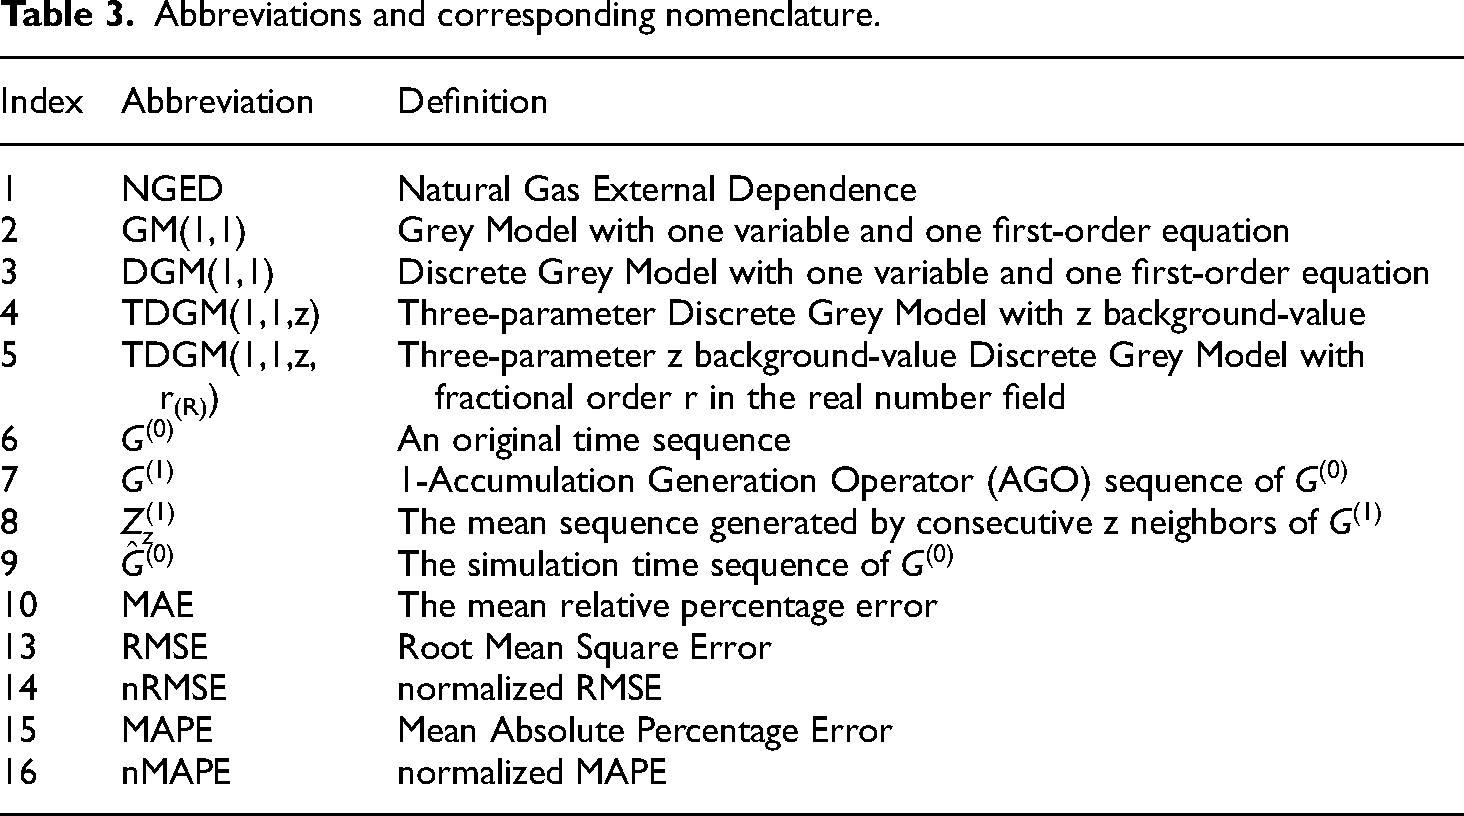
To have a full understanding of notations in this paper, we draw a table as follows (Table 3).
Abbreviations and corresponding nomenclature.
Definition 1
41
: Assume that a non-negative sequence is
Let the sequence
When 
Theorem 1
41
: Let the sequence 
According to the ordinary least-squares (OLS) method, the parameter column satisfies
According to Definition 1, the first-order inverse accumulation generation sequence can be calculated by 


Definition 2
42
: Let the sequence
When 
Equation (5) is a grey system model with one variable, one first-order equation, three background values, and three parameters, denoted as a three-parameter, three-background-value Discrete Grey model, TDGM(1,1,3).
Theorem 2: Let the sequence 
According to the OLS method, the parameter column satisfies
According to equation (2), equation (5) can be transformed as


Definition 3
43
: Let the sequence
When 
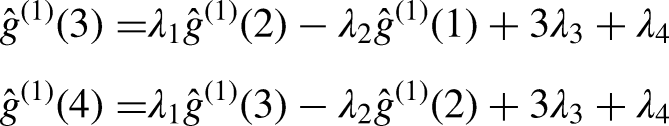
Theorem 3: Let the sequence 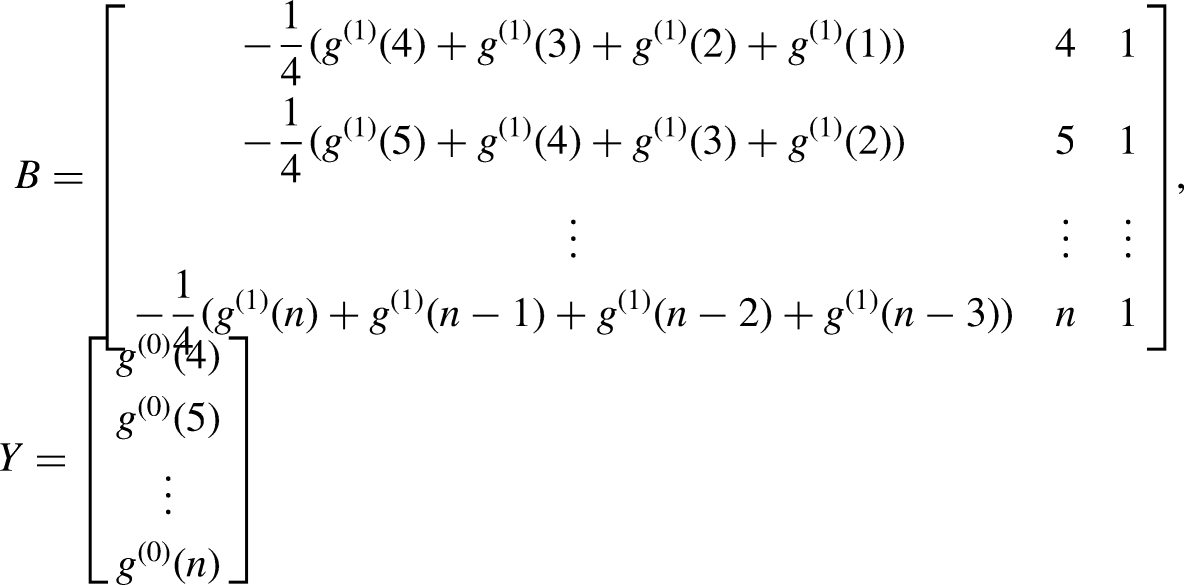
According to the OLS method, the parameter column satisfies
According to equation (2), equation (7) can be transformed as


Comparing the modeling process and effect of TDGM(1,1,z)
We draw Figure 2 according to the above to describe the modeling process of the TDGM (1,1, z) model and compare the simulation effect.

Flowchart of constructing the model three-parameter Discrete Grey Model with z background-value (TDGM(1,1,z)).
Taking China's natural gas consumption and production as the original sequence, the accuracy of the three models is tested by modeling and comparing the errors between the simulation values and the real values. The simulation results of the three models are shown in Tables 4 and 5, and the model accuracy is shown in Figures 3 and 4. We use Matlab2016b software and calculate the error of the model through five indicators: Absolute Percentage Error (APE), Mean Absolute Percentage Error (MAPE), normalized MAPE (nMAPE), Root Mean Square Error (RMSE), and normalized RMSE (nRMSE). The calculation formula is as follows:

Comparison of the results of the three models of natural gas consumption in China.

Comparison of the results of the three models of natural gas production in China.
Comparison of the results of the three models of natural gas consumption in China.

TDGM: Three-parameter Discrete Grey Model; APE: Absolute Percentage Error.
Comparison of the results of the three models of natural gas production in China.

TDGM: Three-parameter Discrete Grey Model; APE: Absolute Percentage Error.
According to the Liews table,
44
we can see that the evaluation error standard is
According to the actual data, after repeated tests on China's natural gas production data, the period from 2006 to 2019 is selected for simulation, and the data from 2020 to 2021 are predicted, as shown in Table 5.
The error table is made according to Tables 4 and 5, as shown in Table 6.
Simulation, prediction, and comprehensive error of three models for consumption and production.
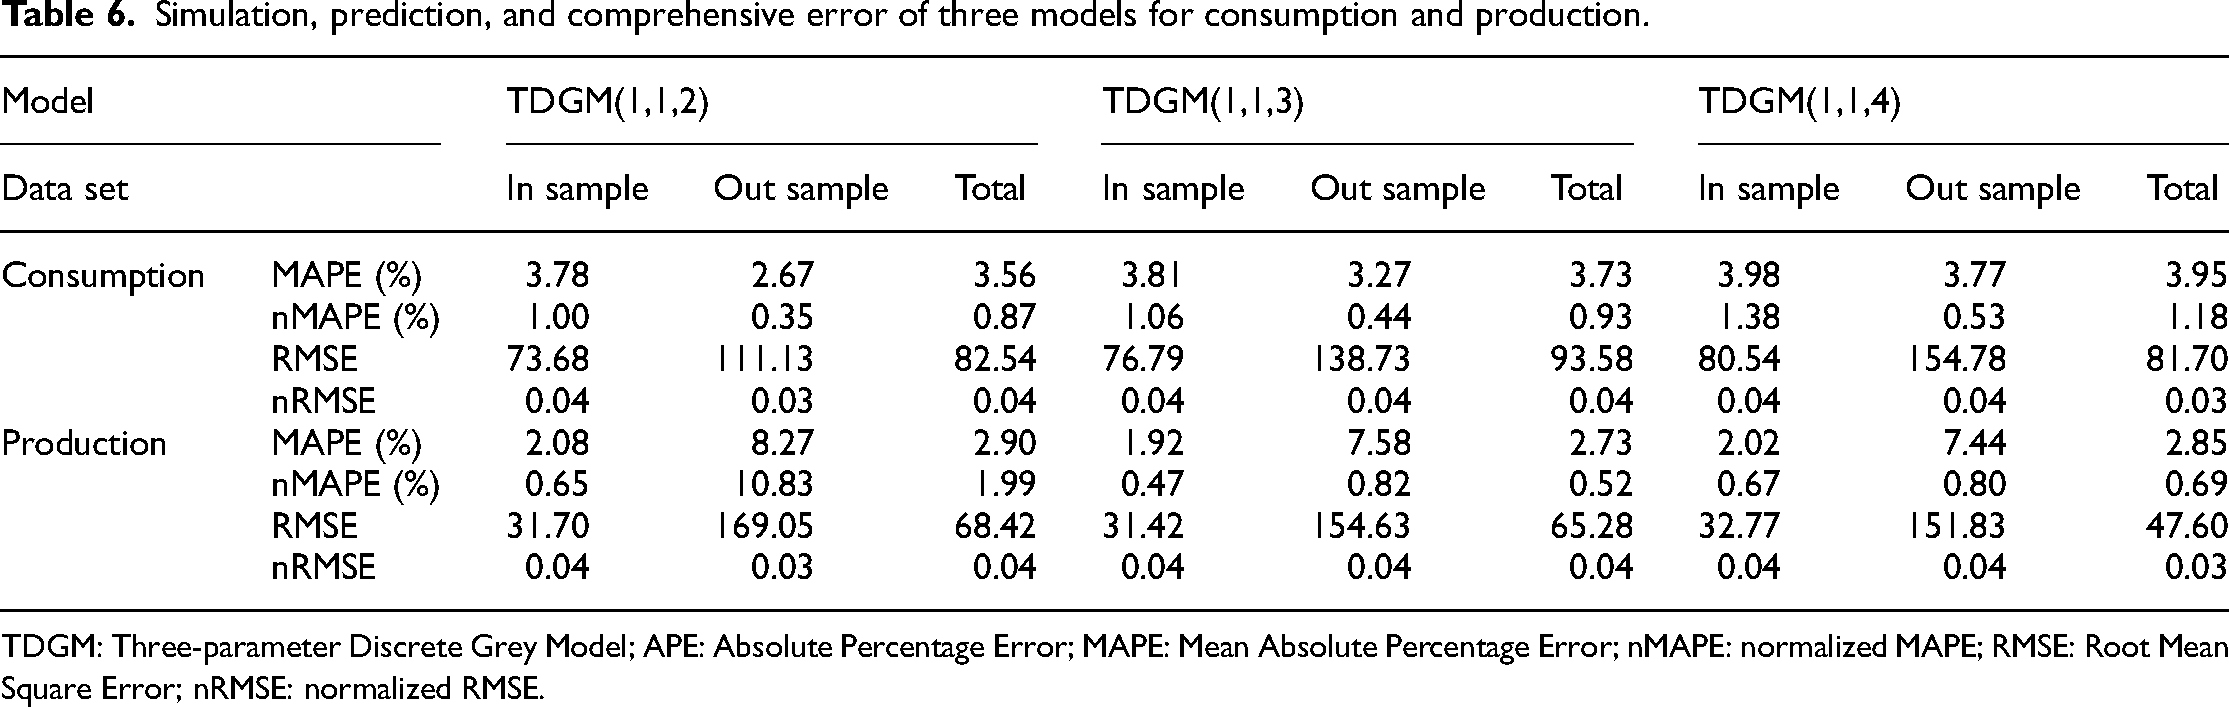
TDGM: Three-parameter Discrete Grey Model; APE: Absolute Percentage Error; MAPE: Mean Absolute Percentage Error; nMAPE: normalized MAPE; RMSE: Root Mean Square Error; nRMSE: normalized RMSE.
Taking APE, MAPE, and nMAPE for example, the comparison chart of model TDGM (1,1,z) accuracy of China's natural gas production and consumption is drawn according to Tables 4 to 6, as shown in Figures 3 to 5.
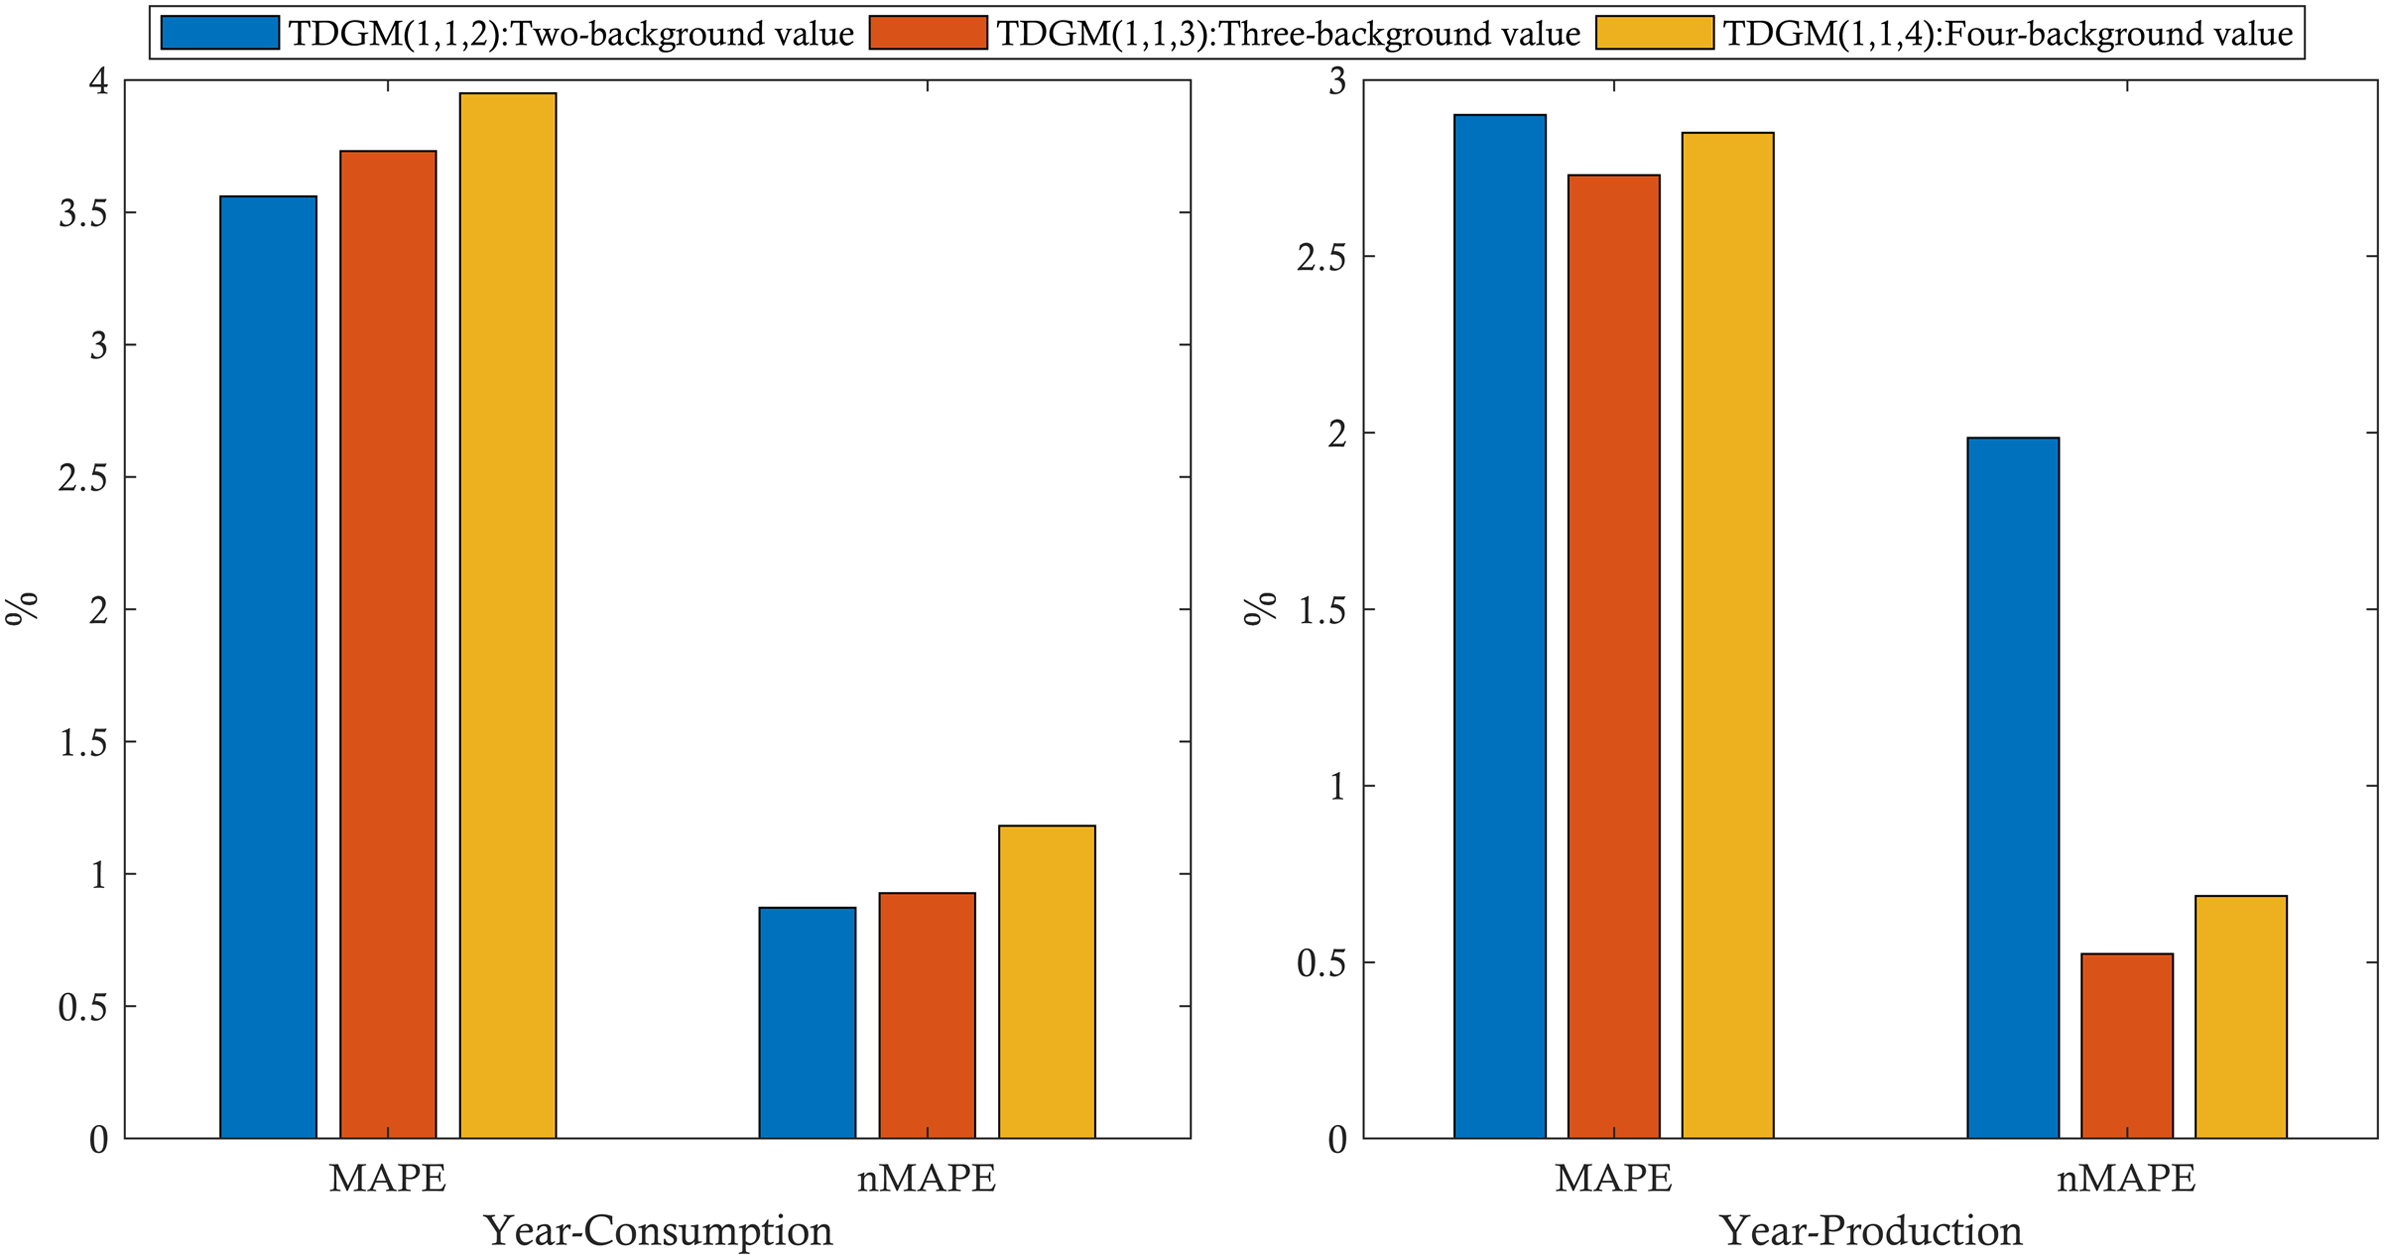
Comparison of the results of the three models of natural gas consumption and production.
It is found that when fitting the data of China's natural gas consumption, the error of the three models is within 10%, which belongs to high precision. More specifically, the accuracy of the three-parameter discrete grey prediction model with a two-background value is the best, the accuracy of the three-background value is the second, and the accuracy of the four-background value is the worst. However, from Table 5 and Figure 4, it is found that when fitting the data of China's natural gas production, the accuracy of the three-parameter discrete grey prediction model with three-background value is the best, the accuracy of the four-background values is the second, and the accuracy of the two-background value is the worst. Therefore, it can be inferred that increasing the number of background values will improve the stability and reliability of the model, but not the more the number of background values, the better. Theoretically, TDGM(1,1,z) starts from the data z, which may affect data characteristics and reduce model accuracy. In conclusion, the proposed three-parameter discrete grey prediction model TDGM(1,1,z) with multiple background values has good structure and stability. The background value model with the best accuracy can be used to predict China's natural gas consumption and production, and calculate China's NGED with higher accuracy.
Optimization model TDGM(1,1,z)
Zeng et al.
36
introduced the parameter
Definition 4
36
: According to Definitions 1 and 2, 
Definition 5: Let the sequence 
When 
Theorem 4: Let the sequence 
According to the OLS method, the parameter column satisfies
Definition 6: Let the sequence 
When 
Theorem 5: Let the sequence 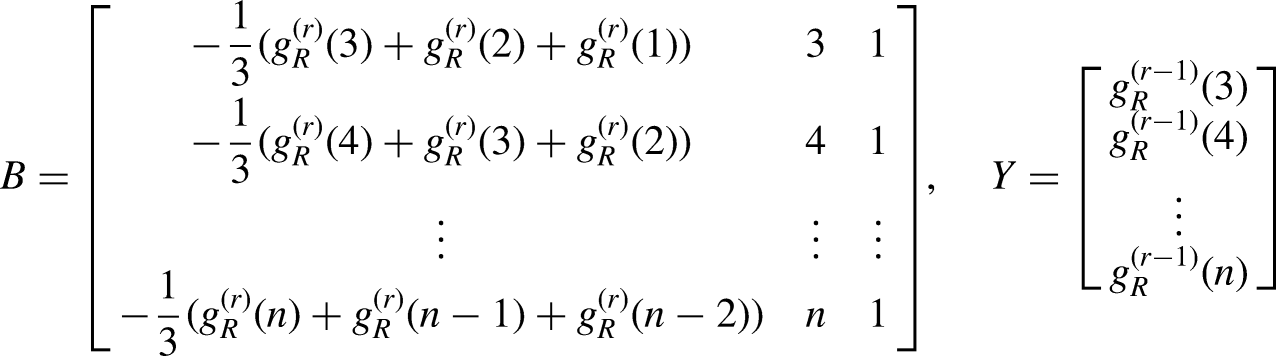
According to the OLS method, the parameter column satisfies
Definition 7: Let the sequence 
When 
Theorem 6: Let the sequence 
According to the OLS method, the parameter column satisfies
Main model and their basic form.

TDGM: Three-parameter Discrete Grey Model.
The time response function of the model TDGM(1,1,z,r(R)) is very complex and it is difficult to identify its evolution. Nonetheless, the main purpose of constructing a model TDGM(1,1,z,r(R)) is to simulate or predict
The optimization process of accumulating order requires a lot of time, which can be solved by optimizing intelligent algorithms, among them, particle swarm optimization (PSO) is a global optimization evolutionary algorithm proposed by Eberhart and Kennedy,
45
its principle is to find the optimal order by iteratively simulating the behavior of birds randomly searching for food. Because the principle of the PSO algorithm is easy to understand, and there is no need to adjust many parameters, it has been widely used in the fields of function optimization and neural network training. Therefore, the optimization result of the TDGM(1,1,z,r(R)) grey generation operator order can be obtained by the PSO algorithm. When 
Results and discussion
Simulation and prediction of China's natural gas consumption and production
According to the modeling mechanism in the text, the flow chart of the model TDGM(1,1,z,r(R)) is summarized, as shown in Figure 6.

Flowchart of constructing the model three-parameter z background-value Discrete Grey Model with fractional order r in the real number field (TDGM(1,1,z,r(R))).
According to Figures 3 to 5, the three-parameter discrete grey prediction model with two-background values (TDGM(1,1,2,r(R)) is used to predict China's natural gas consumption. The data from 2006 to 2018 are selected for simulation, and the data from 2019 to 2021 are used for prediction. And the results are compared with the classical model DGM(1,1) and GM(1,1). The results are shown in Table 8.
Simulation and forecast of natural gas consumption in China.

TDGM: Three-parameter Discrete Grey Model; APE: Absolute Percentage Error; DGM: Discrete Grey Model; GM: Grey Model.
According to Figures 3 to 5, the three-parameter discrete grey prediction model with three-background values (TDGM(1,1,3,r(R)) is used to predict China's natural gas production. The data from 2006 to 2019 are selected for simulation, and the data from 2020 to 2021 are used for prediction, And the results are compared with the classical model GM(1,1) and DGM(1,1). The results are shown in Table 9.
Simulation and forecast of natural gas production in China.

TDGM: Three-parameter Discrete Grey Model; APE: Absolute Percentage Error; DGM: Discrete Grey Model; GM: Grey Model.
The error table is made according to Tables 8 and 9, as shown in Table 10.
Comparison of the simulation, prediction, and comprehensive error of each model.

TDGM: Three-parameter Discrete Grey Model; APE: Absolute Percentage Error; DGM: Discrete Grey Model; GM: Grey Model; MAPE: Mean Absolute Percentage Error; nMAPE: normalized MAPE; RMSE: Root Mean Square Error; nRMSE: normalized RMSE.
Taking APE, MAPE, and nMAPE for example, the precision comparison diagram of the three models is drawn according to Tables 8 to 10, as shown in Figures 7 to 9.

Comparison of the results of the three models of natural gas consumption in China.

Comparison of the results of the three models of natural gas production in China.

Comparison of the results of the three models of natural gas consumption and production.
It can be seen from Tables 8 to 10 that the accuracy of model TDGM(1,1,z,r(R)) is significantly better than model GM(1,1) and DGM(1,1). The error of the three models is within 10%, which belongs to high precision. More specifically, the MAPE of China's natural gas consumption model is 3.54%, and the MAPE of the production model is 2.50%, and the new model can be used for medium and long-term prediction.
Results
As an efficient, safe, and economical clean energy, natural gas plays an important role in the process of urbanization and industrialization in China. However, there is a huge gap between China's local natural gas consumption and production, which has led to the fact that China's NGED has remained above 40% in recent years. NGED has a great impact on a country's energy security and strategy. NGED is mainly determined by consumption and production. Therefore, this paper forecasts the production and consumption of natural gas in China from a macro perspective, thus reflecting the NGED.
According to the prediction of model TDGM(1,1,z,r(R)), the results of China's natural gas consumption and production in the next 9 years are shown in Table 11. China's natural gas consumption and production in 2030 will be 7277.9 × 108 M3 and 2945.6 × 108 M3, respectively.
Forecasting natural gas consumption, production, and NGED in China from 2022 to 2030. Unit: 100 M3.

NGED: Natural Gas External Dependence.
Discussion
The Energy Production and Consumption Revolution Strategy (2016–2030) proposes that the share of natural gas consumption in total primary energy consumption should reach about 15% in 2030, so China's natural gas consumption should reach about 6700 × 108 M3 in 2030. According to the prediction results of this model, the consumption in 2030 will be 7277.9 × 108 M3, with an average annual growth rate of 7.73% in the next nine years, which can meet the requirements. Therefore, it is necessary to guarantee the supply of natural gas through multiple channels and continuously increase the proportion of natural gas in China's primary energy consumption structure. At the “Second High-end Seminar on China's Oil and Gas Resources Development Strategy,” it was suggested that China should control its NGED within 50% by 2035 so that China's natural gas production in 2035 should be at least 3638.95 × 108 M3. And based on this paper's forecast of 2945.6 × 108 M3 of natural gas production in 2030, at least 693.35 × 10⁸ M3 of additional natural gas production will be required in the following five years. According to the prediction results of the model, China's NGED will be 59.53% in 2030, and the average annual growth rate of China's NGED in the next decade will be 3.35%. And according to the trend as well as the available supply capacity, there is still a large gap in supply and the task of importing natural gas is daunting.
The demand for natural gas in China is on a medium to a long-term upward trend in line with the ecological protection of the environment and the industrial change in the energy mix. While domestic gas production is not growing at the same rate as gas consumption. NGED shows an increasing trend year by year. To keep NGED within a reasonable range, both supply and demand can be considered. Based on the prediction results, the following suggestions are proposed:
First, in the “carbon peak” stage, we will continue to promote the replacement of high-carbon fuels with natural gas in industries, urban gas, transportation, and other fields, and support China's overall green transformation of economic and social development. Clarify the key supporting role of natural gas power generation in building a new power system, encourage the development of gas and electricity that cooperate with the flexible operation of renewable energy, and support oil and gas enterprises to use the advantages of natural gas resources, land resources, and underground reservoir space to develop the construction of “wind and solar gas (hydrogen) storage” new energy base. Establish energy conservation awareness, improve the utilization rate of downstream terminals, and reduce the loss rate in the process of natural gas transportation. Improve the utilization rate of natural gas in downstream terminals such as industry, residents, power generation, and chemical industry, and optimize the use and configuration of natural gas through technology and management. Strengthen infrastructure construction, production, transportation, storage, and marketing systems to reduce losses.
Secondly, increase investment in funds, policies, subsidies, and technology at the upstream production end, and expand channels to increase production and other benefits. Provide strong support in terms of policies and funds, solve technical constraints, strengthen the detection, development, and recovery of conventional gas, deep onshore, deep ocean, and unconventional natural gas; and increase underground gas storage. And for the governance of the developed gas fields, increase the mining intensity, and improve the recovery rate. Accelerate the commercialization of medium and deep coal underground gasification and natural gas hydrate development at the national level. Strengthen scientific and technological research and innovation drive, continue to increase research in exploration and development and other fields, and integrate and optimize the allocation of scientific and technological resources. Establish a national scientific research platform and build a cooperation mechanism with complementary advantages for enterprises and universities. Promote breakthroughs in basic theory, core technology, equipment, etc.
Thirdly, diversify the risk of external dependence on energy. Import LNG through multiple channels. Further, optimize the allocation of the national import resource pool and build a stable, diversified, flexible, and resilient import natural gas supply system. Strengthen intergovernmental cooperation, promote the sharing of infrastructure such as LNG terminals in Northeast Asia, strengthen information sharing among countries, enhance market liquidity and information transparency, and effectively improve regional energy security. At the same time integrate with renewable energy (such as wind energy, electric energy, solar energy, etc.) to seek breakthroughs in downstream terminals such as industry, residents, power generation, and chemical industry. And develop and increase renewable energy to save natural gas, and complete the effective replacement of energy.
Conclusion
Under the goal of “carbon neutrality,” natural gas as the cleanest petrochemical energy, plays an important role in China's industrialization process and energy structure transformation. This paper combines the idea of a grey accumulating generation operator in the real number field, considers the number of optimal background-value of the three-parameter discrete grey model, and establishes model TDGM(1,1,z,r(R)) with simultaneous optimization of order and background values. Then predict China's natural gas external dependence under the background of Dual Carbon. However, by improving the background-value sequence of the grey model, the disturbance degree of the extreme value to the stability of the original sequence is reduced, and the initial value will be changed at the same time. As the number of background-value and initial values are increased, the modeling data is compressed. As a result, the higher the background value, the better the accuracy of the simulation data. However, sometimes more data are used to generate the background value, and the model accuracy will be effectively improved. We use TDGM (1,1,z,r(R)) model to simulate and forecast China's natural gas consumption, production, and NGED, and obtain the development trend of China's NGED in the next 9 years, which is of great significance for China's energy security and the completion of the “carbon peak” goal. Because of the increase in the number of background values and initial values, the modeling data is compressed. The results show that China's natural gas consumption and production in 2030 will be 7277.9 × 108 M3 and 2945.6 × 108 M3, respectively, with an NGED of 59.53%. According to the results, China's natural gas external dependence will increase year by year, and it will reach 60% in 2030. This is a threat to China's energy security and industrialization process, for which China's energy sector should consider taking action from both supply and demand. If the NGED is to be controlled within 50% by 2035, China's natural gas production in 2035 should be at least 3638.95 × 108 M3. This paper indicates that it is necessary to increase natural gas production by at least 693.35 × 10⁸ M3 within 5 years after 2030 or to develop renewable energy sources to replace imported gas making sure that China's “carbon neutrality” target is successfully met by 2060.
In fact, for the three-parameter discrete grey model, the more the number of background values, the better the performance of the model will not work. Our paper proves this by constructing a new grey prediction model and applying it to predict China's natural gas external dependence. How to determine the optimal number of background-value is the main content to be studied in the next step.
Footnotes
Acknowledgements
Sincere thanks to the editors and anonymous reviewers for their insightful comments and suggestions to improve the paper.
Data availability
The data used to support the findings of this study are available from the corresponding Website.
Declaration of conflicting interests
The author(s) declared no potential conflicts of interest with respect to the research, authorship, and/or publication of this article.
Funding
The author(s) disclosed receipt of the following financial support for the research, authorship, and/or publication of this article: This work was supported by the Chongqing Natural Science Foundation of China, National Natural Science Foundation of China, Key Projects of Chongqing Social Science Planning (grant numbers cstc2020jcyj-msxmX0297; cstc2021jcyj-msxmX0284; 71871034;72071023, 2022NDZD10).
Notes
Author biographies
Shuliang Li is a visiting scholar at Windesheim University in the Netherlands. He is a doctoral candidate of Chongqing Jiaotong University. His research interests include grey prediction and scientific decision-making.
Ke Gong is a professor and doctoral supervisor of Chongqing Jiaotong University. He is a visiting scholar in Las Vegas, Nevada, USA. His research interests include data science and intelligent management.
Nannan Song is a master's student at Chongqing Technology and Business University, with research interests in grey forecasting.
Bo Zeng obtained his PhD degree from Nanjing University of Aeronautics and Astronautics. Currently, he is a professor at Chongqing Technology and Business University. His research interests are focused on computer modeling and simulation of grey system.
Appendix A

| % This is the MATLAB program code for the TDGM(1,1,2,r(R)) Clear all; function sumerror = tdgm2(r) format long; % X0 is the original data sequence X0 = [561.41 705.23 812.94 895.2 1069.41 1305.3 1463 1705.37 1868.94 1931.75 2078.06 2393.7 2817.09 3059.68 3240 3726];% natural gas consumption %X0 = [585.53 692.4 802.99 852.69 957.91 1053.37 1106.08 1208.58 1301.57 1346.1 1368.65 1480.35 1602.65 1753.62 1924.95 2075.8];% natural gas production % len is the number of X0 len = length(X0); % The last three data are reserved in the original sequence X0 to test the model prediction error simlen = len-3; % Forecast the next nine data presteps = 9; % r is the order of fractional-order TDGM(1,1,2). If r = 1, the model is TDGM(11,2) r = 1; % w means 2 background-value w = 0.5; %Initial value ini = X0(1); % Initialize order r, and solve the problem that gamma function is meaningless when r is a negative integer or 0; r = rinit(r); % Xr is the r-order accumulating generation sequence of the X0. Xr = ragoa(X0,simlen,r); % Zr is the neighboring mean production sequence of Xr. Zr = wbgg(Xr,simlen,w); % Calculate the value of B and Y Y = ymatrix(Xr,simlen,’Y0’) B = bmatrix(Zr,simlen,'TDGM’) % Calculate the value of a, b, alpha, beta, gama P = (B’*B)^(-1)*B’*Y a = P(1);b = P(2);c = P(3); alpha = (1-(1-w)*a)/(1+w*a) beta = b/(1+w*a) gama = (c-0.5*b)/(1 + 0.5*a) % Calculate the simulated value of Xr tmp = []; tmp(1)=X0(1); for k = 2:len + presteps tmp1=ini*power(alpha,k-1); tmp2 = 0; for g = 0:k-2 tmp2=tmp2 + ((k-g)*beta + gama)*power(alpha,g); end tmp = [tmp,tmp1+tmp2]; end % Calculate the simulated data of X0. % Generate the APE checklist; simpredata = []; simpredata(1)=X0(1); simpredata = ragoa(tmp,length(tmp),-r); sumerror = simpredis(X0,simlen,simpredata); end |
Appendix B
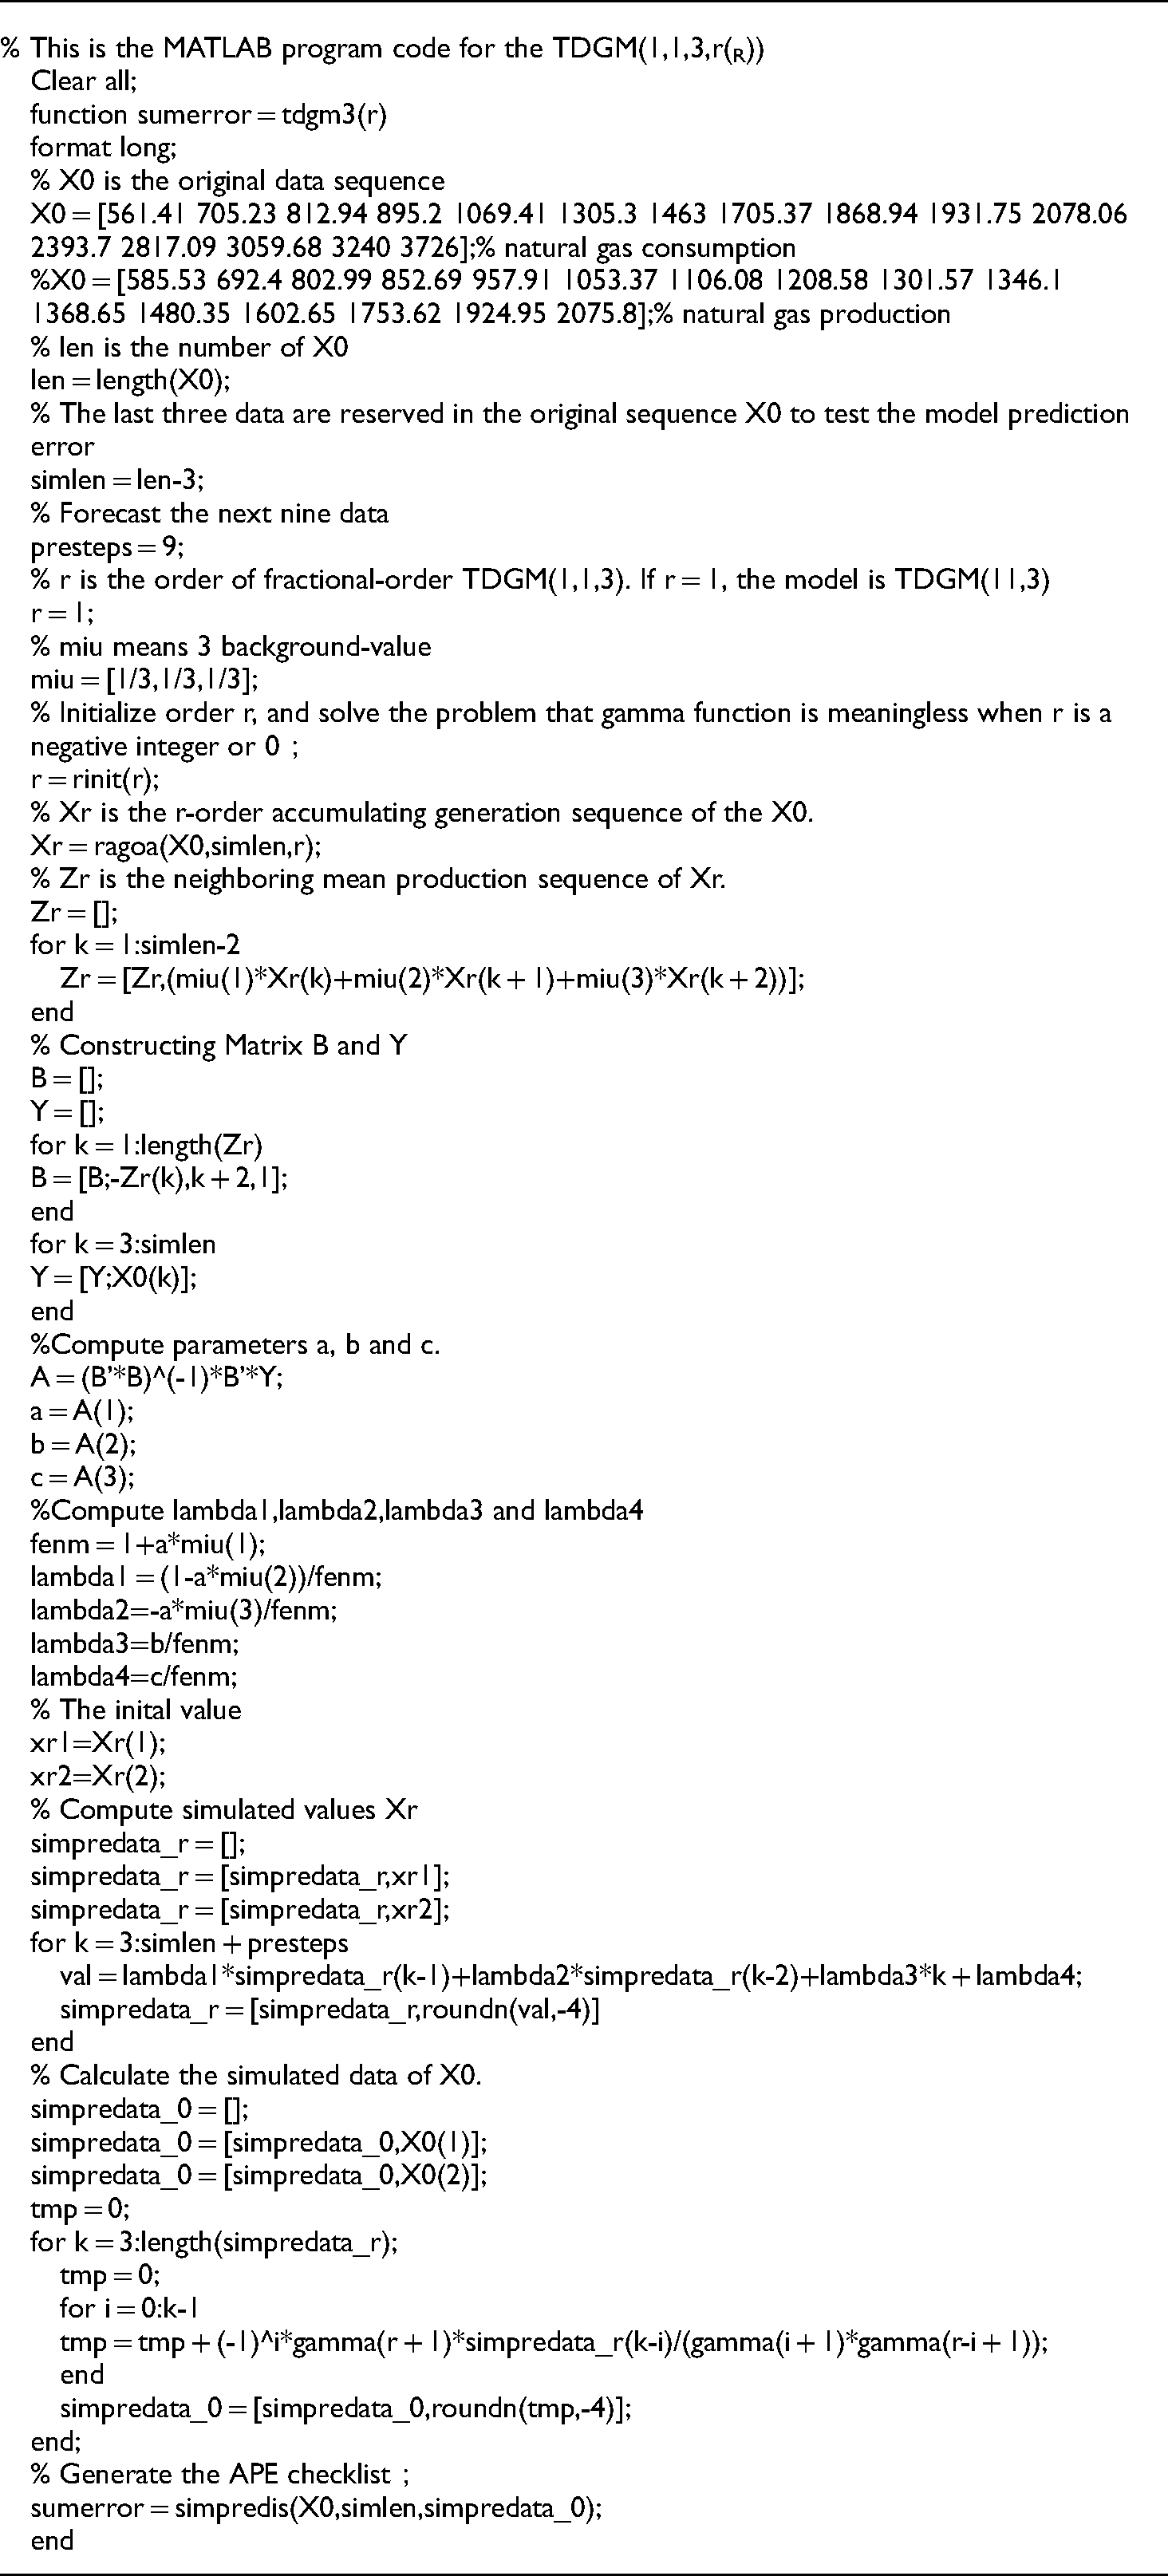
| % This is the MATLAB program code for the TDGM(1,1,3,r(R)) Clear all; function sumerror = tdgm3(r) format long; % X0 is the original data sequence X0 = [561.41 705.23 812.94 895.2 1069.41 1305.3 1463 1705.37 1868.94 1931.75 2078.06 2393.7 2817.09 3059.68 3240 3726];% natural gas consumption %X0 = [585.53 692.4 802.99 852.69 957.91 1053.37 1106.08 1208.58 1301.57 1346.1 1368.65 1480.35 1602.65 1753.62 1924.95 2075.8];% natural gas production % len is the number of X0 len = length(X0); % The last three data are reserved in the original sequence X0 to test the model prediction error simlen = len-3; % Forecast the next nine data presteps = 9; % r is the order of fractional-order TDGM(1,1,3). If r = 1, the model is TDGM(11,3) r = 1; % miu means 3 background-value miu = [1/3,1/3,1/3]; % Initialize order r, and solve the problem that gamma function is meaningless when r is a negative integer or 0; r = rinit(r); % Xr is the r-order accumulating generation sequence of the X0. Xr = ragoa(X0,simlen,r); % Zr is the neighboring mean production sequence of Xr. Zr = []; for k = 1:simlen-2 Zr = [Zr,(miu(1)*Xr(k)+miu(2)*Xr(k + 1)+miu(3)*Xr(k + 2))]; end % Constructing Matrix B and Y B = []; Y = []; for k = 1:length(Zr) B = [B;-Zr(k),k + 2,1]; end for k = 3:simlen Y = [Y;X0(k)]; end %Compute parameters a, b and c. A = (B’*B)^(-1)*B’*Y; a = A(1); b = A(2); c = A(3); %Compute lambda1,lambda2,lambda3 and lambda4 fenm = 1+a*miu(1); lambda1 = (1-a*miu(2))/fenm; lambda2=-a*miu(3)/fenm; lambda3=b/fenm; lambda4=c/fenm; % The inital value xr1=Xr(1); xr2=Xr(2); % Compute simulated values Xr simpredata_r = []; simpredata_r = [simpredata_r,xr1]; simpredata_r = [simpredata_r,xr2]; for k = 3:simlen + presteps val = lambda1*simpredata_r(k-1)+lambda2*simpredata_r(k-2)+lambda3*k + lambda4; simpredata_r = [simpredata_r,roundn(val,-4)] end % Calculate the simulated data of X0. simpredata_0 = []; simpredata_0 = [simpredata_0,X0(1)]; simpredata_0 = [simpredata_0,X0(2)]; tmp = 0; for k = 3:length(simpredata_r); tmp = 0; for i = 0:k-1 tmp = tmp + (-1)^i*gamma(r + 1)*simpredata_r(k-i)/(gamma(i + 1)*gamma(r-i + 1)); end simpredata_0 = [simpredata_0,roundn(tmp,-4)]; end; % Generate the APE checklist; sumerror = simpredis(X0,simlen,simpredata_0); end |
Appendix C

| % This is the MATLAB program code for the TDGM(1,1,4,r(R)) Clear all; function sumerror = tdgm4(r) format long; % X0 is the original data sequence X0 = [561.41 705.23 812.94 895.2 1069.41 1305.3 1463 1705.37 1868.94 1931.75 2078.06 2393.7 2817.09 3059.68 3240 3726];% natural gas consumption %X0 = [585.53 692.4 802.99 852.69 957.91 1053.37 1106.08 1208.58 1301.57 1346.1 1368.65 1480.35 1602.65 1753.62 1924.95 2075.8];% natural gas production % len is the number of X0 len = length(X0); % The last three data are reserved in the original sequence X0 to test the model prediction error simlen = len-3; % Forecast the next nine data presteps = 9; % r is the order of fractional-order TDGM(1,1,4). If r = 1, the model is TDGM(11,4) r = 1; % miu means 3 background-value miu = [1/4,1/4,1/4,1/4]; % Initialize order r, and solve the problem that gamma function is meaningless when r is a negative integer or 0; r = rinit(r); % Xr is the r-order accumulating generation sequence of the X0. Xr = ragoa(X0,simlen,r); % Zr is the neighboring mean production sequence of Xr. Zr = []; for k = 1:simlen-3 Zr = [Zr,(miu(1)*Xr(k)+miu(2)*Xr(k + 1)+miu(3)*Xr(k + 2)+miu(4)*Xr(k + 3))]; end %Constructing Matrix B and Y B = []; Y = []; for k = 1:length(Zr) B = [B;-Zr(k),k + 3,1]; end for k = 4:simlen Y = [Y;X0(k)]; end %Compute parameters a, b and c. A = (B’*B)^(-1)*B’*Y; a = A(1); b = A(2); c = A(3); %Compute lambda1,lambda2,lambda3,lambda4 and lambda5 fenm = 1+a*miu(1); lambda1 = (1-a*miu(2))/fenm; lambda2=-a*miu(3)/fenm; lambda3=-a*miu(4)/fenm; lambda4=b/fenm; lambda5=c/fenm; % The inital value xr1=Xr(1); xr2=Xr(2); xr3=Xr(3); % Compute simulated values Xr simpredata_r = []; simpredata_r = [simpredata_r,xr1]; simpredata_r = [simpredata_r,xr2]; simpredata_r = [simpredata_r,xr3]; for k = 4:simlen + presteps val = lambda1*simpredata_r(k-1)+lambda2*simpredata_r(k-2)+lambda3*simpredata_r(k-3)+lambda4*k + lambda5; simpredata_r = [simpredata_r,roundn(val,-4)] end % Calculate the simulated data of X0. simpredata_0 = []; simpredata_0 = [simpredata_0,X0(1)]; simpredata_0 = [simpredata_0,X0(2)]; simpredata_0 = [simpredata_0,X0(3)]; tmp = 0; for k = 4:length(simpredata_r); tmp = 0; for i = 0:k-1 tmp = tmp + (-1)^i*gamma(r + 1)*simpredata_r(k-i)/(gamma(i + 1)*gamma(r-i + 1)); end simpredata_0 = [simpredata_0,roundn(tmp,-4)]; end; % Generate the APE checklist; sumerror = simpredis(X0,simlen,simpredata_0); end |