
Abstract
Investigating the drivers of CO2 emissions is essential for limiting global warming, which has sparked widespread concern. This study evaluates the association between economic complexity and CO2 emissions in China, considering the effect of disintegrated energy and financial globalization on the environmental function between 1970 and 2018. This dataset was analyzed using the autoregressive lag model (ARDL) and frequency-domain causality approaches. The ARDL unveiled that urbanization, economic complexity, financial globalization, and economic growth deteriorate the environment while environmental sustainability is achieved through renewable energy utilization. The study also validates the Environmental Kuznets Curve hypothesis. Also, the frequency-domain causality disclosed that all regressors (economic growth, financial globalization, economic complexity, and urbanization) could forecast CO2 emissions in China at different frequencies. Based on these outcomes, policy recommendations are formulated.
Introduction
The government's implementation of unsound and unhealthy economic plans is the byproduct of continuous climate change occurrences, which threaten humankind and its environment. This arises because various governments prioritize economic expansions at the expense of environmental quality. As a result, fostering sustainable economic growth must be a primary consideration for these policymakers globally. Furthermore, one of the most significant endeavors for economies to realize sustainable development is stimulating economic growth in conjunction with enhancing environmental quality.1–3 Energy is a necessity for economic expansion as well as a contributor to environmental deterioration. 4 The energy-environment connection has become a significant concern for policymakers and scholars globally. Various scholars suggest that fossil fuel sources, not alternative energy sources, are responsible for the detrimental impacts on the environment. As a result, expanding the development and usage of renewable energy instead of fossil fuel energy sources promises a myriad of benefits, including reduction of greenhouse gases, job prospects, and diversification of energy sources.5–7
The impact of economic expansion on the environment has been extensively studied within the Environmental Kuznets Curve (EKC) framework, which explains the non-linear connection between growth and ecological deterioration.8,9 The EKC contends that as economic growth accelerates, the level of degradation in the environment also increases at the initial stage. Upon reaching a certain level (turning point), environmental degradation reduces as economic growth surges; such an association indicates an inverted U-shaped pattern. The first phase of the EKC is called the scale effect, experienced by developing and emerging nations. After the threshold point, the composite and technique effect is the second and third phase of the EKC, which is associated with developed and advanced economies. A large majority of empirical studies have verified this hypothesis by incorporating different parameters, including globalization, energy utilization, and urbanization.10–12 Meanwhile, other studies could not.13,14
Moreover, several scholars have inspected the connection between economic complexity and pollution.15–17 The economic complexity details a nation's knowledge and skill-driven production efficient capacity. Hence, economic complexity is an indicator of the level of economic development in any economy. Economic complexity provides a snapshot of a nation's technological advancements and structural changes. 14 Based on the structure of the production, structural reforms and product complexity could either impair or contribute to a nation's environmental quality. 18 Economic complexity provides the policymakers with the platform to support technical know-how, research, and development project, skills, and knowledge, all of which improve environmentally friendly technologies and greener commodities, which lessen environmental deterioration. 15 In contrast, many economies, especially emerging and developing ones, do not possess such a complex economic framework, resulting in the utilization of conventional technologies for the manufacturing process, leading to increased energy usage and environmental degradation.19,20
Another significant connection beginning to draw much attention in recent literature is the finance-related globalization on environmental degradation. Financial globalization constitutes the influx of foreign debt, portfolio investment, foreign income payment, foreign direct investment, and reserves. Two major hypotheses explain the financial globalization-environment nexus. The first, the pollution haven hypothesis, asserts that the influx of finance-related globalization has a detrimental impact on the environments of the host nation. 21 Meanwhile, the second, the Pollution Halo Hypothesis, asserts that influx of the finance-related globalization has a favorable impact on the environment of host countries. 22 Based on the above arguments, economic growth, disintegrating energy usage, economic complexity, and financial globalization can stimulate environmental degradation. This serves as a motive to use China as the case study.
China's capacity to manage pollution is a significant concern for the country and the rest of the world. The government is positioned as the world's second-largest economy, with a current GDP of USD 13.608 trillion (constant USD 10.797 trillion) in 2018. 23 Concerning economic complexity, the country is currently ranked 33 among the 129 economies of the world. 24 Meanwhile, China's economic complexity level has risen dramatically, particularly during the 2000s. China's large economy and mid-to-high economic complexity are attributable to adopting an open economy system. With the economic reform of 1978, China achieved a tremendous average growth rate of 9% from 1978 to 2012. 14 This unprecedented growth in energy demand, which is met by exponential expansion in fossil fuel consumption, has adversely impacted the environment. China has been the largest consumer of coal in the world for a long time, thereby contributing to carbon emissions. China's carbon emissions amounted to 9298mtons, accounting for 28% of carbon emissions globally. 25 China ranked 120th out of 180 nations in the environmental performance index, suggesting that the nation has high environmental degradation. China is the largest GHGs emitter and is a significant contributor to global warming.
Meanwhile, the Chinese government is committed to achieving carbon neutrality by 2060 and achieving peak emissions by 2030. 26 They aim to decrease CO2 emissions per unit of GDP by more than 65% by 2030 compared to 2005 to raise the share of non-fossil energy in primary energy consumption to around 25%. As a result, this study attempts to probe whether financial globalization and renewable energy usage could help achieve carbon neutrality by 2060 in China.
Based on this perspective, the primary focus of this research is to test the effect of disintegrated energy usage, economic complexity, economic growth, and financial globalization on CO2 emissions in China. This current study adds to the literature in several ways: (a) No study has examined the effect of economic growth, financial globalization, and economic complexity on CO2 emissions in China. (b) Most existing studies concentrated on the combined influence of globalization and renewable energy on CO2 emissions 27 ; however, few or no study is known about the potential combined effects of renewable energy and financial globalization on CO2 emissions. As a result, we inspect the interactive effect of financial globalization and renewable energy on China's carbon emissions to uncover and formulate policies toward mitigating environmental degradation. (c) We explore the interactive effect of financial globalization and economic complexity on CO2 emissions; not much study has attempted to unearth this combined effect on the environment. (d) We employed time-domain causality techniques to uncover the causal interaction between variables. We anticipate that the current research will add to the literature for these four reasons.
The remaining work is designed as follows: Section 2 covers the critical evaluation of earlier research on the subject matter. Section 3 covers the data and methodology used. Section 4 presents the empirical findings. Finally, section 5 summarizes the main findings and presents the policy implications.
Literature review
Substantial studies have been done on the drivers of ecological sustainability. These research conclusions have always produced vast disparities due to differences in the dataset scope, methodology used, proxies for variables, and national or regional characteristics. For example, Chen et al. 28 probed the influence of economic growth (GDP), urban population (URB), and energy usage on BRICS nations' CO2 emissions using the data between 1990 and 2018. The authors unearth that GDP, URB, and energy usage enhance CO2 emissions, thereby increasing environmental pollution. Usman et al. 29 probed into the effect of GDP, renewable energy (REN), nonrenewable energy (NREN), and trade openness on Pakistan's CO2 emissions. The authors employed the autoregressive distributive lag (ARDL) technique to analyze the period from 1990 to 2017. The authors observed that GDP, NREN, and trade openness raise carbon emissions, while REN mitigates CO2 emissions in Pakistan. Bashir et al. 30 considered the interaction between URB, economic complexity (ECI), REN, and GDP on CO2 emissions in Regional Comprehensive Economic Partnership (RCEP) nations using the dataset between 1990 and 2019. The authors concluded that ECI and REN reduce CO2 emissions, but URB and GDP contribute to carbon emissions.
Zafar et al. 31 probed into the influence of REN and GDP on CO2 emissions in 22 selected nations. The author reported that REN reduces CO2 emissions. Meanwhile, GDP stimulates CO2 emissions. Balsalobre-Lorente et al. 32 observed the effect of GDP, URB, foreign direct investment (FDI), and energy usage on carbon emissions in BRICS economies. The authors found that URB mitigates carbon emissions while energy use, FDI, and GDP enhance carbon emissions. Furthermore, they unearth the EKC and pollution haven hypothesis in BRICS economies.
Meanwhile, the EKC hypothesis does not hold in the study of twenty chosen African nations by Djellouli et al. 13 Furthermore, the authors probed into the effect of FDI, REN, GDP, and NREN on carbon emissions using the dataset covering 2000–2015. The negative impact of REN is detected on carbon emissions during the study period. Also, FDI contributes to the degradation of the environment, endorsing the pollution haven hypothesis in twenty African nations.
Adebayo and Acheampong investigated Australia 33 to observe the effect of globalization, coal utilization, and GDP using the annual time series data between 1970 and 2018. The findings of the empirical analysis reported that globalization, coal utilization, and GDP enhance environmental degradation by increasing the level of carbon emissions. Using the period between 1970 and 2018, Kirikkaleli and Oyebanji 34 observed the effect of international trade, GDP, and globalization on CO2 emissions in Bolivia. The authors observed that GDP and export mitigate carbon emissions; imports and globalization stimulate carbon emissions. Ojekemi et al. 35 probed the influence of GDP and REN on BRICS nations' carbon emissions using 1990 and 2018. The authors unearth that GDP enhances carbon emissions, thereby increasing environmental pollution, while REN mitigates it. Mata et al. 36 explored the impact of GDP, REN, and globalization on carbon emissions using the Colombia dataset from 1970 to 2017, utilizing the FMOLS, DOLS, and ARDL approach. The authors unearth that GDP stimulates carbon emissions; meanwhile, REN and globalization mitigate carbon emissions.
Kirikkaleli et al. 37 observed the role of GDP and REN on CO2 emissions in Chile for the dataset from 1990 to 2017. The authors found that REN mitigates carbon emissions while GDP enhances carbon emissions. The study of Pata,38–40 Yilanci and Pata, 41 Ulucak and Yucel, 42 Koseoglu et al., 43 and Kirikkaleli et al. 44 supports these results. For a study done in the UK, Adebayo et al. 45 investigated the role of GDP, NREN, and REN on CO2 emissions by using the monthly dataset spanning between February 1, 2020, and April 2021. The empirical outcome discovered REN is adversely related to carbon emissions. GDP and NREN contribute to carbon emissions. Akadiri et al. 46 applied the Quantile-on-Quantile Regression (QQR) to investigate the connection between financial globalization and carbon emissions in G7 economies using the dataset between 1970Q1 and 2018Q4 and established that the influence of financial globalization on carbon emissions is negative. He et al. 15 inspected the impact of economic complexity, globalization, REN, and GDP on CO2 emissions in 10 selected nations using the dataset from 1990 to 2018. The outcome concludes that globalization, ECI, and REN mitigate carbon emissions. Furthermore, the findings reveal that GDP contributes to carbon emissions. Balsalobre-Lorente et al. 47 examined the effect of GDP, FDI, URB, economic complexity, and REN on carbon emissions in Portugal, Ireland, Italy, Greece and Spain (PIIGS) for the timeframe between 1990 and 2019. The empirical evidence reported that economic complexity, GDP, FDI, and URB increase carbon emissions, while REN mitigates carbon emissions.
Given the review of prior studies, various critical areas of knowledge are untouched. Such observed gaps are as follows: no study has explored the effect of economic growth, financial globalization, and economic complexity on CO2 emissions in China. Moreover, no study investigates the combined impact of renewable energy and finance-related globalization on carbon emissions. The priority of this research is to resolve these gaps in the literature.
Data and methodology
Data
This current study assessed the effect of GDP, NREC, REC, URB and, FGLO, ECI on CO2 emissions within the conjecture of the EKC in China for the timeline covering from 1970–2017. The period is restricted to the year 2017 due to the unavailability of the economic complexity data. The description of the variable used is reported in Table 1. Carbon emissions and nonrenewable and renewable energy utilization data are acquired from the British petroleum database. Moreover, the data on urbanization and economic growth are gathered from the World Bank database. Meanwhile, the economic complexity and financial globalization were sourced from the Atlas Media database and KOF Swiss Economic Institute.
Description of variable.

The descriptive nature of the dataset used for China is presented in Table 2. CO2 ranges between −0.0312 and 0.8474, with a median of 0.3777 and 0.4080 as the mean value. Also, GDP spans between 2.3589 and 3.8661, and its median and average value are 3.0235 and 3.0442, respectively. NREN varies between 3.4421 and 4.3460, with an average value and median of 3.9094 and 3.8813, respectively. REN varies between 1.9067 and 3.4700, while the average and median values are recorded as 2.6147 and 2.5599, respectively. For FGLO, the value of FGLO ranges between 0.9302 and 1.7021, with an average value and median of 1.3815 and 1.5227, respectively. ECI varies between 0.0891 and 1.1637, while its average and median are 0.4417 and 0.3346, respectively. The value of URB varies between 8.1534 and 8.9050, with the average and median values reported as 8.5319 and 8.5444, respectively. The skewness of the dataset was also reported in the descriptive statistics, which indicates that all series are positively skewed except FGLO and URB, which are negatively skewed. Also, the kurtosis of the variables proved to be positive, with a value less than 3 indicating platykurtic, except for ECI. Figure 1 presents the flow of the analysis.
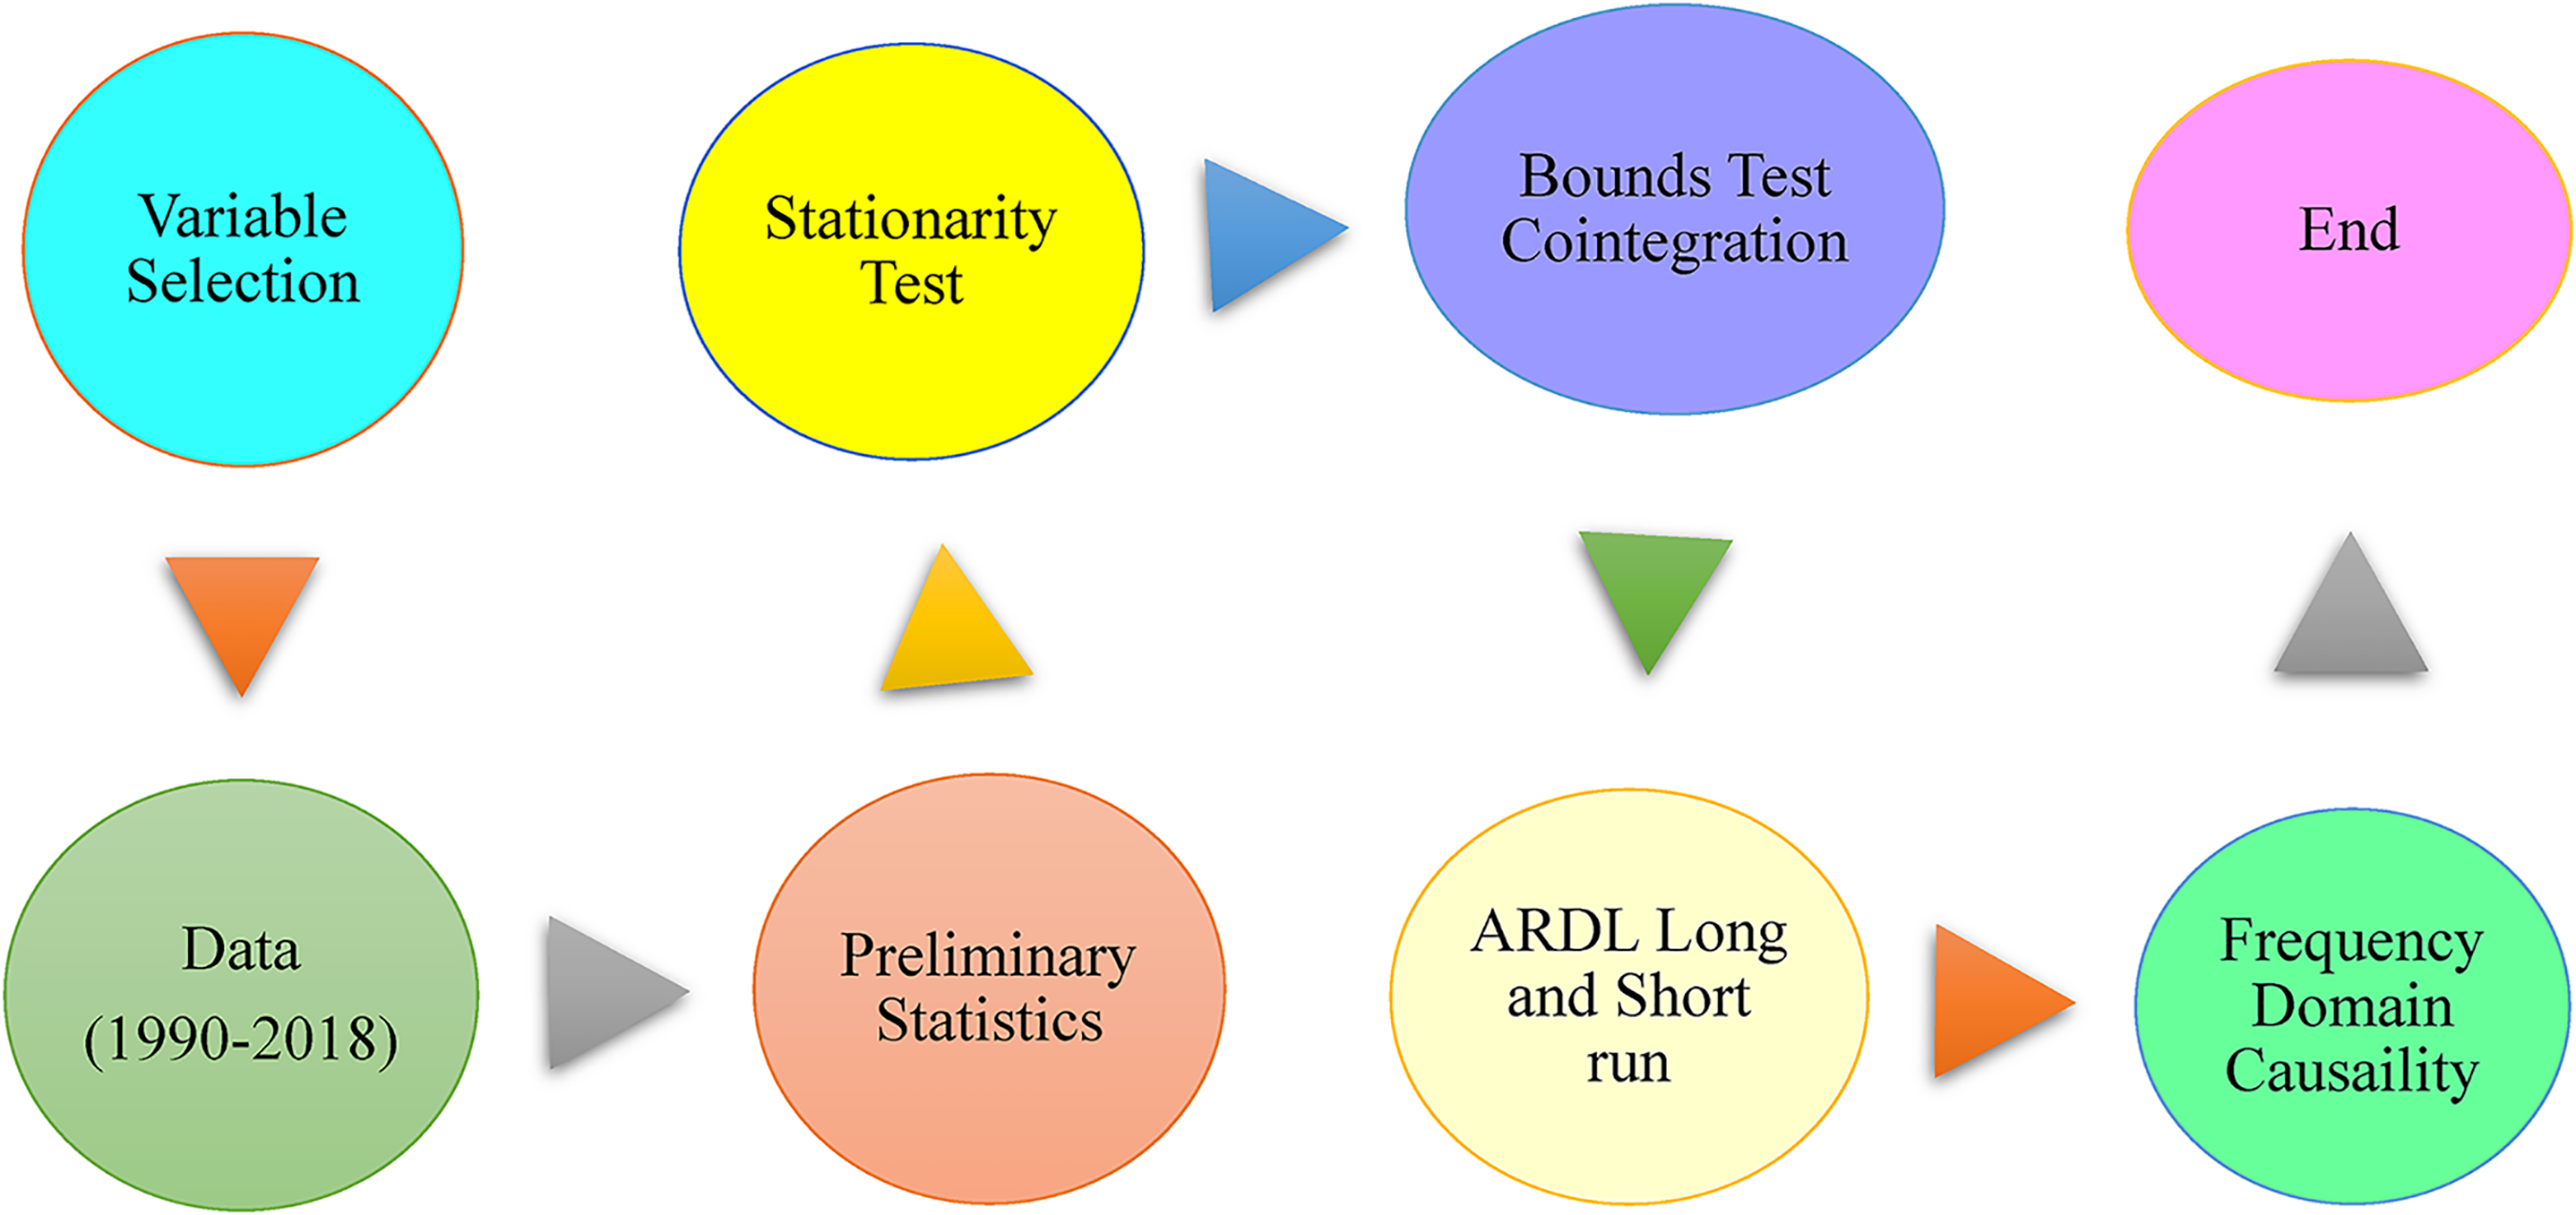
Flow of empirical analysis.
Descriptive statistics.

Models construction
The current study discusses the drivers of CO2 emissions in China. Considering the existing literature, the following equation is proposed to accomplish the objective.


Econometric methodology
Unit root testing
To begin with this study, we examined the stationarity features to confirm whether the parameters used do not possess a unit root issue. The authors use the unit root test of Dickey and Fuller 51 and Philips and Perron. 52 This current research further employed the unit root test of Zivot and Andrews, 53 which can detect stationary and breaks at least one.
ARDL bounds testing approach
Upon investigating the stationary property of the variables employed, Pesaran et al.
54
applied the bound testing approach to determine the cointegration evaluation. There are various cointegration procedures; however, the ARDL bound test was used in this research given that it is more effective than the other cointegration approaches for the following reasons: (a) The bound testing procedure is versatile, given that it allows for variable integration at orders I(0) and 1(1) to be included in the model; (b) It offers unbiased estimate in the long term; (c) In comparison with the traditional cointegration testing, it can also be used in the context of small sample size; (d) The issue of endogeneity can be employed using this approach. The bound testing procedure is depicted as follows:

Frequency-domain causality
Furthermore, this study explores the long-, medium-, and short-run causal relationships between CO2 and its determinants. Unlike conventional causality techniques, this method offers critical insight into the causal relationship at various frequencies (period). Consequently, it evaluates time-dependent interferences in a particular domain frequency. The approach is based on reconstructing the vector autoregressive (VAR) connection between y and z, which is written as
The lag l is selected using the Akaike information criterion (AIC). Focusing on the null hypothesis (M), which is stated as 

Result estimation
Unit root tests
Before the variables are evaluated, a preliminary testing procedure such as unit root test (stationary test) must be performed. The stationary test is a significant feature of the parameters to be determined. Table 3 shows the unit root test results for all the research variables at constant and trend. The presence of nonstationarity (unit root) was tested using the ADF, PP, and ZA unit root tests. All the variables mentioned were subjected to level and first difference tests. All series have unit root issues at levels except GDP for the conventional unit root test (ADF and PP). Meanwhile, all variables used are free of unit root issues after their first difference is taken.
Outcomes of unit root.

Note: *p < 1%, **p < 5% and ***p < 10%. Δ signifies first difference. AIC is used. Tests are in trend and intercept. The maximum lag length is 8.
Cointegration tests
Since the variables are integrated in mixed order, this research applies the bounds testing procedure to test for cointegration. The findings of the bounds testing procedure for the three models are summarized in Table 4. As in Table 4, the null hypothesis of no cointegrating association is rejected for the three models at the 1% significance level. As a result, the bounds testing procedure confirms that the variables under study for the three models exhibit extensive cointegration for carbon emissions. Therefore, there is evidence of cointegration in the three models.
Bounds testing outcomes.

Note:
ARDL results
To ascertain the objective of this study, we employ the ARDL estimator to inspect the influence of these determinants on carbon emissions in China, which are summarized in Table 5. For all models, GDP impact CO2 emissions positively. A 1% upsurge in GDP increases carbon emissions by 3.2510% (Model I), 3.1377% (Model II), and 4.7718% (Model III) in the long run, meanwhile in the short run, carbon emissions will increase by 3.2510% (Model I), 3.1377% (Model II) and 1.0938% (Model III). Furthermore, the square of GDP's coefficient on carbon emission is negative in all models in the long term. Carbon emissions will drop by 0.6061% (Model I), 0.5431% (Model II), and 0.8535% (Model III) due to a 1% surge in the square of GDP in the long run; meanwhile, in the short run, CO2 emissions will be mitigated by 0.6061% (Model I), 0.5431% (Model II) and 0.2154% (Model III). These findings suggest an inverted U-shaped interaction between GDP and carbon emissions, confirming the proof of the EKC hypothesis. Therefore, these facts validate the assertion that as the average income levels increase, environmental degradation rises over time, representing a potential risk to ecological quality upon reaching a peak and then starting to decline, culminating in a better environmental impact. The possible explanation for this outcome is that China focused on intensive productive operations in the early growth phases, which resulted in increased emissions. However, after the Chinese economy reaches a certain degree of development, it begins to concentrate on enhancing the environmental quality. As a result, it has begun to invest significant sums of money in green technologies and energy. These actions tend to reduce carbon emissions. This indicates that China is on the path of sustainable growth but must not relent. These findings align with the study of Wu et al., 7 Aziz et al., 12 and Akram et al. 21
ARDL long- and short-run outcomes.

Note:
Furthermore, economic complexity impact CO2 emissions in China for all three models, both in the long and short run. As stated in Table 5, an increase in the level of economic complexity by 1% will contribute to the level of carbon emissions by 0.0231% (Model I), 0.1612% (Model II), and 0.0191% (Model III) in the long run. A similar outcome is detected in the short run. Thus, economic complexity boosts environmental degradation in China. This result suggests that China manufactures and export product that pollutes the environment. The country still has not adopted pollution-reduction technologies appropriately in manufacturing export commodities, which necessitates a high degree of knowledge and skill. Like other emerging economies, China has become a pollution sanctuary for several companies in developed economies because they are more concerned with economic expansion than the environment. Meanwhile, these companies established their manufacturing operations for several consumers, advanced and complex goods in China due to the cheap cost of labor. During the manufacturing process of these products, intense fossil fuel energy utilization occurs, and hence carbon emissions rise. On these grounds, the Chinese government needs to consider economic complexity when formulating policy toward achieving a sustainable environment. This verdict matches the findings of Balsalobre-Lorente et al. 47 in PIIGS and Pata and Caglar 14 in China.
From the result of the ARDL estimator, we can establish that the coefficient of the NREN has a positive effect on CO2 emissions in China in the long and short run for all models. The increase in the consumption of NREN by one percent will intensify the level of carbon emissions by 0.6032% (Model I), 0.7217% (Model II), and 0.7507% (Model III). As a result, NREN promotes China's environmental deterioration. This energy source is responsible for the economy's continuous growth and can also exacerbate ecological damage and hence does not safeguard the environment. This is a plausible reason for the detrimental impact of GDP on the environment. These findings resonate with the research of Adebayo et al. 45 in the UK and Alola et al. 55 in China. The plausible explanation for this connection is that the combustion of coal or oil produces CO2 emissions by combining carbon in the atmosphere with oxygen. Meanwhile, alternative energy sources (REN) negatively impact China's carbon emissions for all models. The increase in the usage of this form of energy source (REN) by 1% will enhance the quality of the environment in China by 0.1633% (Model I), 0.1201% (Model II), and 0.3885% (Model III). This result is consistent with the study of Usman et al. 29 in Pakistan, Zafar et al. 31 in 22 selected nations, and Awosusi et al. 56 in BRICS nations. Furthermore, for the Chinese government to attain the agenda for Sustainable Development for 2030, notably SDGs 7 and 13, they must switch from fossil fuel energy to alternative and sustainable energy sources. Renewable energy sources can effectively reduce the dangers posed by carbon emissions, such as climate change-related events (including flooding, droughts, and heat waves) and health hazards. Meanwhile, China is currently in the exploratory phase but aggressively creating sustainable energy technologies, primarily wind, solar, and nuclear. Even though the major driver of energy development is shifting away from old energy sources to new ones, coal remains the most prominent user. Furthermore, sustainable growth in China can be achieved when initiatives aim to ensure that these alternative energy sources can be accessed and utilized by everyone at cheap and affordable rates.
Meanwhile, we include urbanization in only Model I. The result shows that urbanization intensifies CO2 emissions in China in the short and long run. The upsurge in urbanization by 1% is associated with the intensification of CO2 emissions by 2.4934%. This result suggests that people migrating to major cities adds to accelerated industrialization, company development, and the building of roadways, railroads, hospitals, and markets, among other things, affects CO2 emissions. This corroborates the findings of Bashir et al. 30 in RCEP nations and Chen et al. 28 in BRICS nations. Urbanization stimulates the economy and increases the density of cities with resource constraints. Meanwhile, urbanization increases the need for transportation, accommodation, household goods, etc. Carbon emissions are anticipated to surge due to the Chinese overreliance on fossil fuels.
Furthermore, financial globalization positively affects CO2 emissions in the long term, whereas in the short run, its influence is negative on CO2 emissions. This outcome advocates that financial globalization mitigates CO2 emissions in a short time; meanwhile, over time, it increases the level of carbon emissions, indicating the presence of the pollution haven hypothesis in China. Thus, globalization opens up investment opportunities through FDI and boosts capital markets through financial deregulation. This process, without a doubt, stimulates capital markets, investment prospects, and economic expansion, causing an increasing energy demand and, as a result, environmental degradation. Furthermore, this money generated from FDI and the capital markets is channeled to the development of the dirty sector in the context of China. These results align with the studies of Akadiri et al., 46 Miao et al., 57 and Shahzad et al. 58 for G7 economies, BRICS, and China, respectively.
Furthermore, the variables' combined effect on CO2 emissions is examined. For Model II, we identified that the combined impact of economic complexity and financial globalization boosts China's carbon emissions level. Meanwhile, Model III's combined effect of financial globalization and renewable energy mitigates China's carbon emission level. These assertions are supported by the positive and negative signs of the long-term coefficients associated with the interaction effects (FGLO*ECI) and (FGLO*REN), respectively. Thus, these findings further suggest that financial resources generated from FDI and capital market channels for developing an advanced and complex product and expertise increase the level of carbon emissions in China. This confirms our assertions regarding the use of fossil and conventional technologies for the production process. Meanwhile, these issues could be resolved when the positive environmental impacts of renewable energy in China are enhanced through the influx of reserves, FDI, portfolio investment, foreign income payment, and foreign debt.42,43 As a result, lowering China's dependence on fossil fuels and expanding the usage of renewable energy are deemed necessary for boosting the country's overall environmental quality.
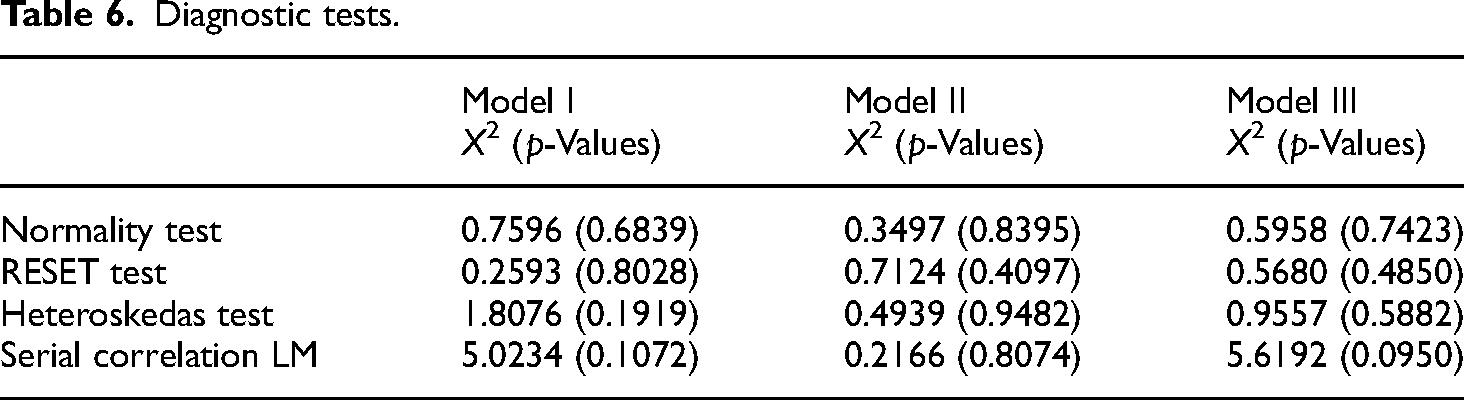
Lastly, the ECT is statistically significant and has the correct sign, implying that the imbalance in the short term, in the three models will adjust in the long run. Furthermore, several postestimation analyses were performed to determine whether the models were accurate. The results show that residuals are normally distributed. Furthermore, no serial correlation issues, no issues of heteroscedasticity, and misspecification (see Table 6). The models are also stable, as shown in Figure 2(a) to (c).

(a) CUSUM and CUSUMSQ for Model I. (b) CUSUM and CUSUMSQ for Model II. (c) CUSUM and CUSUMSQ for Model III.
Diagnostic tests.
Frequency-domain causality outcome
We further probe the causal association between the exogenous parameters (GDP, ECI, URB, NREN, REN, FGLO) and carbon emissions in China. In doing so, we used the frequency-domain causality (FDC) approach to detect causality in the different time domains (short, medium, and long run). Figure 3(a) to (f) shows the results of the FDC. The dark-green dot lines signify the FDC approach's T-statistics; the lavender dash line and orange dotted line represent the 5% and 10% critical value, respectively. We can confirm that GDP Granger causes carbon emissions in the long run, as reported in Figure 3(a). Thus, economic growth is a predictor of China's carbon emissions in the long run. Also, as seen in Figure 3(b), economic complexity can predict carbon emissions in the medium and long run.

(a) GDP to CO2 emissions. (b) ECI to CO2 emissions. (c) NREN to CO2 emissions. (d) REN to CO2 emissions. (e) FGLO to CO2 emissions. (f) URB to CO2 emissions.
Hence, economic complexity is a determinant of CO2 emissions in the medium and long in China. Meanwhile, in the long term, we identify that nonrenewable energy Granger causes carbon emission, given the rejection of no-causality in the long run, as presented in Figure 3(c). As a result, nonrenewable energy is a predictor of carbon emissions in the long term in China. Furthermore, Figure 3(d) shows that the null hypothesis of no-causality is refuted in the long and medium term. Hence, renewable energy can predict the pattern of China's CO2 emissions in the long and medium term. However, based on the findings in Figure 3(e), we detected that the null hypothesis of no-causality from financial globalization to carbon emissions is refuted in the medium term. Thus, we can conclude that financial globalization forecasts the trends of CO2 emissions in China. Finally, Figure 3(f) shows the outcome of the causality from urbanization to carbon emission. We reject the null hypothesis of no-causality in the long term. Thus, urbanization is a predictor of carbon emissions in China.
Conclusion and policy implications
Global warming poses a significant danger to the worldwide economy, civilization, and human life. Carbon dioxide (CO2) has gained considerable attention as one of the most important greenhouse gases (GHG). According to the Intergovernmental Panel on Climate Change, it accounted for 76.7% of GHG emissions in 2013. Therefore, investigating the drivers of CO2 emissions is essential for limiting global warming, which has sparked widespread concern. We utilized a yearly dataset spanning between1970 and 2017, which is analyzed using the ARDL and FDC approaches. Findings from the ARDL confirm that economic growth, financial globalization, economic complexity, and urbanization contribute to the deterioration of the environment, while renewable energy contributes to environmental sustainability. The study also validates the EKC hypothesis. Also, the FDC disclosed that all regressors (economic growth, financial globalization, economic complexity, and urbanization) could forecast CO2 emissions in China.
Furthermore, the results show that nonrenewable energy and economic complexity increase the level of CO2 emissions. Furthermore, the findings of the causality test show that environmental pollution is caused by nonrenewable energy and economic complexity. As a consequence, these two factors promote an increase in ecological deterioration. Fossil fuels accounted for 84.4% of China's total energy consumption in 2014. Since the use of fossil fuels contributes significantly to emissions, the Chinese government must establish policies that improve energy efficiency and promote the use of greener sources of energy. The use of innovative energy-saving technologies can advance the level of energy efficiency. Furthermore, by lowering energy intensity and offering renewable energy substitutes, the percentage of fossil fuel-based energy in the overall energy mix can be lowered. Moreover, policymakers in China should implement energy conservation policies to enhance the quality of the environment. Furthermore, to lessen human environmental impact, various groups' should be supported financially.
Regarding economic complexity, China's heavy industry production contributes to environmental degradation. When China creates more sophisticated and informed products, it uses more natural resources and pollutes the environment as a growing country. China prioritizes economic expansion and increased exports over ecological issues. China's ecological policies are more lenient than industrialized nations regarding export enterprises. Despite its substantial growth rates, China's economic complexity remains behind that of many high-income nations. Therefore, it is possible to argue that China's current economic complexity hampers environmentally promising innovations. As a result, China's CO2 emissions are increasing. The export process should use more ecologically friendly and technological strategies to minimize CO2. In addition, to reduce China's CO2 emissions, the Chinese government should increase investments and expenditures on emission reduction initiatives. Moreover, since globalization degrades environmental quality, policymakers should establish mechanisms to assess the ecological possibility of foreign investment and take action against companies that use outdated. Moreover, foreign investors should be encouraged to incorporate sustainable technologies and participate in greener energy projects. Besides, international social collaborations and local media outlets should be used to enhance environmental consciousness.
Lastly, there are two fundamental research prospects presented in this work. The validity of the EKC hypothesis can be investigated utilizing the FARDL technique in future studies for more economically complex nations. Furthermore, future studies should evaluate the impacts of ECI on CO2 emissions and ecological footprint at the regional level in China
Footnotes
Acknowledgment
This study received no specific financial support.
Declaration of conflicting interests
The author(s) declared no potential conflicts of interest with respect to the research, authorship, and/or publication of this article.
Funding
The author(s) received no financial support for the research, authorship, and/or publication of this article.
Author biographies
Prof