
Abstract
Drinking water in Ghana is estimated at 79%, but this only represents the proportion of the population with access to improved drinking water sources without regard to the quality of water consumed. This study investigated the quality of household drinking water sources in the Oforikrom municipality where potable water requirements are on the rise due to an ever-increasing population. Both quantitative and qualitative methods were employed in this study. One Hundred households were randomly selected and interviewed on the available options for drinking water and household water treatment and safe storage. A total of 52 points of collection (POC) and 97 points of use (POU) water samples from households were collected for physicochemical and microbial water quality analysis. Amongst the available drinking water options, sachet water (46%) was mostly consumed by households. Water quality analysis revealed that the physicochemical parameters of all sampled drinking water sources were within the Ghana Standards Authority (GSA) recommended values expected for pH (ranging from 4.50 to 7.50). For the drinking water sources, bottled (100%, n = 2) and sachet water (91%, n = 41) showed relatively good microbial water quality. Generally, POC water samples showed an improved microbial water quality in comparison to POU water samples. About 38% (n = 8) of the households practicing water quality management, were still exposed to unsafe drinking water sources. Households should practice good water quality management at the domestic level to ensure access to safe drinking water. This may include the use of chlorine-based disinfectants to frequently disinfect boreholes, wells and storage facilities at homes.
Introduction
The importance of clean and safe water cannot be overstressed. Access to potable water is a basic right1,2 and necessary for good health and wellbeing.3,4 As a result, the UN General Assembly has explicitly called for actions leading to the provision of “safe, clean, accessible and affordable drinking water and sanitation for all”.3,5 There are myriad uses of water6,7and thus, water is considered an elixir of life since most activities of humans involves the use of water. 8 At the domestic level, water is mostly consumed and used for general household activities such as cooking, washing, bathing, etc.
Assess to unsafe drinking water sources is one of the world’s major challenges as it threatens both health and the environment – especially for most developing countries.9,10 The use of unsafe water sources has been identified as a leading risk factor for infectious diseases such as diarrhoea, cholera, hepatitis A, dysentery, polio and typhoid. 11
Drinking water is mostly acquired from groundwater, surface water, or rainwater 12 and there is variation in the water quality of these sources. 13 Generally, groundwater resources are formed when water infiltrated the topsoil and fills up voids within underlying soils and rocks. The water is purified naturally as it moves through the interstices of the soil and rock particles. However, due to dumpsite leachate infiltration and flows from leaking sanitation systems, groundwater can easily be polluted with microbes and other chemical contaminants.14,15 Surface waters are usually treated at water treatment plants and distributed to consumers through pipe networks. Piped water can be contaminated during transmission owing to the existence of formed biofilms in water distribution lines.16,17 Collected rainwater also has the tendency to be contaminated due to exposure to air pollutants. 13 In developing countries where packaged drinking water is increasingly becoming ubiquitous, this source can also be contaminated during production. 18
In Ghana, the main sources of drinking water for most households include pipe-borne, well, natural sources such as rainwater and rivers/streams and others. Other drinking water sources constitute; bottled water, sachet water and tanker supplied. 19 Although, drinking water in Ghana is estimated at 79%; 93% urban coverage and 68% rural coverage,2,10 these figures only represent the proportions of the population with access to improved drinking water sources without regard to the quality of water consumed. 20 In Kumasi, access to safe drinking water has been identified as a challenge. Access to treated piped water supplied directly to homes or public standpipes is estimated to be 95%. 21 But due to frequent and sometimes lengthy periods of interruption in the supply of treated piped water, many households rely on other sources of water such as wells, boreholes, springs and surface waters. Meanwhile, studies have reported high levels of microbial and metal contaminants in groundwater and surface water sources in Kumasi.21,22
Studies have shown that even improved water sources are not entirely free from contamination, and unsafe water storage and handling practices at the household level can further contaminate drinking water.21,23 This assertion has been corroborated by findings from several surveys conducted by the Ghana Statistical Service in Ghana. For instance, findings from the Ghana Living Standard Survey (GLSS) Round 6 conducted in 2014 indicated that about half (44%) of improved drinking water sources were faecally contaminated, while close to two-thirds (62%) of household drinking water suffered a similar level of faecal contamination. 19 A more recent survey report indicates that only one in five households (19%) have access to safely managed drinking water. 24 Thus, access to safe drinking is a key challenge in Ghana. Research has shown that there is an increased chance of water contamination when transported from the point of collection to point of use. 25
Oforikrom Municipality is one of the most populated urban areas in the Kumasi Metropolis of Ashanti region, Ghana. In the municipality, potable water requirement is on the rise due to an ever-increasing population. The Barekese Water Treatment Plant (WTP) of Ghana Water Company Limited (GWCL) supplies piped water to several communities within the Oforikrom municipality. However, the rapid population growth of communities in the municipality together with infrastructure constraints of GWCL has resulted in irregular and intermittent water supplies. In some instances, a lack of water for households. This situation has compelled some households to resort to the use of alternative water sources to complement the deficit of safe water supplies. 21 These sources are mostly comprised of groundwater/wells, public standpipes, tanker truck water supplies and packaged water. However, the water quality, the household water quality management practices and the safety of these water sources in the Oforikrom municipality are not reported in the literature.
In view of this, this research seeks to ascertain the water quality aspects of all drinking water sources in the municipality. The outcome of this study will produce information that will aid in the strengthening of systems, including capacities, for water quality monitoring and management both at the source and at household levels.
Materials and methods
The study area
The area of study was Oforikrom Municipality within the Kumasi Metropolitan Area, Ashanti region, Ghana longitude (between longitude 6.35°–6.40° and longitude 1.30°–1.35°). Oforikrom municipality is one of the populous urban areas in Kumasi. The municipality covers a land area of 54.1 km2. 26 According to the 2010 population and housing census, Oforikrom has a population of 303,016 people with a population density of 5601 persons per km2. 27 The municipal also has 73,343 households with an average size of 3.9 individuals. 27 Towns such as Ayigya, Adwaase, Kotei, Emena, Deduako and Kokoben are among the popular communities within the municipality.
Research design and data collection
This study covered 70% of the towns in the Oforikrom municipality (Figure 1). The selection of study communities was based on the availability of GWCL supplied water in the community.

Map of Oforikrom Municipality showing sampling points in the various towns within the Municipality (Insert Maps of Ghana and Ashanti Region).
Household surveys and laboratory analyses were employed in this study. The survey was employed to acquire germane information on household’s socio-economic characteristics, their drinking water sources and service levels, their perception of drinking water quality, water storage and handling practices as well as the household water treatment option employed to keep water safe for drinking.
The water quality analysis was employed to provide empirical data on drinking water qualities and to understand the levels of deterioration in water quality from the points of collection to the point of drinking
Household survey
Household interviews were used to obtain information on the different drinking water sources in Oforikrom. Open and close-ended survey questionnaires were administered to 100 randomly selected households in the Oforikrom Municipality. The number of households for this study was selected based on the range recommended by the Centre of Affordable Water and Sanitation Technology (CAWST). 28 One Hundred randomly selected households participated in the survey. According to CAWST, a sample size between 44 and 100 households is adequate to get representative information on water quality within an area with more than 20,000 households.
The household survey questionnaires captured basic demographic information including gender, age, marital status and employment status of household heads. It also considered household water sources, drinking water quality management practices, water accessibility and availability and consumer’s perception of drinking water quality at the household level. Approximately 20 min were spent administering to each respondent. Interviews were conducted in Twi (a popular dialect in Ashanti Region of Ghana) and responses were recorded and translated into English. The water source classification in this study was based on the classification framework of the Ghana Living Standards Survey Round 7 (GLSS 7). 19 The questionnaires were administered in the softcopy form using KoboTool Box phone application and analysed using Microsoft Excel 2019® and GraphPad Prism 6.0 software.
Water sampling
This involved the collection of drinking water samples for laboratory testing. The water samples were collected from the surveyed households and were sampled between February and March 2020. To have a fair representation of household water quality, three sampling episodes were carried out at every sampling point at 2 weeks intervals.
Consent was obtained from each household for the first sample collection, second and third rounds of sampling. Samples were obtained from points of collection (POC) and points of consumption/use (POU) sources for laboratory analysis. The POC samples were collected directly from water sources while samples collected at the point of consumption/use were classified as POU. Table 1 indicates the number of POC and POU sampling points for the various drinking water sources. In total, 52 POC and 97 POU triplicate samples were analysed in accordance with APHA’s and CAWST recommended protocols for water sampling and laboratory analysis.28,29
Number of POC and POU sampling points for the various drinking water sources.

CPWS: community piped water system.
Note: Triplicate samples were obtained at each sampling point.
Sample collection
At each sampling point, separate water samples were collected for microbial and physicochemical analyses except for sachet and bottled water which were collected as packaged (mostly 500 mL). Water samples for microbial analysis were collected into 150 mL sterilized glass bottles and while samples for physicochemical analysis were collected into 500 mL clean plastic bottles. Water samples were then transported to the Environmental Quality Laboratory, Civil Engineering Department, KNUST in an ice chest containing ice freezer packs for analysis. Precautionary measures were taken into consideration during the sample collection, preservation and transport to prevent cross-contamination. To ensure that the integrity of the samples was maintained, they were analysed within 6 h of sampling for microbial quality and 24 h for physicochemical analysis.
Sample analysis
Water samples were analysed for physicochemical parameters such as pH, turbidity, total dissolved solids (TDS), electrical conductivity (EC), alkalinity, total hardness and calcium hardness. The pH, TDS and EC levels were measured using HANNA portable multimetre (model HI 9813-6) while HANNA HI 93414 was used to determine the levels of turbidity. Prior to analysis, all the instruments were calibrated with appropriate standard solutions. The alkalinity, total and calcium hardness were determined following the titrimetric protocol described in APHA’s standard methods for the examination of water and wastewater. 29 Physicochemical analyses were carried out on POC samples except for sachet and bottle water samples which were collected from POU sources (Table 1). Membrane filtration (MF) technique was used to enumerate the microbial count in the water samples following standard protocols30,31 Chromocult Coliform Agar (Merck Millipore) was used as the growth support media. The microbial counts were reported as ‘coliform forming units’ (CFU) per 100 mL. Due to high microbial load, water samples collected from GWCL, boreholes, hand-dug wells and CPWS POU sources were diluted prior to analysis. Equation (1) was applied to compute the CFU/100 mL for diluted samples.
Where C = Number of colony count
DF = Dilution factor
The presence of total coliforms, E. coli, Salmonella, and Total Bacteria Count (TBC) in the water samples was analysed.
Health-risk analysis
Health-risk classification of drinking water samples from the various water sources was assessed based on E. coli counts using previous studies and reports as a benchmark.30,32
Data analyses
Water quality data were analysed using GraphPad Prism (version 6.0) and Microsoft Excel 2019® to compute means and standard deviations. The average of the triplicate results was used to represent the value of each water quality parameter at a sampling point. The data were presented in tabular and graphical forms (bar charts). Descriptive statistics were used to describe the data in this study. One-way ANOVA was used to ascertain the statistical difference between mean values.
Limitation of the study
Sachet and bottled water samples at POC were not collected for water quality analysis. This was due to the fact that households did not have a specific point of collection, and during the sampling period some households could not tell the source or vendor from whom the water was bought. Although the contact addresses of the water producers were found on the sachets and bottles, the researchers could not follow up on all the companies to sample water at source due to limited finances.
Results and discussion
Demographic characteristics of respondents
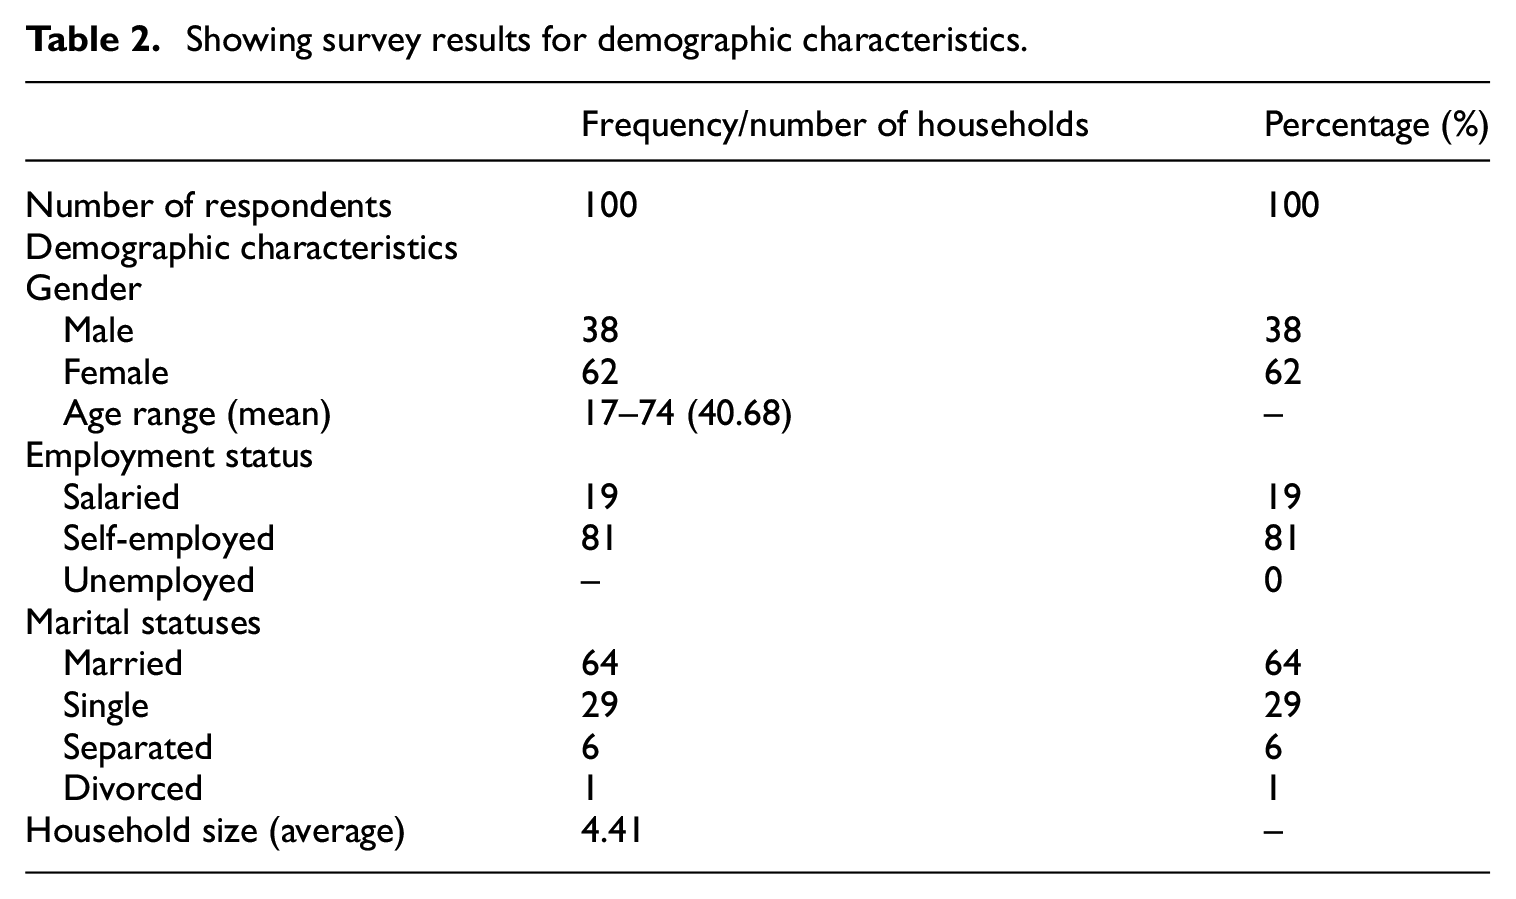
The respondents of the survey were mostly household heads. In the situation where household heads were absent, any household member capable of providing accurate and relevant information on a household’s drinking water was interviewed. Table 2 presents the demographic characteristics of surveyed respondents. The result shows that females (62%) constituted the majority of the respondents. This was preferred because issues around household water are considered as part of females’ responsibilities. Also, males are more likely to work outside of the home and have fewer housekeeping responsibilities. 33 A higher proportion of the interviewees were married (64%) compared to respondents with other marital statuses (see Table 2). The ages of the respondents ranged from 17 to 74 years with a mean age of 40.68 years. An average household size of 4.41 was recorded and this is higher than the municipal household size (3.9) recorded by Ghana Statistical Service. 27 Another demographic information that was captured was the employment status of respondents. The study found that, majority of them were self-employed (58%) and that trading and service are the dominant sources of employment. The remaining respondents were salaried workers either employed in the public sector or by private firms.
Showing survey results for demographic characteristics.
Water sources used for drinking
The water sources are grouped according to the GLSS 7 groupings. The proportion of the various drinking water source types is presented in Table 3. The survey revealed that sachet water was the main drinking water for many households, accounting for 46% of all drinking water sources. Apart from this source, many households preferred pipe-borne water (34%) to other water sources such as borehole/tube well (13%), protected hand-dug well (3%), bottled water (3%) and water tanker (1%). In the case of pipe-borne water, water consumption from ‘public standpipe’, ‘piped into dwelling’, ‘piped outside dwelling but on premises’ and ‘pipe-borne outside dwelling but one neighbours’ compound’ constituted 18%, 4%, 10% and 2%, respectively (Table 3).
Main and supplementary sources of drinking water used by households.
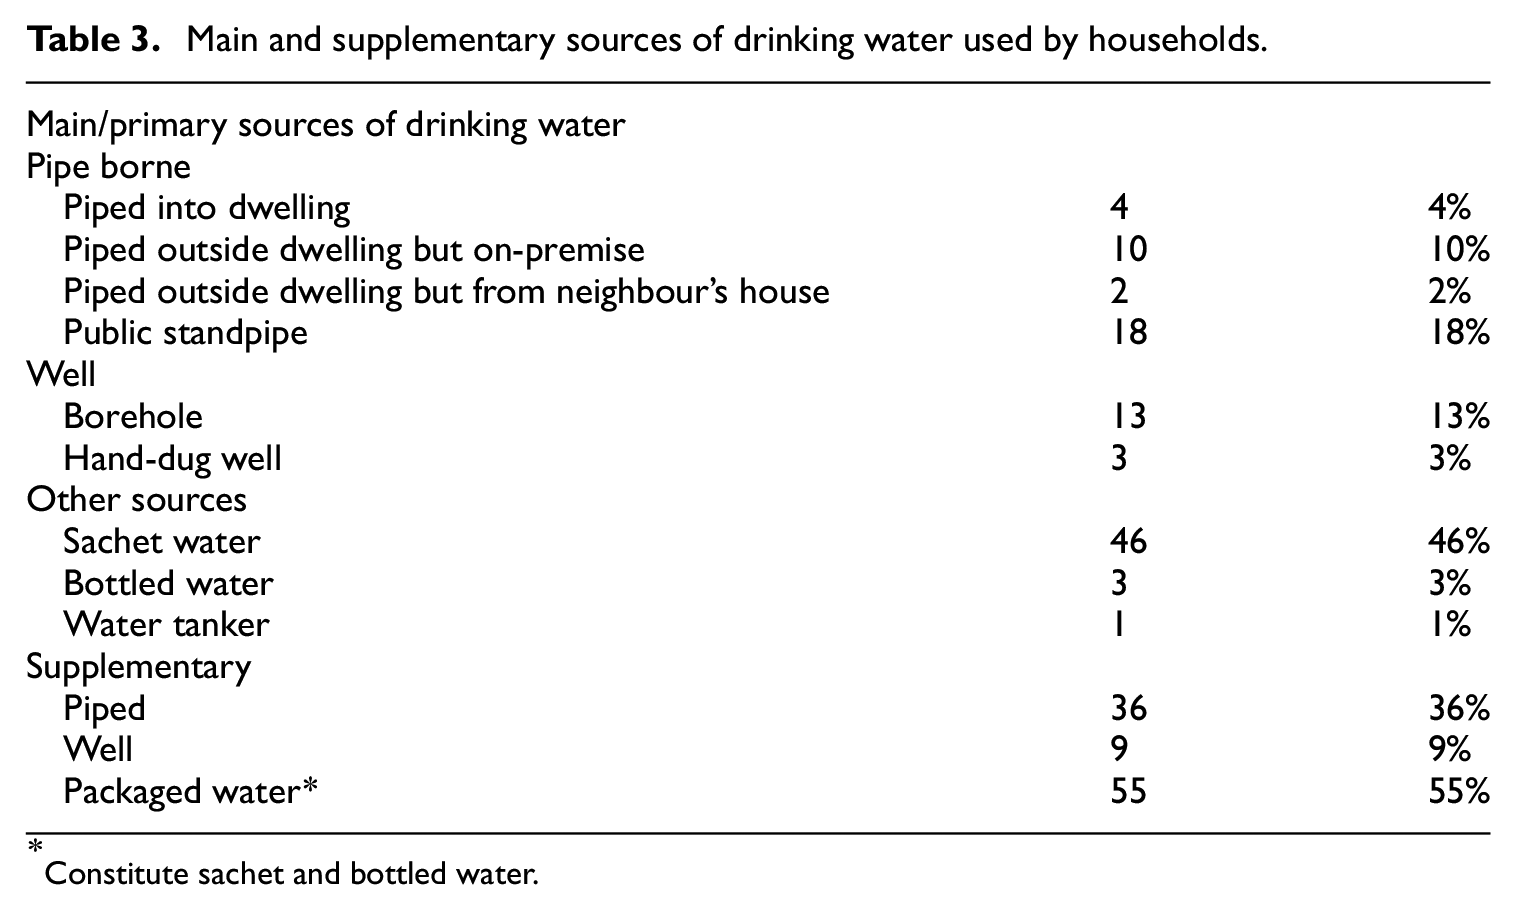
Constitute sachet and bottled water.
Household reliance on sachet water as their primary drinking water source, followed by piped water was consistent with the results of the Ghana Living Standard Survey 7. 34 The GLSS 7 reports that a greater proportion of residents in the Ashanti region prefer sachet water (33.8%) to all other drinking water sources. This observation may be attributed to the ubiquitous 35 and low-price nature of sachet water. 36 It also affirms the claims that sachet waters have emerged as an alternative drinking water source for households with or without piped connections.37–39 The high preference for sachet water is partly due to the unreliable nature of public water supplies. 36 Safety, taste, hygiene and purity, may probably be amongst various reasons for sachet water preference by households. The results, however, contradict earlier study by Salifu et al. 22 who found high household dependence on groundwater sources in Ahenema Kokoben.
As an alternative drinking water source, packaged water was still preferred (55%) by the majority of households, followed by pipe-borne water (36%) (see Table 3). Only 9% of the households sourced their supplementary drinking water from groundwater sources such as boreholes (8%) and protected hand-dug well (1%). This result slightly departs from that of Stoler et al. 33 who observed that most households in Ashaiman rely on public standpipe (46.3%) as their alternative source of drinking water.
Availability and accessibility
The respondents showed informed views about drinking water availability (reliability) and accessibilities. The participants (72%) reported to have drinking water available all the time (i.e. all the days in the week) whereas 24% had irregular supplies of drinking water (Figure 2). In this study, the registered proportion of households with water available at all times (72%) is close to the reported data by the Multiple Indicator Cluster Survey (MICS), 24 where 89% of households in Kumasi have drinking water available when needed.

Availability of drinking water when needed (a) and the number of days for households with irregular water supplies (b), n = 24.
For households with intermittent drinking water supplies (n = 24), (50%) had drinking water available 6 days in a week 25% had drinking water available in 5 days, 17% had water available in 4 days (17%) and 8% had water available in 3 days. Household with intermittent water supplies either sourced their water directly from the public utility company (GWCL) or via public standpipes. Water availability at standpipes is usually determined by the presence of water vendors or operators at the post. None of the households had their drinking water available in only a day or two in a week (Figure 2).
To meet the SDG target for safely managed drinking water, one of the indicators is that, the source should be located on premises. 10 With regards to water accessibility, the survey showed that 35% of the households in the study area had their drinking water source available on-premise, thus easily accessible while 65% had to cover a distance from their respective households to access drinking water (Figure 3). This observation was similar to the data reported by MICS 24 where 40% of the surveyed households had drinking water available on the premises.
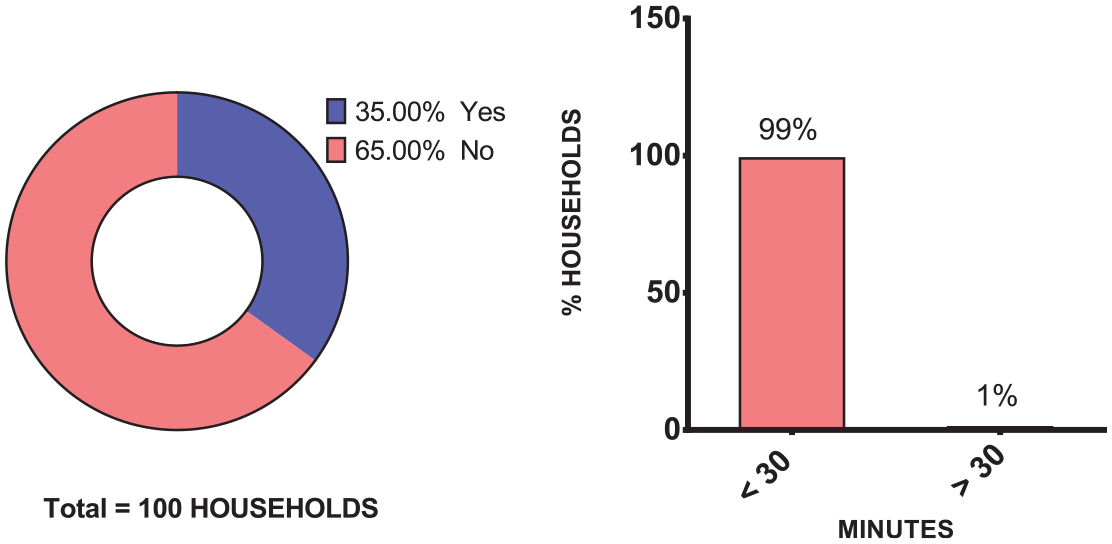
Accessibility of drinking water (for households with their water source within premise) – left; If no, time is taken to access drinking water – right.
Almost all the households (99%, n = 65) without drinking water on premises spent less than 30 min round trip to acquire drinking water (Figure 3), a percentage higher than the proportion reported by MICS (71%) for urban residents. 24 The households in this category get their drinking water from sources such as ‘piped outside compound but on neighbour’s premise’, public standpipe, bottled water, sachet water and water tanker. Though these households by the singular criterion of ‘on premise’ may not meet the ultimate goal of safely managed drinking water, but may have at least the basic service level.
Consumers perception of water quality
The views of the respondents on the drinking water quality of various water sources were documented in this study. The results obtained indicate that the majority of survey respondents largely perceive the different drinking water sources to be of good quality or at least fair. Only a few respondents perceived drinking water from GWCL (n = 1) and sachet water (n = 1) sources to be of poor quality (see Table 4) and thus, not fit for consumption. This impression may have arisen from the presence of substances in the supplied water observed by respondents, which they described as ‘black particles’.
Showing consumers’ perception of microbial water quality of different drinking water sources.
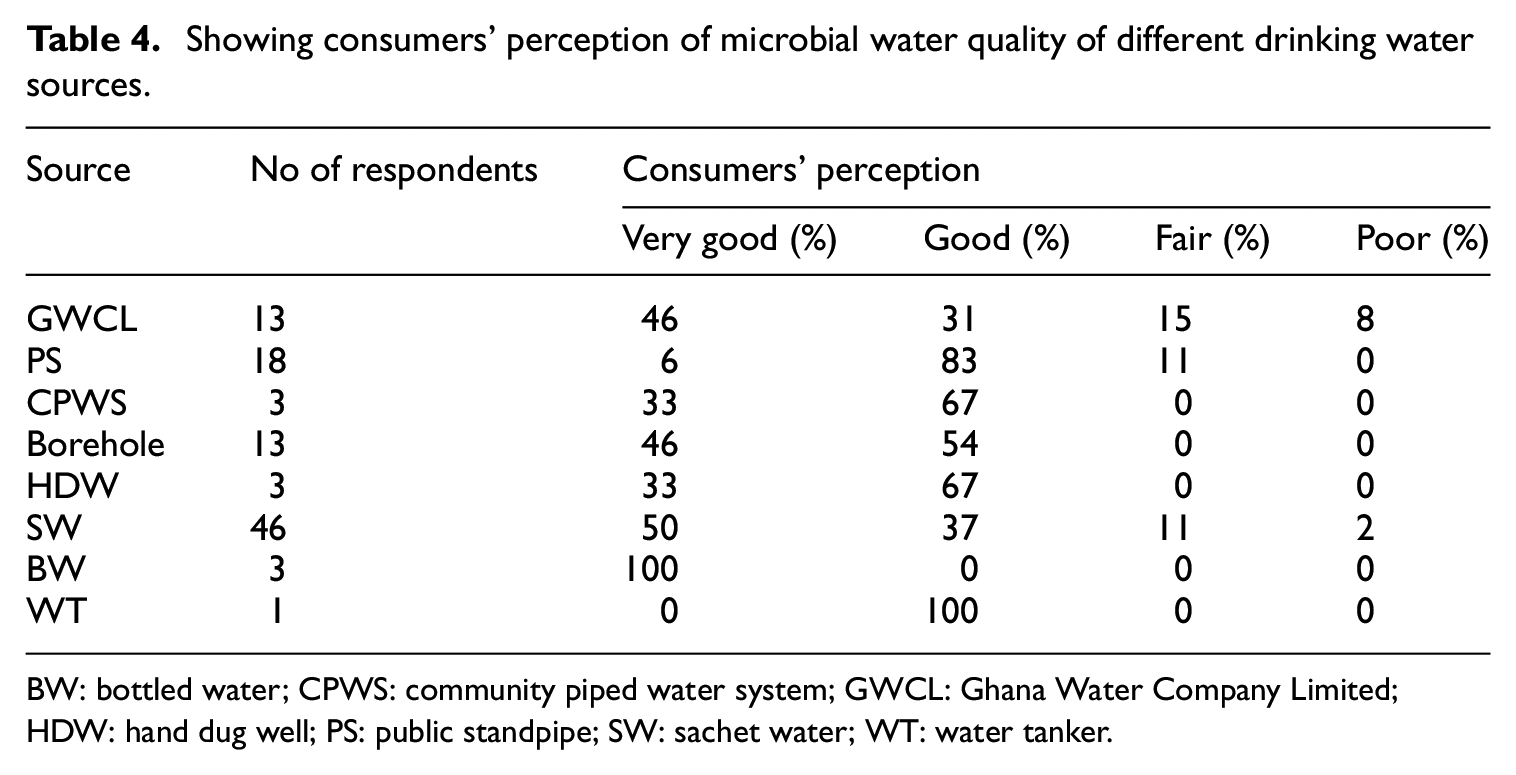
BW: bottled water; CPWS: community piped water system; GWCL: Ghana Water Company Limited; HDW: hand dug well; PS: public standpipe; SW: sachet water; WT: water tanker.
Respondents of a survey conducted by Safoa et al. 40 also shared a similar perception about drinking water derived from packaged sources (i.e. sachet and bottled water) in comparison to piped and other sources.
Assessment of physicochemical water quality
Table 5 presents the summary of results for pH, turbidity, EC, TDS, alkalinity, total hardness and calcium hardness. The results were compared with the drinking water standards recommended by WHO (2017) and the Ghana Standard Authority (GSA).
Physicochemical water quality of the various drinking water sources and WHO/GSA recommended standards for the various parameters.
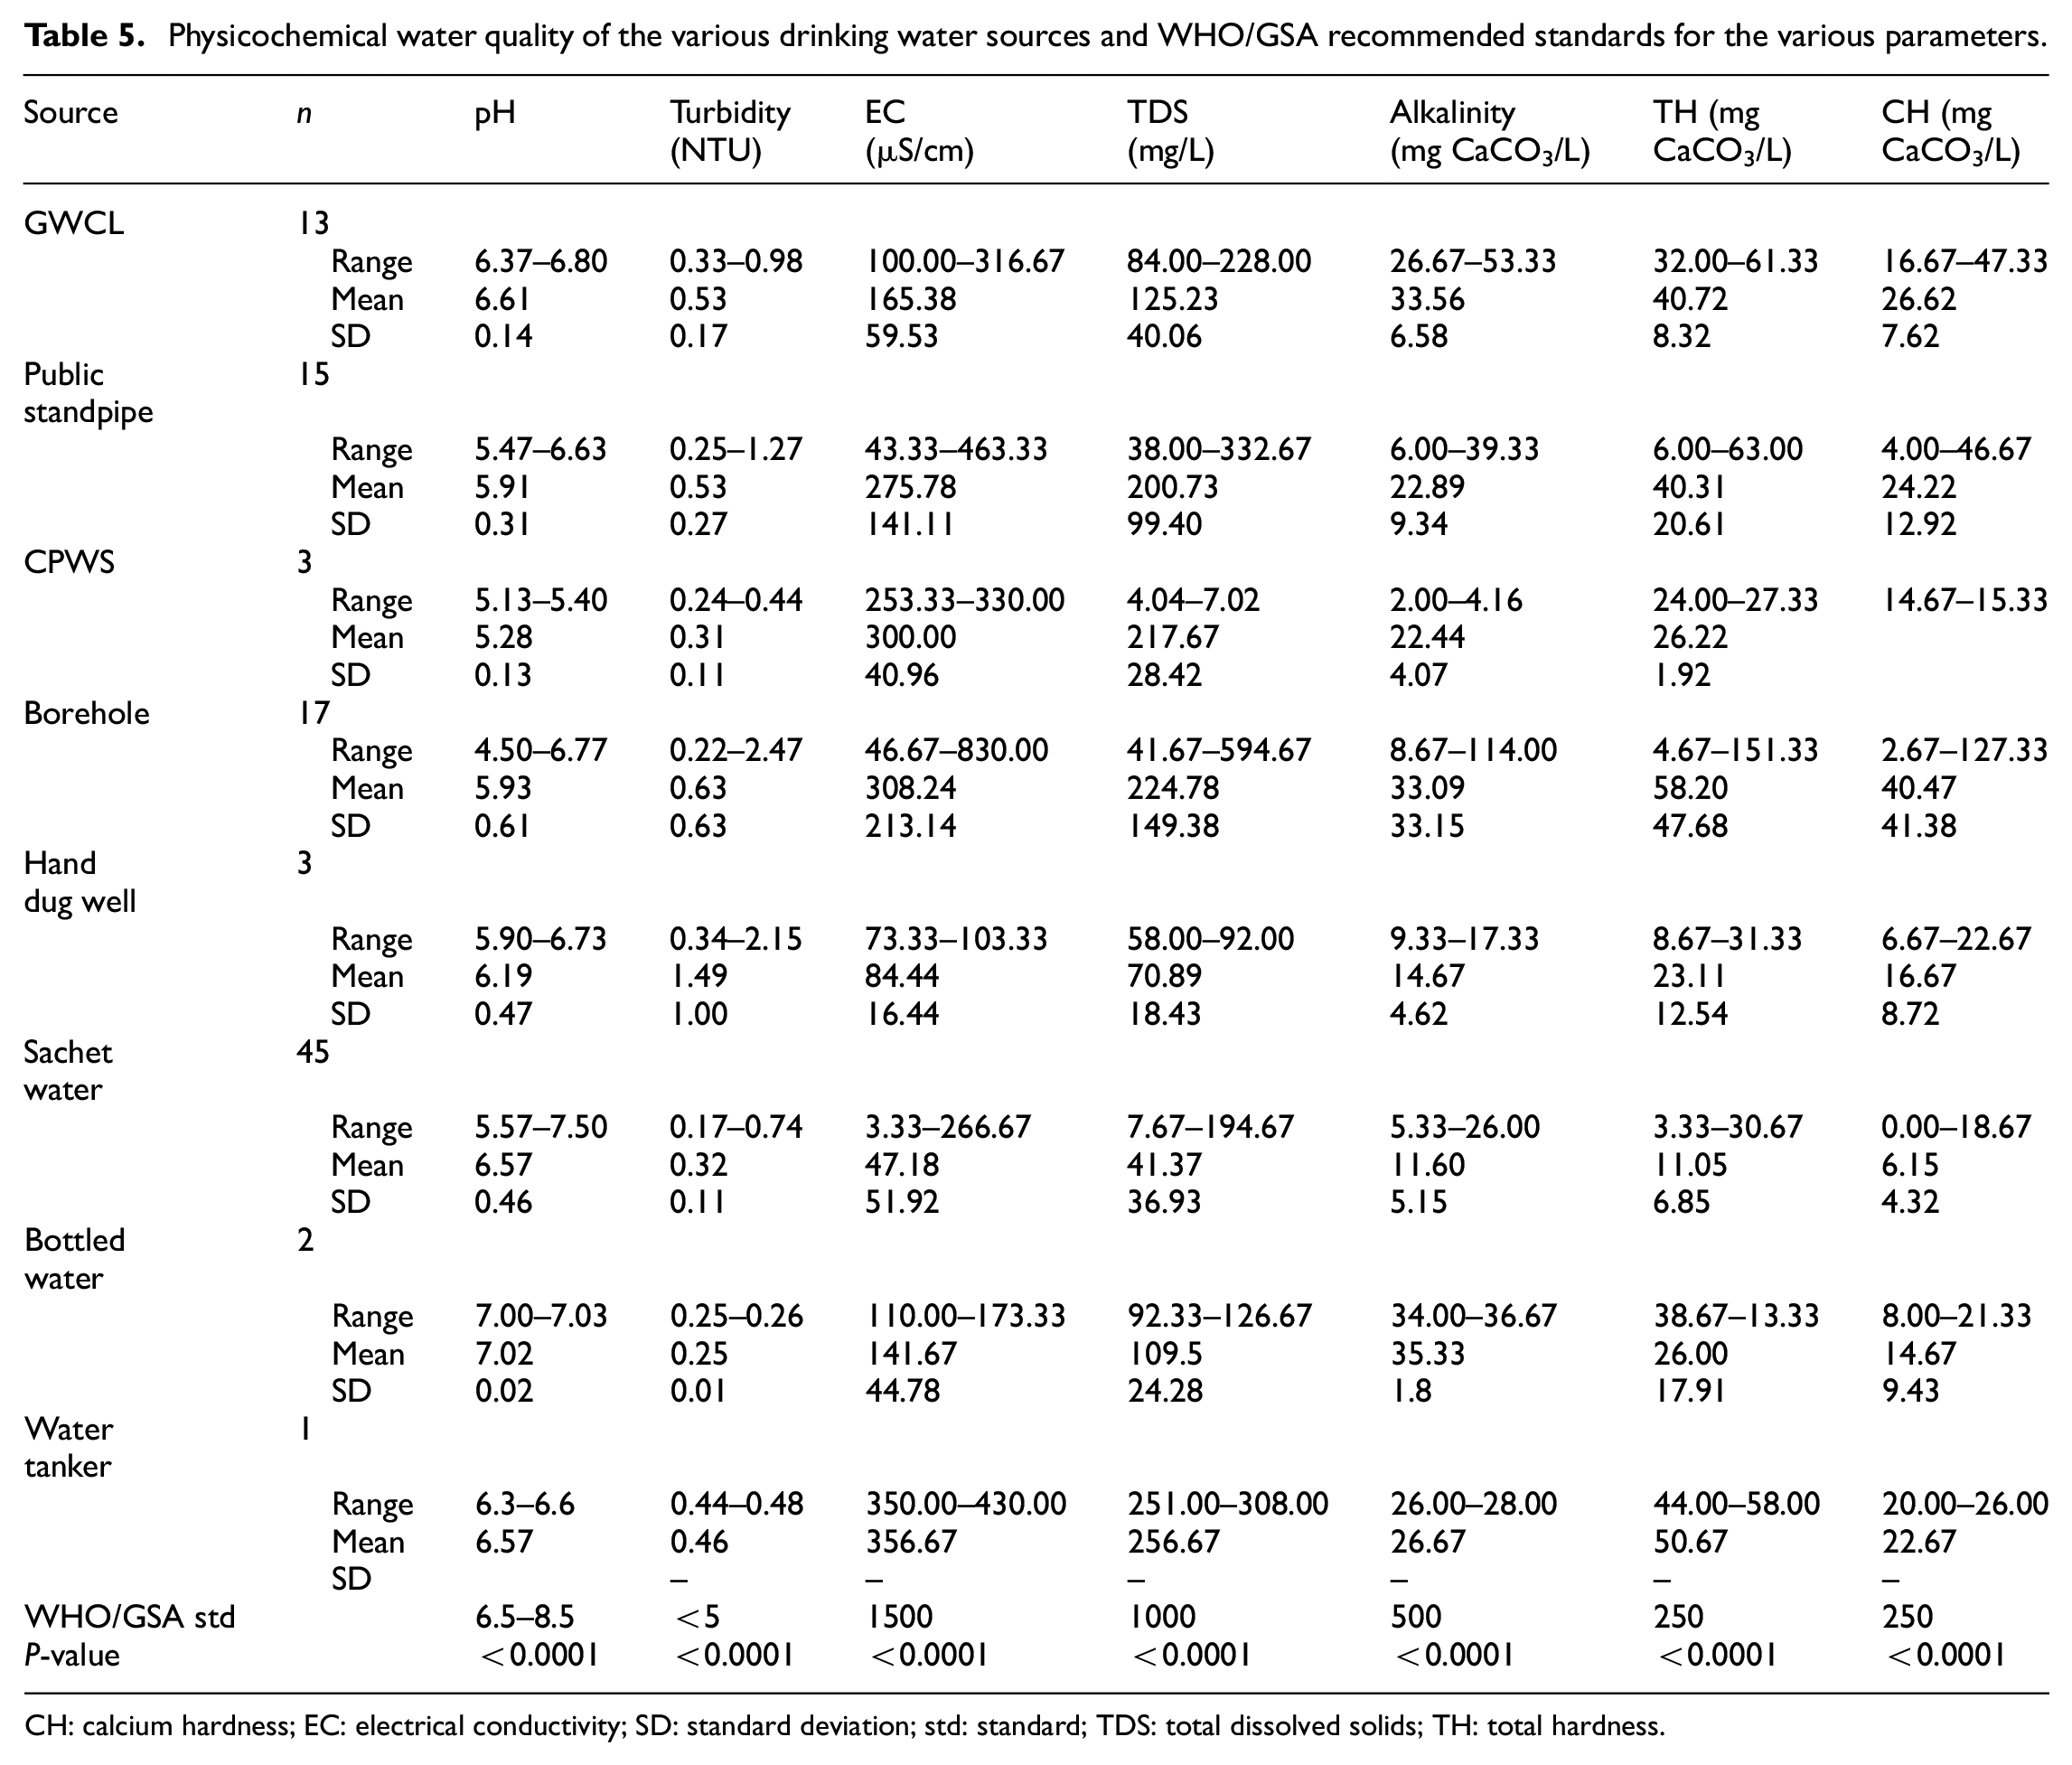
CH: calcium hardness; EC: electrical conductivity; SD: standard deviation; std: standard; TDS: total dissolved solids; TH: total hardness.
This study has shown that the mean pH of sachet and bottled drinking water are more likely to fall within the set threshold for pH in comparison to other sources. Albeit, drinking water from GWCL is somewhat satisfactory at the domestic level with regards to pH (mean value of 6.61 ± 0.14). Generally, pH levels for groundwater resources are known to be acidic in Kumasi. 41 This may probably account for the characteristic lower pH values (acidic) of drinking water from boreholes, hand-dug wells, public standpipes and CPWS (Table 5) as most operators of these water sources get their water from the ground sources. A mean pH value of 6.57 ± 0.46 was obtained for the 45 sachet water samples. In this study, 57% (n = 26) of the sachet water samples recorded mean pH values that fell within the WHO/GSA recommended pH range for drinking water. Addo et al. 42 have also reported a similar observation. According to the study, 60% of sachet water sampled within Kumasi fell within the WHO guideline range. 42 There was a significant difference between mean pH values recorded for all the drinking water sources (p < 0.0001).
The measured turbidity levels for the drinking water samples collected from all the sources conformed to the guideline value (<5 NTU) recommended by WHO/GSA. Turbidity levels recorded for the sachet water samples were lower than all other sources. Although, Addo et al. 43 reported high turbidity (>5 NTU) for some GWCL water samples collected from households in Kumasi. Considering all the water sources, the difference in mean turbidity values was observed to be statistically significant (p < 0.0001). However, the turbidity levels determined for all the water sources can be considered safe for domestic use without any serious adverse health impact on consumers.
In this study, the observed EC and TDS levels of all the water sources were within the permissible limit set by WHO and GSA (EC = 1500 µS/cm and TDS = 1000 mg/L). This suggests that these water sources used by households are acceptable with regard to EC and TDS. Several studies have also indicated the concordance of EC and TDS of drinking water sources in Ghana.15,43,44 This study showed that the highest recorded EC and TDS among all the water sources were 830 µS/cm and 594.67 mg/L respectively (Table 5) which resulted from a borehole. 41 have conferred the high EC value for boreholes in Kumasi. A significant variation was identified to exist between the mean TDS and EC values for the various drinking water sources (p < 0.0001).
Alkalinity levels less than 100 mg CaCO3/L are considered desirable for domestic water supplies. 31 In this study, the alkalinity levels of all the water samples were below 100 mg CaCO3/L except for two-out-of-seventeen borehole water samples. The lowest mean alkalinity level of 11.60 mg CaCO3/L was recorded for sachet water while GWCL water samples recorded the highest mean alkalinity (33.56 mg CaCO3/L) (Table 5). The supply of treated surface water by GWCL may account for the relatively high level of alkalinity. Significant variation was observed between mean alkalinity values recorded for the various drinking water sources (p < 0.0001).
In this study, water from sources such as hand-dug wells, sachet water, bottled water, water tanker and CPWS can be considered as soft in terms of hardness since the highest recorded mean alkalinity levels from sources were lower than 50 mgCaCO3/L. GWCL water samples fell within soft to moderately hard category (Table 5) and this was in congruence with the data reported by Addo et al. 43 For public standpipe, 47% (n = 15) of the water samples were within the ‘soft water’ category whereas 53% (n = 15) can be considered as ‘moderately hard’. Out of the 17 boreholes water samples that were collected for laboratory analysis, 47%, 47%, and 6% were ‘soft’, ‘moderately hard’ and ‘hard’. The highest total hardness was recorded for the water sample collected from water tanker supplies (50.67 mgCaCO3/L) whereas sachet water registered the lowest mean value (11.05 mgCaCO3/L) among the sources. Total and calcium hardness varied significantly between the sources of drinking water (p < 0.0001).
Assessment of microbial water quality
Table 6 shows the microbial quality of water sampled at the point of collection and at point-of-use. It shows that substantial post-collection deterioration occurs. The results demonstrate that the microbial quality of the water sources became significantly worse following collection and storage. Deterioration in water quality was particularly conspicuous in the GWCL supplied water, which exhibited low levels of bacterial counts at the source. The high total bacterial count (TBC) observed in GWCL POU water samples may be due to extended periods of drinking water storage at home due to intermittent supply. Microbial population has been identified to increase with storage time. The difference in microbial quality between POC and POU samples of all water sources was statistically significant except for sachet and bottled water samples where POC samples were not collected for analysis. This means that the storage of drinking water by households leaves much to be desired. The observed difference in water quality could be attributed to the use of unimproved water storage facilities as well as poor water handling and hygiene practices of households.3,45 Similar water quality results were obtained by Trevett et al. 46 who observed significant deterioration in borehole and hand-dug wells water quality following household storage. Elala et al., 45 also observed significant differences in microbiological quality between public tap stands and point-of-use at the 95% level.
Microbial count of POC and POU samples from various drinking water sources and their compliance levels with WHO/GSA standard.
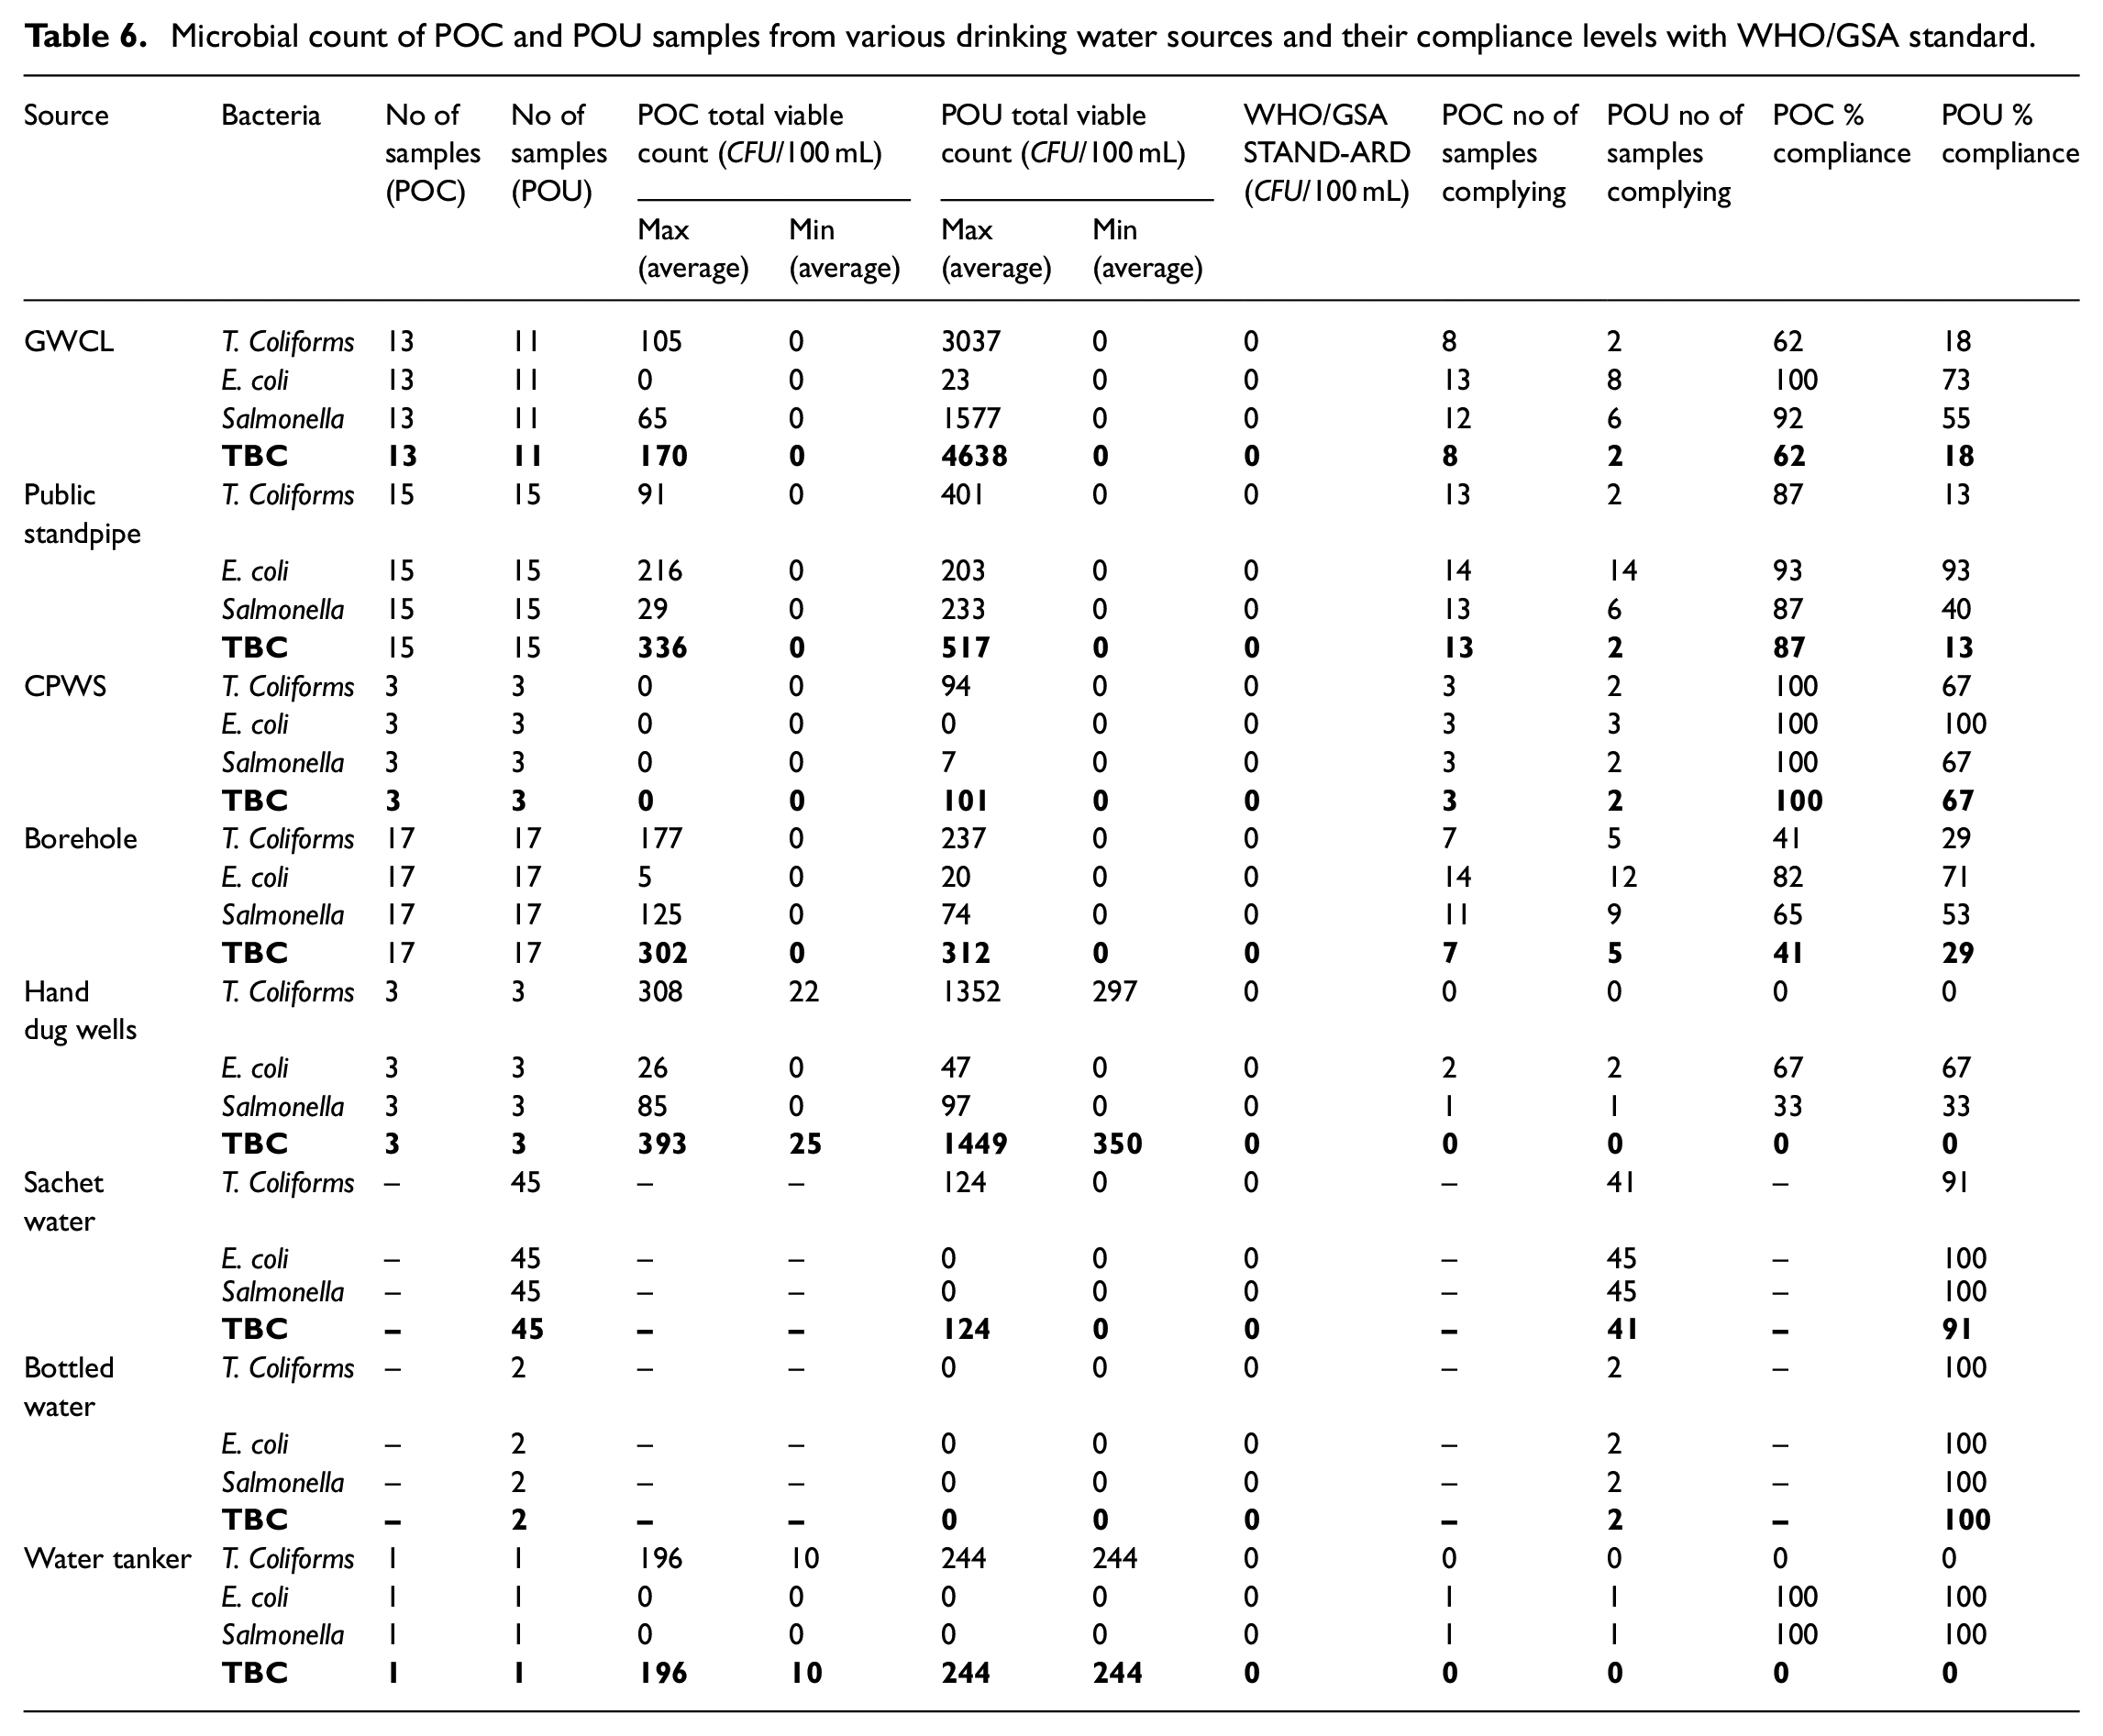
Although no source (POC) sampling was done for packaged waters (sachet and bottled), the microbial quality of these water sources at POU was good, with 91% (n = 2) and 100% (n = 41) compliance levels for sachet and bottled water respectively. The observed microbial quality of bottled and sachet water also confirms the findings by Guzman and Stoler 35 who compared the quality of sachet water to other household water sources in Ghana. Wright et al. 37 also reported that sachet water offers better quality at the household level in comparison to other drinking water sources. This may be the scientific evidence for the ever-increasing demand for sachet water as a drinking water source at home as it is likely to supply safe water.
Our results indicate a substantial reduction in water quality down the supply chain, from the point-of-collection to the point of use. This tends to agree with Trevett et al. 46 that, there exists a constant and widespread problem in the handling of water between collection and consumption resulting in poor quality drinking water.
Risk-to-health classification of the drinking water sources
Using the classification system proposed by WHO and CAWST,30,32 the quality of drinking water samples from the various sources was categorized according to the magnitude of contamination (see Table 7). It provides an illustration of the proportion of water samples that moved from one category of water quality with no risk level to another at the point of use. The results revealed that GWCL POU water samples fell into three classes of ‘conforming’ (73%), low risk (18%) and ‘intermediate risk’ (9%). Water samples (7%, n = 15) from public standpipe fell into the ‘high risk’ category whereas the remaining 93% of the samples followed the WHO guideline value. Household borehole water samples were also classified into three categories, conforming (71%), ‘low risk’ (18%) and intermediate (12%). For hand-dug wells, 67% of the samples (n = 3) conformed to WHO standard whereas 33% fell in the ‘intermediate’ class. Mkwate et al. 32 showed similar results for borehole and hand-dug well water samples collected from households in Balaka District, Malawi. Furthermore, the study confirms the results of Trevett et al. 46 It is evident from this study that some POU water samples from sources such as GWCL, public standpipe (PS), boreholes (BH), hand-dug well (HDW) pose a health risk of faecal coliform contamination even though none of the water samples registering in the ‘very high risk’ category (Table 7).
Results on risk-to-health classification of water sources (POU) compared to WHO standards.

This study, therefore, supports the idea propounded by Williams et al. 47 that policymakers and regulators should recognize the potential benefits of packaged water in providing safe drinking water both away and at home, most importantly for those who are otherwise unlikely to gain access to a reliable, safe water supply. Also, there should be integrated, regulatory and monitoring frameworks that would ensure the quality of packaged drinking water 47 bearing in mind the associated environmental impacts of its production and use 48 in the Municipality.
Household water treatment and safe storage (HWTS)
HWTS is increasingly becoming a popular option for obtaining safe water and most HWTS processes are geared towards the removal of pathogens in water. 28 Response from the survey showed that 6% (n = 6) of the households treated their drinking always while 16% (n = 16) sometimes treated their drinking. In totality, 22% (n = 22) of the households were involved in the treatment of water at the household level. This figure is far below the proportion of households (56%) known to be treating their water in Ashanti region. 19 The results revealed that households surveyed in the study area were actively involved in an in-house drinking-water treatment method such as chlorine addition or the use of water filters. The majority of the households who somewhat practice household water treatment (69%, n = 15) use chlorine tablets for disinfection while few of them, 28% (n = 6) and 3% (n = 1) use filters and camphor respectively to render their drinking water safe for consumption (Figure 4). This results depart from that of the GLSS 7. According to the study, 2.9% and 1.1% of the households in Ashanti region treated their drinking water using chlorine tablets and filtration respectively. 19 The survey revealed that 62% (n = 62) of the households often stored water for drinking. Among the drinking water storage options, a greater proportion of the households (58%, n = 36) used pot-jerry or bucket with a lid. This was followed by bottles and polytanks (16% for both containers, n = 10). About 8% (n = 5) were found to use an open pot or bucket for drinking water storage. It is evident from the results that the majority of households (>90%, n = 57) were actively involved in safe water storage (i.e. stored in container that prevents recontamination) in their respective dwellings (Figure 5). It could be inferred that most households in the municipality are probably well informed on household water quality management.
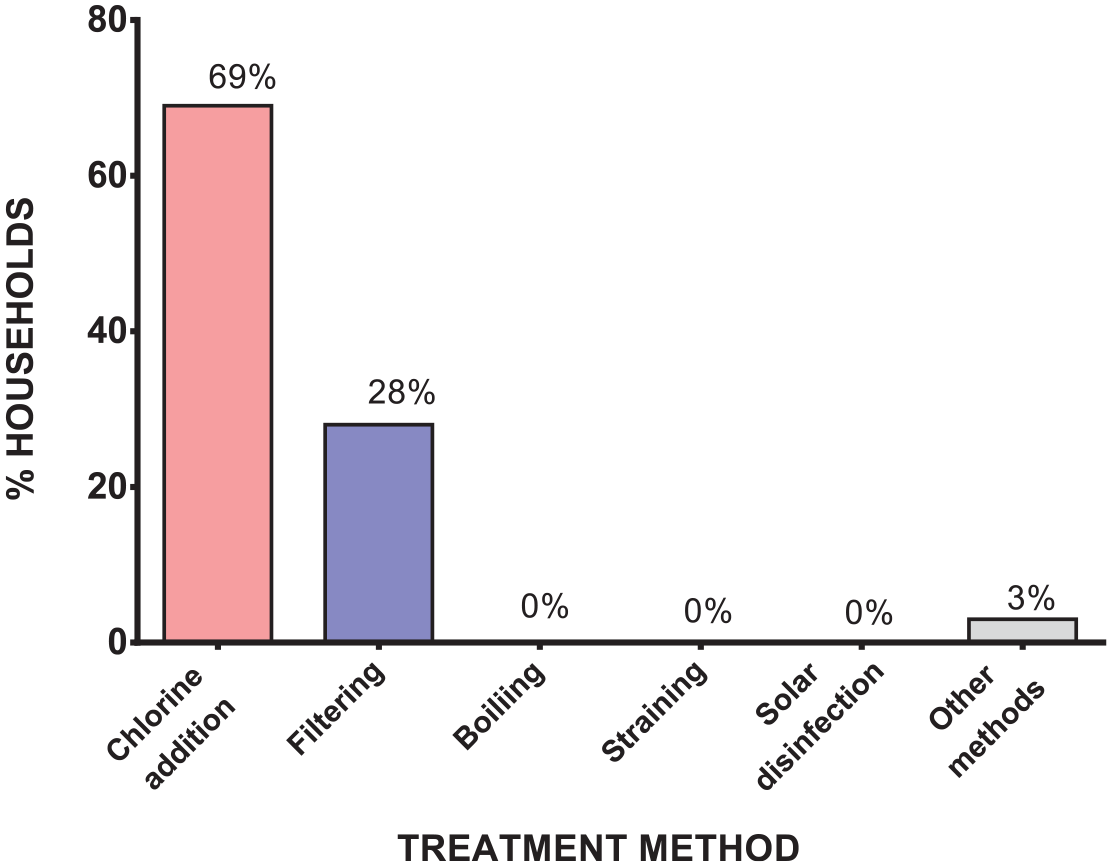
Drinking water treatment methods used by households.

Drinking water storage facilities used by households.
HWTS and microbial water quality
In this study, the satisfactory levels of drinking water sources for households practicing water quality management were assessed. This was carried out by considering the household water treatment methods, drinking water storage and microbial water quality.
The survey revealed that the household water treatment methods commonly employed include chlorine addition and filtration (Figure 4). Most used storage facilities also included buckets with lids, bottles and polytanks (Figure 5). The frequency of treatment also varied from daily, weekly, monthly to quarterly.
In total, 21 of the surveyed households (n = 21) practiced HWTS. Laboratory analysis of water acquired after household treatment and storage revealed that 62% (n = 13) complied and were considered satisfactory whereas 38% (n = 8) still had unsafe drinking water despite following water quality management practices (Figure 6).

Household (%) with satisfactory and unsatisfactory HWTS practices.
Failure for drinking water from households practicing HWTS to comply with WHO/GSA standards may be attributed to the prolonged usage of water filters as microbial biofilms could be formed in these devices which may tend to contaminate water passing through them. The duration of treatment could also account for such observation. Further studies could be carried out on more households practicing HWTS to access the effect of treatment frequencies on microbial water quality.
Conclusion and recommendation
This study showed that sachet water is the most preferred drinking water source by survey respondents. As most households (87%, n = 46) perceive it to have the potential of supplying safe drinking water. Findings from this study showed that microbial water quality is most likely to deteriorate when collected water from sources such as GWCL, public standpipes, community piped water system, hand dug wells and water tanker is transported to the point of consumption owing to improper water handling. Bottled and sachet water showed improved microbial water quality compared to other water sources. Health risk analysis indicated that drinking water samples contaminated with faecal coliforms (E. coli) may pose serious health effects to consumers. Albeit, some households (n = 21) were involved in HWST, 38% were still exposed to contaminated water.
Due to the exposure of groundwater sources to contamination, there should be frequent disinfection of boreholes, wells and storage facilities at homes. Disinfection can be carried out with chlorine-based chemicals to ensure the supply of safe drinking water at all times. To ensure that stored drinking water (for small storage facilities like buckets with lids) is fit for consumption, households should add minute quantities of prepared chlorine solutions to water at the time of storage. Drops of 0.5% chlorine solution can be ideal in this situation. This can be practiced by those sourcing drinking water from public standpipes. GWCL should constantly monitor the quality of supplied water and flush areas where necessary. Further research should be carried out on the efficacy of household drinking water treatment in the Oforikrom municipality.
Footnotes
Acknowledgements
The authors are thankful to the people of Oforikrom for their support. We are also grateful to the laboratory technicians at the Environmental Quality Engineering Laboratory at the Department of Civil Engineering for their assistance.
Declaration of conflicting interests
The author(s) declared no potential conflicts of interest with respect to the research, authorship, and/or publication of this article.
Funding
The author(s) disclosed receipt of the following financial support for the research, authorship, and/or publication of this article: This study was funded by the Regional Water and Environmental Sanitation Centre Kumasi (RWESCK) at the Kwame Nkrumah University of Science and Technology (KNUST), Kumasi with funding from the Ghana Government through the World Bank under the Africa Centres of Excellence project.’ The views expressed in this paper do not reflect those of the World Bank, Ghana Government and KNUST.