
Abstract
Children experience significant number of stressful situations at school during their academic years. The aims of this study were to identify school refusers groups of children through latent profile analysis and to test their associations with school-related sources and manifestation of stress. Data were obtained from 755 schoolchildren (8–11 years) from public and private schools of Alicante and Murcia (Spain), using the School Refusal Assessment Scale-Revised (SRAS-R) and the School Situation Survey (SSS). In general, positive and statistically significant correlations were identified between school refusal behavior and school-related sources and manifestations of stress. School refusers groups were derived from the combination of high and low scores in the four functional conditions assessed by the SRAS-R. “Low School Refusal Behavior Profile,”“School Refusal Behavior by Positive Reinforcement Profile” and “Mixed School Refusal Behavior Profile” were identified. The percentages of children within these profiles were 47.7%, 46.6%, and 5.7%, respectively. The Mixed School Refusal Behavior Profile was the group with the highest average scores in the school-related stress factors. In contrast, the group with the lowest mean scores was the Low School Refusal Behavior Profile. By comparing the Low School Refusal Behavior Profile with the Mixed School Refusal Behavior Profile, the largest effect sizes were found. Findings are discussed from a socio-ecological perspective considering the school context conditions as key elements in the development of school refusal behaviors.
Introduction
Difficulties handling school situations that may generate stress and anxiety, such as giving speeches, academic challenges, or social interaction, can lead to students’ negative behavior for school attendance. Reasons for school non-attendance differ greatly, from excused absences (e.g. illness, health condition, or medical appointment), to school refusal behaviors including individual domains (e.g. fears, anxiety, rule-breaking behaviors), but also contextual factors (e.g. interactions with teachers or peers, parent-child relationships, school climate, or community context). 1
A model that may be useful for classifying students with School Attendance Problems (SAPs) depending on the reasons for school refusal behavior includes functional analysis. This model proposes four possible reasons to avoid going to school 2 : (1) avoidance of stimuli that provoke negative affectivity, (2) escape from aversive social and/or evaluative situations, (3) pursuit of attention from significant others, and (4) pursuit of tangible rewards outside of school. In the first two functional conditions, SAPs are maintained by negative reinforcement (e.g. avoiding school situations that cause discomfort or avoiding oral or written tests). In the second two functional conditions, SAPs are maintained by positive reinforcement (e.g. temper tantrum to get attention or staying home to play video games).
Several studies have identified different groups of school refusers from the combination of the four functional conditions mentioned above, but mainly in adolescents.3,4 Among the most common profiles are: the Mixed profile with high scores in the first three conditions combining negative and positive reinforcement conditions; the High profile characterized by elevated levels on all four functional conditions; the Negative reinforcement profile more purely motivated by negative reinforcement or a combination of the first two functional conditions; the Positive reinforcement profile based on positive reinforcement or a combination of the second two functional conditions; and finally, the Low profile which is a non-problematic group with low levels in the four functional conditions.
Research shows that the most maladaptive profiles are the Mixed and the High school refusal behavior profiles which have been associated with high levels of internalizing problems, poor social functioning, and the presence of psychopathological symptoms.3–10 As it has been mentioned, most of the variables related with these profiles have been focused on individual factors. However, from a socio-ecological approach, not only do personal variables have an impact on this behavior, but also some characteristics of the immediate environment (e.g. family, school) and broader contexts (e.g. socio-cultural situation) are essential.11,12 Poor support from teachers, 13 worse perception of family functioning, 14 or exposure to violence 15 have been associated with school refusal behaviors. Special attention must be paid to minority youth (migrants and minority ethnic groups) whose sociocultural situation shapes not only the child behavior, but also the expectations of the adults surrounding the child facing a vulnerable transcultural situation.16,17 School personnel’s attitudes toward school refusers with transcultural background can affect students’ access to care and shape social inequalities due to misunderstandings (e.g. little practical experiences with migrants’ parents, communication difficulties, lack of training in transcultural issues, prejudices, and stereotypes). 18 Cultural and identity issues from students with school refusal at the individual, family and collective levels are essential to avoid misunderstandings and misdiagnose of school refusal as truancy. 19
Among the different contexts in which students participate, the school makes up a significant part of students’ life due to the large number of hours they spend at it. In fact, Spain is one of the countries in which students spend more hours at school compared to the European average. 20 According to the Organization for Economic Cooperation and Development, 21 Spain, with 25% of students who have unjustifiably missed at least 1 day or more of class, continues to be above the average of the member countries of this organization whose rank is between the 19% and 20%. Despite these data, in Spain there are no official public records that allow reliable data to be handled at the national level on SAPs. According to the latest report published on Data and Figures for the 2019/2020 School Year, 22 there is no data on the incidence rates of school absenteeism, although it does include data on school dropout, a problem that could be reduced if school refusal behaviors were addressed during compulsory schooling.
Students with school refusal behavior find it difficult to cope with school-related stressors. 23 According to a literature review on absenteeism, teacher/student conflict, negative perceptions of school, high competition, high teacher control, low teacher support and stringent rules and grading are considered school-related variables associated to school refusal behavior. 24 In the same vein, a more recent empirical study revealed that poor relationships with peers, bad teachers’ classroom management and poor support perceived from teachers, stand out as school risk factors associated with SAPs. 13 However, in the study of Havik et al. 13 only interactions with peers at school and teachers’ classroom management were considered as school-related stressors, controlling individual emotional stability, and parental characteristics variables. To overcome this limitation, Helms and Gable’s categorization 25 proposes a model of school-related stress in which two broad domains can be differentiated: (1) Sources of Stress (Academic Stress, Teacher Interactions, Peer Interactions, and Academic Self-Concept) and (2) Manifestations of Stress (Emotional, Behavioral, and Physiological). Previous studies have found associations between these sources and manifestations of school stress and anxiety problems,26–31 school anxiety,32,33 or test anxiety.34–38 However, it is necessary to know how these two dimensions of school stress are associated with anxiety-based and non-anxiety-based school refusal. Not only will these findings provide, for the first time, knowledge about school’s sources that generate stress, but they will also provide information about the students’ reactions or manifestations to design preventive and intervention measures more in line with their characteristics.
In order to overcome the above-mentioned limitations, this study aims (1) to identify school refusal behavior profiles in Spanish children through a replication study examining if previous findings can be applied to this sample and (2) to analyze their relationship with the sources and manifestations of stress in the school context.
Method
Participants
Participants were selected by random cluster sampling with the geographical areas of the Spanish provinces of Alicante and Murcia as the first level (central, north, south, east, and west), schools as the second level randomly and proportionally selected in each geographic area with a total of 11 schools from urban areas of Alicante and Murcia both public and private, and classrooms as the third level. Specifically, four classrooms were randomly selected, one for each academic year from third to sixth grade of Primary Education. Of the 11 schools invited to participate, 1 decided not to participate and another center from the same geographic area was selected in its place, following the same procedure.
The initial sample consisted of 876 participants. However, 23 (3.05%) were excluded because they did not have the minimum reading level to ensure comprehension of the test, 33 (4.37%) because their parents or legal guardians did not give written consent to participate in the study, and 65 (8.61%) because their answers had errors and/or omissions. Thus, the final sample consisted of 755 Spanish children (50.1% girls) who regularly attend school whose ages ranged from 8 to 11 years (M = 9.6, SD = 1.12). Table 1 shows the sample’s distribution by gender and age. The Chi-square test of homogeneity in the frequency distribution revealed the absence of statistically significant differences between the sex and age groups (χ2 = 2.95; p = 0.39). The middle socioeconomic status was predominant in the sample and none of the participants had psychological, behavioral, or linguistic problems.
Sample distribution across sex and age.

Instruments
School Refusal Assessment Scale-Revised (SRAS-R 39 ). The SRAS-R is a self-report measure for children and adolescents between 8 and 17 years. The SRAS-R assesses the relative influence of four functional conditions of school refusal behavior: I. Avoidance of stimuli that provoke negative affectivity (e.g. “How often do you have bad feelings about going to school because you are afraid of something related to school (e.g. tests, school bus, teacher, fire alarm)?”); II. Escape from aversive social and/or evaluative situations (e.g. “How often do you stay away from school because it is hard to speak with the other kids at school?”); III. Pursuit of attention from significant others (e.g. “How often do you feel you would rather be with your parents than go to school?”); and IV. Pursuit of tangible reinforcement outside of school (e.g. “When you are not in school during the week (Monday to Friday), how often do you leave the house and do something fun?”). Through a seven-point Likert scale (0 = Never; 6 = Always), the scale includes 24 items. The Spanish version of the SRAS-R 40 was used for this study, which is made up of 18 items from the 24 originally proposed. In this study, the coefficients of internal consistency were 0.74, 0.73, 0.79, and 0.71 for each of the four factors, respectively.
School Situation Survey (SSS 25 ). The SSS is a 34-item measure with a 5-point Likert scale (1 = never; 5 = always) that assesses school-related sources and manifestation of distress. It comprises seven dimensions, measuring four factors for school-related sources of distress: (1) Teacher Interactions (TI) (e.g. “I feel that some of my teachers don’t really care about what I think or how I feel”), (2) Academic Stress (AS) (e.g. “I am afraid of getting poor grades”), (3) Peer Interactions (PI) (e.g. “Other students make fun of me”), and (4) Academic Self-concept (ASC) (e.g. “I feel that I learn things easily”); and three factors for manifestations of distress in school: (5) Emotional (E) (e.g. “I feel upset”), (6) Behavioral (B) (e.g. “I talk back to my teachers”), and (7) Physiological (PH) (e.g. “I feel sick to my stomach”). A high degree of stress is reflected by high scores on the scales. Internal consistency in this study was 0.71 (TI), 0.68 (AS), 0.73 (PI), 0.70 (ASC), 0.78 (E), 0.73 (B), 0.71 (PH).
Procedure
Information about the purposes and procedure of the study were explained to the participating schools. The school principals’ approval and parents or legal guardians informed consent were obtained before filling in the questionnaires. The students participated voluntarily completing two questionnaires in a session of 30 min. The application of the tests was carried out voluntarily, anonymously, and in groups during school hours using written questionnaires. A member of the research team was always present to explain the procedure to the students, as well as to solve any doubts that might arise. The ethics boards of the University of Alicante reviewed and approved this study (reference UA-2017-09-05).
Statistical analysis
First, correlational analyses were conducted using Pearson’s correlation coefficients between the four factors of the SRAS-R and the seven dimensions of the SSS. Effect sizes interpretation were considered small with values of between 0.10 and 0.29, moderate between 0.30 and 0.49, and large for higher that 0.50. 41
Next, Latent Profile Analysis (LPA) was performed to identify the school refusal behavior profiles. The best model was selected in line with the previous literature on the topic and using the following fit indices: the lowest values of the Bayesian Information Criterion (BIC) and the Akaike Information Criteria (AIC), entropy values closer to 1, the Vuong-Lo-Mendell-Rubin Likelihood-Ratio Test (LRT) and the Bootstrap Likelihood Ratio Test (BLRT) p-values smaller than 0.05. In addition, any profile should contain 25 participants or more. Data were standardized before performing cluster analysis (each aggression dimension was standardized separately), and results were interpreted considering that z-scores below −0.5, between −0.5 and +0.5, and over +0.5 indicate low, moderate, and high levels of school refusal behavior, respectively. 42 Thirdly, a multivariate analysis of covariance (MANCOVA) was applied to analyze the differences between school refusal behavior profiles in the scores of school-related stressors’ dimensions incorporating sex and age as control variables, considering its effect size (η p 2) and considering that values near 0.01, between 0.06 and 0.13, and higher than 0.14 indicate low, moderate, and high magnitude, respectively. 41 Following the Scheffé method, post hoc tests were performed when statistically significant differences were found to determine their direction. Finally, we also calculated Cohen’s effect size (d). According to Cohen, 41 values lower than 0.49 indicate a small effect size, between 0.50 and 0.79 indicate a moderate effect size, and higher than 0.79 indicate a large effect size.
Results
School refusal behavior and school-related stress’s correlations
Correlations between the four conditions of school refusal behavior and the school-related sources (Teacher Interactions, Academic Stress, Peer Interactions, and Academic Self-Concept) and manifestations of stress (Emotional, Behavioral, and Physiological) were largely statistically significant and weak (see Table 2). The four school refusal behavior dimensions positively correlated with the school-related sources and manifestations of stress. However, the fourth factor of the SRAS-R showed a negative correlation of low magnitude with the Peer Interactions while a non-significant effect was obtained in most of the other dimensions.
Correlations between school refusal behavior and school-related stress.

SRAS-R-C: School Refusal Assessment Scale Revised for children; Factor I: avoidance of school related stimuli that provoke negative affectivity; Factor II: escape from aversive social and/or evaluative situations at school; Factor III: pursuit of attention from significant others; Factor IV: pursuit of tangible reinforcement outside of the school setting.
p < 0.01. **p < 0.001.
School refusal behavior profiles
Latent profile models containing between two and six classes were tested. The fit indices for each model are reported in Table 3. Although the 4, 5, and 6-class solutions showed lower AIC and BIC values, the 4 and the 6-class solutions were rejected because the LRT index revealed p-values above 0.05 and the 5-class solution due to including a class that did not reach the minimum of individuals. Considering all the criteria, the 3-class solution was selected as the best fitting.
Data fit of all models.
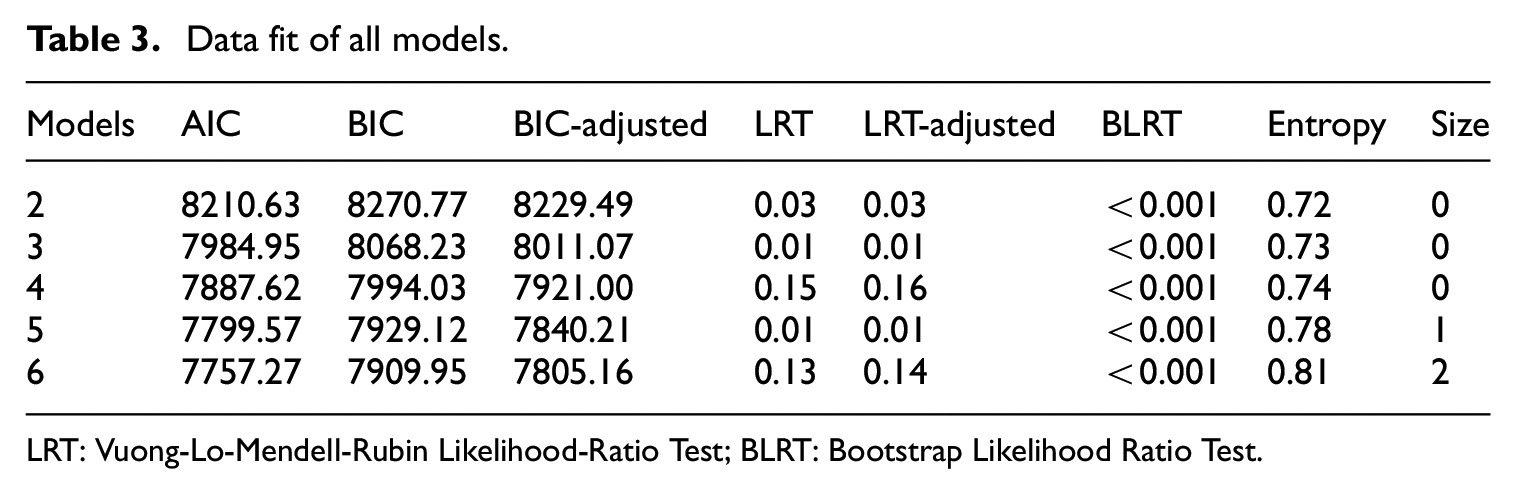
LRT: Vuong-Lo-Mendell-Rubin Likelihood-Ratio Test; BLRT: Bootstrap Likelihood Ratio Test.
Figure 1 represents the 3 profiles of school refusal behavior identified. Profile 1 consisted of 47.7% of the sample (N = 360; 204: girls, 176: 8- to 9-year-old students) and represents individuals with low scores in the four dimensions of school refusal behavior. This profile was named the Low School Refusal Behavior Profile. Profile 2 consisted of 46.6% of the sample (N = 352; 153: girls, 167: 8- to 9-year-old students) and represents individuals with high scores in the school refusal behavior dimensions based on getting positive reinforcements. This profile was labeled as the School Refusal Behavior Profile by Positive Reinforcement. Finally, Profile 3 was referred to as the Mixed School Refusal Behavior Profile due to its high scores in school refusal behavior dimensions based on negative and positive reinforcements and represents 5.7% of the sample (N = 43; 21: girls, 25: 8- to 9-year-old students).

School refusal behavior profiles.
School refusal behavior profiles and school-related stress
A MANCOVA was used to identify differences among the three SRB profiles on the school-related sources and manifestations of stress, after controlling for sex and age. Statistically significant differences were found among the latent profiles in all the school-based stress dimensions (Wilks’ Lambda = 0.788, F (14, 752) = 13.47; p < 0.001, η p 2 = 0.11). Similarly, the effect of the control variables was statistically significant: sex (Wilks’ Lambda = 0.922, F (7, 752) = 8.96, p < 0.001, η p 2 = 0.08) and age (Wilks’ Lambda = 0.912, F (7, 752) = 10.27, p < 0.001, η p 2 = 0.09). The pairwise comparison explained the differences found between the school refusal behavior profiles. Results revealed statistically significant differences of low and moderate magnitude in school-related sources and manifestation of stress scores among the three clusters (see Table 4). The Mixed SRB profile was the group with the highest average scores in the school-based stress factors. In contrast, the group with the lowest mean scores was the Low SRB profile.
Means and standard deviations obtained by the three clusters in school-related stress dimensions.
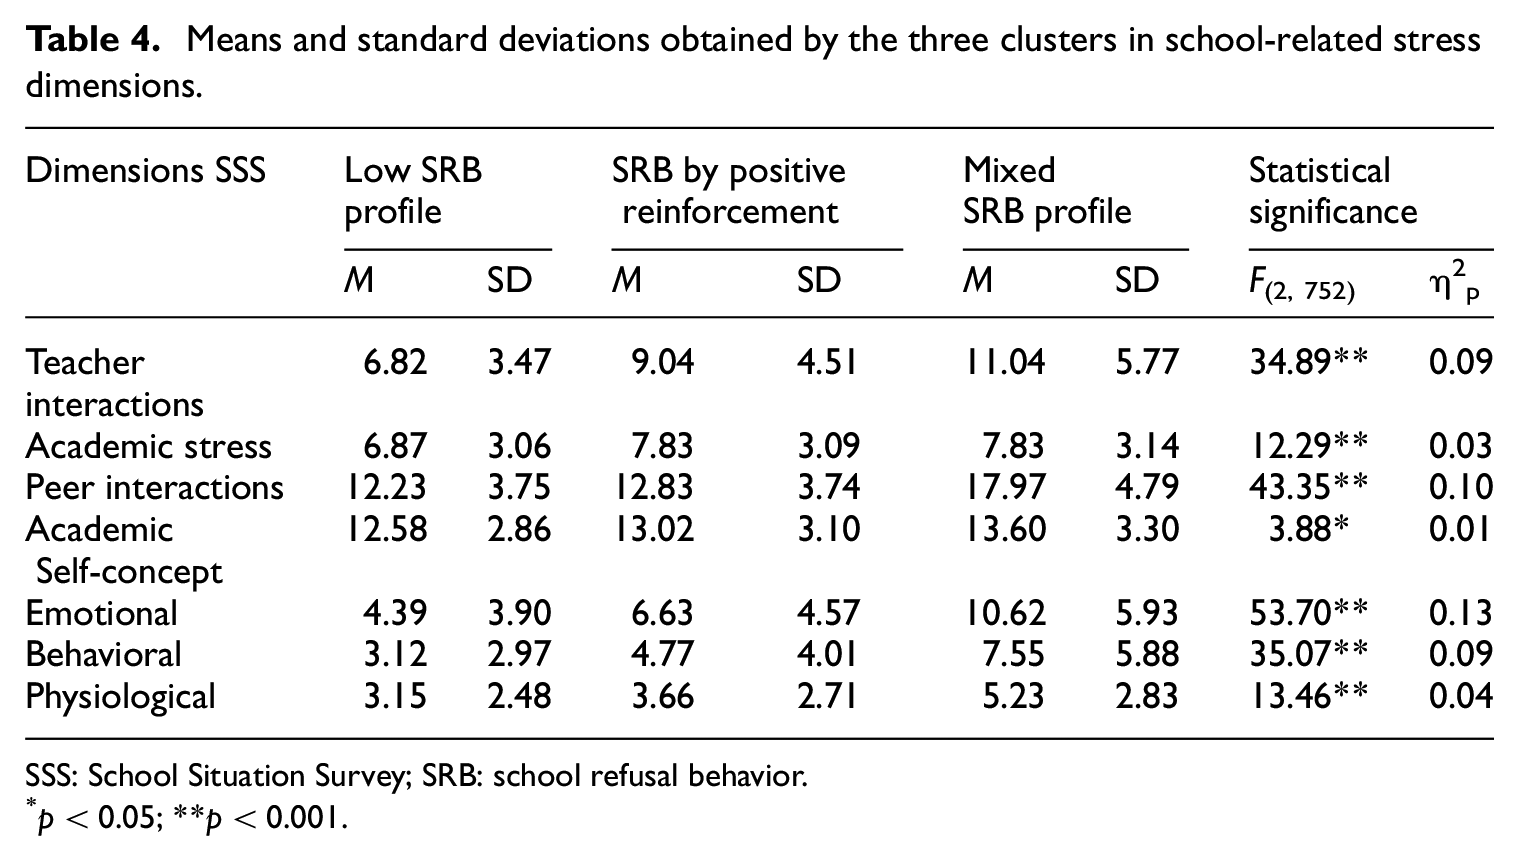
SSS: School Situation Survey; SRB: school refusal behavior.
p < 0.05; **p < 0.001.
Table 5 shows the post hoc comparisons with effect size values ranging from 0.20 and 1.50. The largest effect sizes have been found by comparing the Low SRB Profile with Mixed SRB profile. In this case, the Mixed SRB profile scored higher with a large effect size in all the school-based distress dimensions except for a moderate effect size in Academic Self-Concept and non-significant differences in Academic Stress. In addition, the Mixed SRB profile scored higher than the SRB by Positive Reinforcement profile with large and moderate effect sizes whereas non-significant differences were found in Academic Stress and Academic Self-Concept. Finally, differences with a low and moderate effect size have been found between the Low SRB Profile and the SRB Profile by Positive Reinforcement, except in Peer Interactions and Academic Self-Concept where the differences were not significant.
Cohen’s d value for post hoc contrasts between cluster groups on SSS dimensions.

Profile 1: Low School Refusal Behavior Profile; Profile 2: School Refusal Behavior Profile by Positive Reinforcement; Profile 3: Mixed School Refusal Behavior Profile.
Discussion
Research identifying the school factors involved in causing stress and their relationship with different school refusal behavior profiles may help to identify school risk factors for SAPs. In order to contribute toward this purpose, this study aimed to analyze the relationship between the school refusal behavior and the school-related stressors. To that end, correlations between these variables were established, school refusal behavior profiles were identified and the differences between the profiles in the scores of school-related stress dimensions were tested.
Positive and statistically significant correlations were identified, especially regarding the first three factors of the SRAS-R. This is consistent with previous literature since these dimensions have been associated with different internalizing problems such as anxiety, depression and stress,3,29,45–47 particularly the first two factors (I. Avoidance of stimuli that provoke negative affectivity and II. Escape from aversive social and/or evaluative situations) whose effect sizes were higher than the third factor (III. Pursuit of attention from significant others). In contrast, the fourth factor of the SRAS-R (IV. Pursuit of tangible reinforcement outside of school) did not reach statistical significance in most cases. These findings are in line with the previous literature that indicate the non-anxiety base of this factor.40,46,47
Although considerable research has identified school refusal behavior profiles in the last years,3–7,48–50 no previous studies have applied Latent Profile Analysis (LPA) in Spanish children to identify school refusal behavior profiles from the functional model. LPA was selected because is considered a more precise method for choosing the number of classes that best represent the analyzed data through a formal method 51 and providing the probability for the individuals to be included in the different classes. 52 Three profiles were identified: Low School Refusal Behavior Profile, School Refusal Behavior Profile by Positive Reinforcement and Mixed School Refusal Behavior Profile. These three profiles have been identified in previous studies,3–10 reinforcing the consistency of these groups by replicating them.
Consistent with the previous investigations, the Mixed School Refusal Behavior Profile is the most vulnerable group.3–8 This profile obtained the highest scores in the school-related sources and manifestation of distress. This profile is characterized by combining high scores in the first three functional conditions which are based, fundamentally, on the anxiety generated by certain school situations of a social, academic, and evaluation nature or experiencing separation anxiety. This finding is consistent with the positive and significant correlations found between students with anxiety difficulties and school-related stressors in previous literature.31,33,35 These findings are noteworthy from a practical point of view, highlighting that children with school refusal behavior based on negative and positive reinforcement at the same time not only experience the highest scores in school-stress sources, but also experience the highest levels of emotional, behavioral and physiological manifestations of stress. Fortunately, this group only represents a 5.7% of the sample, being the profile with the lowest number of students assigned. However, they need to receive concrete guidance to reduce the stress and anxiety generated by certain school situations. For instance, the mindfulness-based interventions have revealed significant reductions in stress levels.53–55
For the remaining profiles, although it was to be expected that the Low School Refusal Behavior would be the most representative profile (47.7%) because of the type of a community sample, it is important to note that a very high percentage of students (46.6%) belongs to the School Refusal Behavior by Positive Reinforcement. This group is characterized by pursuing tangible reinforcements outside of school. Despite the fact that this profile did not obtain the highest scores in school-related stress, it would be interesting to know its relationship with externalizing behaviors, such as physical aggression, verbal bullying, defiance, or vandalism since the fourth factor of the SRAS-R has been associated with externalizing problems.39,46,47 It is also remarkable that more girls formed the profile of Low School Refusal Behavior Profile, whereas the School Refusal Behavior Profile by Positive Reinforcement contained more boys. Thus, the classification of boys and girls in each profile suggests that school refusal behavior in boys is more based on obtaining positive reinforcement outside the school (e.g. access to television, video games). In this sense, prevention and intervention programs need to attend to such differences to increase treatment effectiveness.
Comparing the different school refusal behavior profiles, the analysis of effect sizes revealed similar trend to the previous studies. In fact, when comparing school refusal behavior profiles with high scores in positive and negative reinforcements (e.g. Mixed or High School Refusal Behavior profiles) with profiles characterized by low scores in school refusal behavior (e.g. Low School Refusal Behavior Profile), large effect sizes are found in terms of internalizing problems like school anxiety, social functioning, anxiety, depression, or stress,3,10,14 as well as school-related stress in this case. Thus, special attention should be given to this school refusal behavior profile with a more maladapted pattern, reducing internalizing problems levels and improving school context conditions in order to avoid stressful situations and managing manifestations of stress.
The current paper reinforces the relevance of studying risk factors for school attendance problems from a socio-ecological approach. 56 The idea that school absenteeism not only depends on individual characteristics (e.g. personality, social skills, self-concept) but also variables belonging multiple ecological contexts (e.g. school, family, cultural context) is decisive.57,58 Bronfenbrenner’s ecological approach states that human development is based on continuous interactions between the person and the elements of their environment. That is why it is necessary to investigate the school refusal behavior from a multisystemic approach considering the interaction between multiple contexts. The school is recognized as an important developmental context for both intellectual growing and psychological well-being.59,60 Experiences at school influence every aspect of development during childhood. In fact, negative effects have been associated to chronic absenteeism on both achievement (e.g. reduces math and reading achievement) and socioemotional outcomes (e.g. reduces educational and social engagement). 61 Factors that could reduce school-related stress and SAPs include, but are not limited to, improving the school climate, considering student satisfaction with the school, promoting student decision-making, and programing personalized sessions for certain students.62,63 From parents’ perceptions, emotional and instructional support from teachers, communication between teachers, home-school communication, being valued and having friends, school resources, academic demands, noisy and disorganized classrooms, or frightening teacher behavior are among the most common child’s situations in schools related with school refusal. 64 Moreover, when families belong to minority groups (migrants or minority ethnic groups), school refusal becomes a more complex problem because they may face situations of inequality or misunderstanding like difficulties in having their child’s anxiety-based school refusal detected/diagnosed, due to the school system’s predisposition to treat the attendance problems of immigrants’ children as truancy, and in accessing mental health care and a school support system. 19 As well, school personnel recognize facing ambivalence and difficulties in addressing school absenteeism of children with transcultural backgrounds. 18 These situations challenge their usual strategies and their attitudes can affect children’s access to care, even may lead to misdiagnosis as mentioned above. However, cultural barriers can be overcome through a better understanding of cultural differences developing transcultural theoretical training for school professionals and including the assessment of transcultural dimensions in the research of SAPs.
In addition to the limitations mentioned due to cultural reasons, stereotypes associated with gender can also affect the school refusal management. Previous studies analyzing the relationship between gender and internalizing and externalizing problems associate more internalizing problems with girls 65 and externalizing problems with boys, 66 although gender does not always significantly contribute to the prediction of internalizing and externalizing problems. 67 This premise may have repercussions on adults by showing a predisposition toward boys showing truancy instead of school refusal based on anxiety, ignoring the emotional anguish that both boys and girls can suffer when forced to attend school. In this study, the Mixed School Refusal Behavior profile, usually associated with more internalizing problems,8–10 shows no relevant differences in its sample’s distribution by sex.
Despite the contributions of this study, some limitations are acknowledged. The first limitation is related to the measure of the school refusal behavior. In this study only self-report measures filled in by children were used. Future research should use a more comprehensive data collection process in which different types of information sources (e.g. interviews, behavioral observations) are applied and different informants (e.g. teachers, parents) participate. In addition, considering the sample’s characteristics, other measures, such as the Inventory of School Attendance Problems (ISAP), 68 should be considered. This instrument can be used for early screening of school refusal because is addressed to students who are not already absent in school to a large extent, but show emotional upset, somatic complaints, or other problems when they have to go to or stay in school. Secondly, in this study the profiles are the result of the combination of high and low scores in the four factors proposed by the Kearney and Silverman’s functional model. This well-known model was selected by including anxiety-related or not reasons for school absenteeism and providing a specific assessment tool, the SRAS-R. 69 However, subsequent studies point out as limitations of this model that it does not include somatic and subjective health complaints which are really common in normal population. 64 Taking this into account, it is proposed the formation of profiles based on other models, such as the one proposed by Havik et al. 64 This last model includes: (1) Reasons related to somatic symptoms; (2) Reasons related to subjective health complaints; (3) Truancy related Reasons; and (4) Reasons related to school refusal. However, it is complex to find a single instrument that allows compiling the great variety of causes that may lead to this behavior. 69 Thirdly, the sample’s characteristics, as general population without data regarding students’ absenteeism, may not be representative of students with chronic SAPs or adolescents. We suggest future research to examine the relationship between the school refusal behavior and school-related stressors in older students and with chronic SAPs. However, in this study a community sample has participated, and the results could be useful from a preventive approach identifying the first signs of school refusal behaviors in a community sample of children. Fourthly, although this study has used two well-known measures to assess school refusal behavior and school sources and manifestations of stress, other important risk factors related with school refusal behavior (e.g. internalizing problems, poor social functioning) were not included in the analysis. From a socio-ecological perspective not only the school context is a key element in the manifestation of this school refusal behavior, but also personal experiences, family environment and socio-cultural context should be considered. 70 In this line, future research should use other measures that assess other factors related with the development of this problematic and considering data about socio-economic status of the families (employment, parents’ level of education, or migration) and the ethnicity of children. Finally, given the cross-sectional nature of the study, it is not possible to make causal inferences. This could be solved by carrying out longitudinal studies and using structural equation models.
Despite these constraints, the findings of the present study are relevant since provide new data about the relationship between the school refusal behavior and school sources and manifestations of stress from a wider conceptual framework than in previous research. According to the Helms and Gable’s categorization, the Mixed profile obtained the highest scores in the school-related stress, especially in the teachers and peers’ interactions and the emotional manifestation of school stress. Particular attention should be given to these variables when designing prevention and treatment programs as well as more knowledge about SAPs should be offered to the members of the educational community in order to provide a better understanding of how to support students at risk of SAPs.
Footnotes
Declaration of conflicting interests
The author(s) declared no potential conflicts of interest with respect to the research, authorship, and/or publication of this article.
Funding
The author(s) disclosed receipt of the following financial support for the research, authorship, and/or publication of this article: This research was funded by the Ministry of Science, Innovation and Universities and Fondos FEDER with the grant number RTI2018-098197-B-I00 awarded to José M. García-Fernández and the Project GV/2019/075 awarded to Carolina Gonzálvez.