
Abstract
Bayesian Nonparametric (BNP) modelling can be used to obtain more detailed information in test equating studies and to increase the accuracy of equating by accounting for covariates. In this study, two covariates are included in the equating under the Bayes nonparametric model, one is continuous, and the other is discrete. Scores equated with this model were obtained for a single group design for a small group in the study. The equated scores obtained with the model were compared with the mean and linear equating methods in the Classical Test Theory. Considering the equated scores obtained from three different methods, it was found that the equated scores obtained with the BNP model produced a distribution closer to the target test. Even the classical methods will give a good result with the smallest error when using a small sample, making equating studies valuable. The inclusion of the covariates in the model in the classical test equating process is based on some assumptions and cannot be achieved especially using small groups. The BNP model will be more beneficial than using frequentist methods, regardless of this limitation. Information about booklets and variables can be obtained from the distributors and equated scores that obtained with the BNP model. In this case, it makes it possible to compare sub-categories. This can be expressed as indicating the presence of differential item functioning (DIF). Therefore, the BNP model can be used actively in test equating studies, and it provides an opportunity to examine the characteristics of the individual participants at the same time. Thus, it allows test equating even in a small sample and offers the opportunity to reach a value closer to the scores in the target test.
Introduction
Tests assessing content areas are frequently used in the education systems to evaluate students. Although the tests appear to cover the same content, they do not necessarily allow for a direct comparison, as the questions may differ according to the testing tools. Test equating studies allow a comparison to be made as they can quantify directly comparable student performance. Test equating methods are based on different theories such as the Classical Test Theory (CTT) and the Item Response Theory (IRT).1–4 These two theories differ from one another according to the level of providing assumptions they depend on. The IRT considers the probability of a correct answer given to a test item according to an ability parameter and item statistics. 5 In the CTT, the test score, real score and error score parameters are taken into consideration. 6 Both models have some limitations. These limitations are the dependence on the group and the test in CTT. In IRT, the model is considered as a complex structure, and it is difficult to apply in practice. Measurement precision is the same in CTT, for all individuals regardless of individual characteristics. In IRT, it is calculated depending on the latent properties. 6 Therefore, many researchers argue that the IRT method is superior to the CTT method.6–10 According to the results obtained from test equating studies, there are studies supporting that IRT-based methods give better results than CTT-based equating methods.11,12 However, the good results of IRT approaches depend on the sample size.6,13 In the literature, it is possible to see studies showing that test equating based on CTT gives better results than IRT in small samples. 14 Even among the CTT equating methods, it has been observed mean and linear equating methods give better results in small samples compared to equal percentage equating methods. 15 The Bayesian model, which is based on probability, gives better results than the estimates made according to these theories and provides more detailed information about the research.16–22 The Bayes’ statistical method has a flexible structure and will contribute to the development of educational research. Recently, an equated scores approach applying Bayesian modelling has been used.16,23,14 Bayesian and traditional (classical) approaches both deal with unknown parameters in a statistical model.25,26 In the analysis of the traditional approach, only one parameter is considered as unknown, while in the Bayes approach, all unknown parameters are treated as ambiguous. 21 Therefore, in the approach to the concept of parameters according to classical methods, the parameters are considered to be constant. According to the Bayesian approach, each of the parameters is accepted as a probability variable and is based on obtaining inferential information using previous information.22,26,27 Unlike classical methods, the Bayesian approach gives more relevant posterior inferences by including prior knowledge in the study to quantify certain uncertainties.17,28 The Bayesian approach provides many advantages, and a few are mentioned below:
can be used in complex models that cannot be estimated with classical approaches
to calculate probability within the confidence interval
to include historical information in the analysis when necessary
to analyse cases where there is not a large sample
In addition to these significant advantages, the necessity of meeting the assumptions required for some analyses (such as sample size for many analyses, continuity or smoothing for equating) is eliminated with the Bayesian approach.17,21,29 However, the Bayesian method also has some disadvantages. The most important of these is the selection of the a priori in the model. Choosing an a priori that gives false information can mislead the estimation results. In addition, the presence of too many parameters in the Bayesian model causes confusion and increases calculation costs. 21
The test equating results can also be influenced by variables that belong to individual personalities and situations. These variables constitute most of the information known as a priori in Bayesian statistics. 27 Bayesian approaches are well-defined probability models that allow for observed data and unknown values. Parametric and semi-parametric equating methods are used to convert two or more tests into one result.23,24 Since the Bayes parametric model uses a limited number of parameters, it has some limitations. The basis of Bayes nonparametric models lies in the flexible use of the number of parameters in the models.30–33 Thus, the Bayesian nonparametric model could allow the use of covariates to estimate functions for equating transformations. With the inclusion of these variables in the process, changes occur in the transformation functions, and equating between the categories of variables becomes possible.16,23,24 According to the BNP, the equivalent of the score from the first test in the second test does not have the bijection feature as in the previous equating methods. In the BNP approach, there is considerable difficultly in choosing prior distributions that will ensure the interdependence between response data and covariates. It is very important to select the correct covariates with the BNP model as they can help reduce bias in any model as long as they explain the differences between groups and relate to test scores.25,22,34,35 Age, 34 gender23,24,34 and educational status, 34 type of school,23,24 amount of time the tests are administered,23,24 average school performance,25,35 and grade 25 are the variables generally used as covariates in the literature. Covariates should be carefully chosen to have a significant effect on the selected feature. As the number of categorical variables increases, the number of individuals falling into each category 25 decreases. Therefore, using a less categorical variable or reducing the number of categories may be needed. Covariates in a linear equating method were applied in the classical methods. 34 The observed variables were combined with the past variables of the individual using the linear regression model to create a relationship between the two test scores. To create this model based on the maximum likelihood estimation method, test scores are expected to provide assumptions, such as normality. However, it is very difficult to make this assumption in small samples. Here, using the BNP model could be more useful than using frequentist methods.
In BNP models, covariates are treated as dependent random probability variables. The covariates to be included in the process a priori are the Bernoulli distribution 27 if it is dichotomous, or the Dirichlet distribution can be used if it is continuous and has a range. 23 The Dirichlet process is formed as an extension of the Dirichlet distribution in continuous space. Dirichlet Process (DP) Models play a central role in nonparametric Bayes inferences. 30 One of the biggest reasons for this central role is that there are many variations of the Dirichlet processes. One of the ways of displaying the Dirichlet distribution is Sethuraman’s Dirichlet process definition. The main point in these Sethuraman representations is the definition of a discrete variable related to the location of each function. 18 The effect of the covariates in the distribution of test scores will reveal any dependencies that can be explained using the Dependent Dirichlet Process (DDP), which is an extension of the Dependent Process (DP) model.18,36 In later studies, Barrientos, Jara and Quintana 37 expanded the model and built the Dependent Bernstein polynomial process (DBPP) model. Barrientos et al. 37 discuss two specific cases of DBPP. A dependent stick-breaking process with common weights and predictor-dependent support points was used in this study, known as a single weight DBPP (wDBPP). This model provides a covariate-dependent equation transformation. 24 Thus, the equated test score can be obtained by combining the scores of the individuals with the covariates.
The credible interval used in the Bayes method carries more information than point estimation. 0credible intervals for posterior inferences produced by the BNP method can be summarized with values such as average and 95% credible interval (highest density interval, HDI). The points within this range are more accurate than the points that fall outside. 38
Test equating studies are generally carried out without covariates in classical test equating methods. However, this leads to the conclusion that the individuals who were getting the same score fall in the same category of variables, although they have unique characteristics. For example, for the tests to be equated, the scores of the two students who got 60 points from the first test may differ according to their gender or their attitude to the course. In addition, the scores of a female student who likes mathematics very much and a male student who likes mathematics at a moderate level can be compared. Thus, instead of evaluating only on equated scores as in classical methods, comments can be made on the scores obtained according to the characteristics of individuals. For this reason, including covariates in the analysis can help to reduce measurement errors. Test equating is very important to compare the scores of individuals who took different tests at different times and be able to use the scores interchangeably. Different equating methods are proposed to achieve this. Every equating method has assumptions to meet. The accuracy of the estimates increases as long as the assumptions are provided. Reaching correct estimates may allow a fair comparison to be made for equating, especially in small samples. This research is based on comparing equated scores obtained by the BNP method with the equated scores obtained from linear and mean equating methods in classical test theory in small groups. In the BNP model of this research, two covariate variables were used. The study was carried out using the single group design, in which two or more test papers are applied to the same group. To prevent the bias that may arise from the sample size in the comparison of the methods, mean and linear equating methods, which are less sensitive to sample size, are preferred to the CTT models. The combination of these factors makes this study different from other studies. There is no need to make an assumption about sample size in the BNP model. The 2011 booklet is taken as the equated test, which is also a rescaled test. The difference between the scores obtained by three test equating methods and the target test scores is considered the comparison criterion. Also, in this study, the credible intervals of the equated scores of the BNP model and the differences between the groups were examined as an advantage of the BNP model.
Method
This study compares two approaches, and the aim is to compare the equated scores obtained from the BNP model with the outcomes of classical test theory equating methods. Two different (mean and linear) equating methods are discussed for the classical theory. The distance between the equated scores obtained from mean, linear equating methods and the BNP model to the target test score, were then analysed.
Data used in research
Twenty questions from the mathematics section of the Placement Test (PT, the Turkish acronym is SBS) carried out by the Ministry of National Education of Turkey (MNE) for 8th graders in 2011 and 2012 were used for data collection. The data were obtained with the permission of the ministry. These questions were given to 102 8th grade students in a public school in Samsun in the spring semester of the 2015–2016 academic year. Data were collected using convenience sampling, which is based on ease of accessibility. The sample consisted of 51 female and 51 male students.
In the BNP model, two covariates were used to obtain the equated score: gender and attitude scale towards mathematics. The Attitude Scale towards Mathematics, developed by Önal 39 is comprised of 22 items, consisting of 11 positive and 11 negative questions. The scale is the 5-Likert, where ‘Totally Agree’, ‘Agree’, ‘Undecided’, ‘Disagree’ and ‘Strongly Disagree’ are used and the scale consists of four factors: interest, anxiety, work and necessity. The internal consistency coefficients of the scale’s factors are 0.89, 0.74, 0.69 and 0.70, respectively. Negative items are inverted, and the total score obtained from the scale is used in the study. High scores indicate individuals show positive attitudes and vice versa. 39
In the literature, students’ attitudes towards mathematics are generally evaluated as positive and negative.40–43 Added to these categories, a neutral attitude towards mathematics is also discussed. 44 In this study, attitude towards mathematics is considered as a continuous variable in the analysis process. Representational situations for three different mathematical attitude levels are also included to facilitate understanding, comparison and interpretation of the model.
Data analysis
The equation conditions on the 8th grade’s PT mathematics subtests used in the study are tested for the participants. Equated scores are obtained according to Classical Test Theory equating methods and the BNP model. Total scores are used in equating PT mathematics subtests consisting of 20 questions. Test equation conditions, unidimensionality, the difference between variances and average difficulties, and the difference between reliability were tested, and then the equated scores were obtained. To obtain equated scores in the BNP model, codes were created based on the DBPP model and test equating process in the R.3.2.1 programme using the model proposed by Gonzalez et al.23,24 The equations of the process are:
G represents DBPP, for

In this formulation


and k is a control parameter for the prior distribution.
As Z represents covariate space,

This model, representing an infinite set of beta distributions, states that the test scores have covariate-dependent sample densities. This model can be demonstrable as
Prior distribution specification
The application of the wDBPP model is based on the Makov Chain Monte Carlo (MCMC) methods. For wDBPP,
Here


Posterior inference
All computations were coded and performed in the R 3.2.1 statistical programme. 45 The posterior distribution is given by:
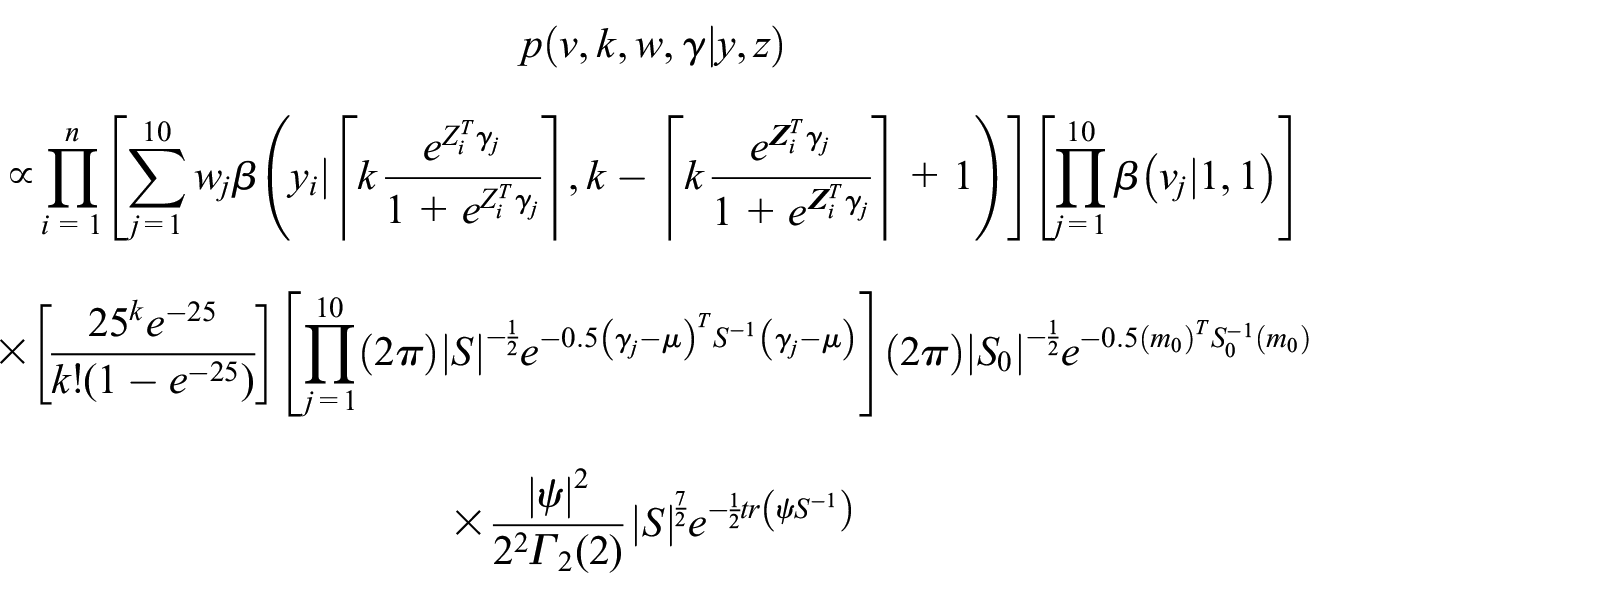
To create a posterior predictive distribution the following was used:

where

This shows the sum obtained for the determined distributions.
To show the T score distributions;

For the two-year exams, the Metropolis-Hastings sampler was used to obtain MCMC samples from the posterior distribution. Initially, 5.000 MCMC samples were taken to assess the sampler’s convergence and tune the sampler to improve acceptance rates. These samples were discarded as burn-in samples. This was followed by taking 110.000 samples from the tuned sampler. All inferences were made using these samples. Summaries of the parameters are given in Supplemental Appendix 2. After sampling, equated scores were obtained by using the cumulative posterior predictive distributions. The codes used in the process for one of the booklets are given in Supplemental Appendix 3. In the study, credible intervals were determined, and the intervals for the predicted scores were examined. The credible intervals were calculated using the 2.5%, 50% and 97.5% quantiles from the posterior instead of the HDI.
Results
The average scores of the test applied in 2011 and 2012 were 59.07 and 57.02, respectively.
Equations based on the classical test theory
According to classical test theory, unidimensionality, difference between variance, average difficulty and reliability of the tests were examined in the equating performed according to classical test theory.
Unidimensionality
As a result of the factor analysis performed for unidimensionality, the Kaiser-Meyer-Olkin (KMO) value obtained from the mathematics subtest is 0.822 for 2011 and 0.772 for 2012. These KMO values indicate that the data is suitable for factor analysis. Chi-square statistics obtained from the Barlett test are significant (p = 0.00 <0. 05) for the subtests of both years. This result supports KMO values and is another indicator of the suitability of the data for factor analysis.
Testing the difference between variances and average difficulties
Levene’s test was used to examine the variance of the tests, and there is no significant difference between the variances of the subtests. To test whether there is a significant difference between the average difficulties of the subtests, the t statistic was used. The difficulty levels of the two subtests were different at a 0.05 significance level.
Testing the difference between the reliability of subtests
KR-20 reliability coefficients for the 2011 and 2012 subtests were computed. The Fisher Z transformation correlation coefficient was converted to the normal distribution’s Z variable, and the difference between the correlations was examined. It was found the subtests for each year had the same reliability.
Examined equation conditions were provided for the classical test theory equating methods. For mean and linear equating methods, the difference between the equated score and score on the target test is shown in Supplemental Appendix 1.
Test equating with BNP model
THIS article uses the BNP model for the test equation, allowing the use of covariates to predict the score distribution, controlling group invariance. Thus, the BNP model for equating does not require the same checking of conditions found in other equating methods. 24 The of the student distributions were obtained according to the covariates used in the model. The points distribution for the mathematics subtests for female students is given in Figure 1, representing the three different mathematical attitude levels. Other distributions can be obtained according to the characteristics of each participant. Figure 1 includes only representative graphs of the three levels. Since the distributions of individuals at the mentioned level will be similar universally, the changes in their distribution in different booklets will reveal the difference between the booklets.

Posterior mean density and 95% posterior credible density intervals for female students showing neutral, positive and negative attitude towards mathematics according to the booklets.
The scores of female students’ attitude levels are concentrated in the middle scores, and the intensity varies according to the year. The score distribution of female students who have a neutral attitude towards mathematics and took the exam in 2011 is more pronounced than the distribution at other levels. Although the distribution of female students who have positive or negative attitudes towards mathematics is similar, the students with a positive attitude towards mathematics are observed to have higher densities in high scores.
In 2012, the density of average scores increased in the distribution of female students according to their mathematics attitude compared to 2011. The density of high scores also increased among female students having a positive attitude towards mathematics. In contrast, the density of low scores increases among those with a negative attitude in the 2012 booklet. Since the score distributions of female students vary according to their attitudes towards mathematics, it can be said that attitude towards mathematics explains mathematical achievement. It should be noted that the score distribution of those who have a neutral attitude towards mathematics remained the same. Since the individuals with the same characteristics showed different distributions in different years, it is possible to comment on the difficulty or discrimination levels of the booklets. In this case, it can be said that the booklet of 2012 contains more distinctive and more straightforward questions for female students.
Credible intervals of the female students’ score distribution varied according to their attitude towards mathematics in both years, but the intervals are generally wide. A wide credible interval indicates uncertainties in the estimates for the values falling in these ranges. These uncertainties can be explained because the participants with specific profiles are not present in the sample or the questions failed to distinguish these individuals.
Equated scores were computed using an equating function after combining the covariates and the scores obtained from the tests. The score distribution was obtained for each sub-group to observe the difference between the booklets. The graphs of female students’ equated scores according to their attitude towards mathematics, representing three levels, are given in Figure 2. This shows that female students who showed negative attitudes towards mathematics in equating among the booklets would get high scores in the target test towards the middle scores and low scores towards the high scores. If they have a positive attitude towards mathematics, their scores in the target test would be higher than the scores from the equated test. However, if they showed a negative attitude, they would show low scores. Considering the distributions and equated scores, the scores obtained in the 2012 booklet were low even if there was a slight difference from the scores in 2011. Therefore, it is possible to state that the booklet in 2012 contained slightly more complex questions than the 2011 booklet. In the 2012 booklet, it was observed that female students who showed positive attitudes towards mathematics increased their probability of getting high scores, while those who showed negative attitudes towards mathematics increased the likelihood of getting low scores. Therefore, we can say that the booklet in 2012 contains more distinct questions in determining the attitudes of female students towards mathematics.

Equating of female students with the BNP model according to their neutral, positive and negative attitudes towards mathematics.
The distribution of male students is shown in Figure 3.

Posterior mean density and 95% posterior credible density intervals for male students showing neutral, positive and negative attitude towards mathematics according to the booklets.
Increased density of high scores was shown by the distributions obtained for male students in the 2011 booklet. When attitudes towards mathematics were positive, this density was higher than for the other booklet. It was observed that male students who have negative attitudes towards mathematics are more likely to have lower scores in the 2012 booklet than in the other exam. Here, it is possible to state that the questions in the 2012 booklet were more difficult for male students compared to 2011. In both booklets, when the attitude towards mathematics was examined separately according to the levels, it can be stated that this variable explains the mathematics achievement as the students’ scores changes. In addition, it is possible to say that this variable can reveal the difference between the exams by creating different distributions according to booklets. When the credible intervals of male students were examined, the graphs showed that the widest range had a neutral attitude towards mathematics. Credible intervals increased at the highest scores for the students who showed positive attitudes towards mathematics and at the lowest scores for the students who showed negative attitudes towards mathematics. It is possible to make similar comments to the deductions made for the female students as to uncertainty due to the width of these confidence intervals. After the distributions with the BNP model were obtained, many different comparisons could be made. Graphs of equated scores obtained by equating between booklets for male students are shown in Figure 4.

Equating of male students with the BNP model according to their neutral, positive and negative attitudes towards mathematics.
The expected scores in the target test were generally lower than the equated test for the male students. In particular, it was possible to see this difference in the high scores for male students who had a neutral and positive attitude towards mathematics. This difference was clear between the middle and low scores for the students who exhibited a negative attitude towards mathematics.
When the distributions and equated scores are taken into consideration, it is possible to say that the exam that was conducted in 2011 was both easier and contained more distinct questions for male students. According to attitude levels, male students have different distributions in both booklets. This shows that attitude towards mathematics was a variable that can explain mathematical success. In addition, it can be stated that this variable partially explains the difference between these booklets because the distributions of male students differed at all levels in the booklets.
The differences between the booklets and groups were obtained by considering the comparability feature of the BNP model according to sub-categories. Based on this information, equated scores were obtained for each individual with different levels of mathematics attitude and gender. In addition, equated scores were derived according to the mean and linear equating methods in the classical test. The distributions of the students’ equated scores by each method are given in Figure 5.
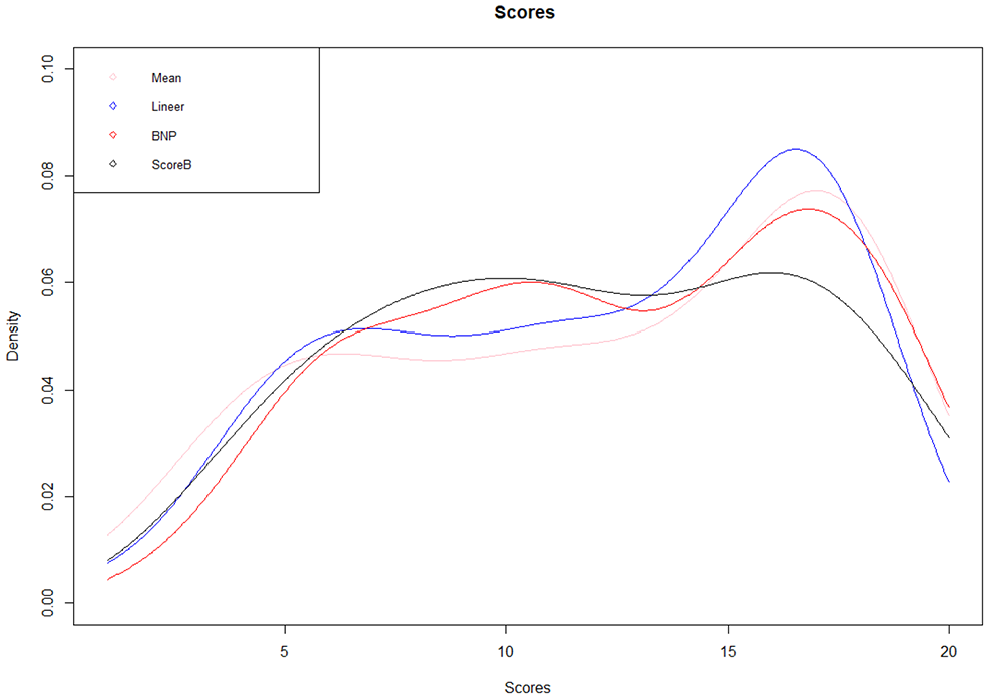
Distribution of equated scores by mean, linear equating methods, using the BNP model and distribution of the target test.
Regarding the densities of equated scores are examined according to three different methods, the standard deviations of the equated scores are:
Conclusion and discussion
More than one form of a test with the same content and statistical features can be used in large-scale studies, mainly to ensure reliability. To make correct decisions about individuals and compare them, test equating was made between these examinations. However, although these tests are called parallel, they differ slightly from each other. In addition, test equating is used to ensure the interchangeability of different examinations applied to the same individuals. 46 Even if individuals with the same characteristics completed these test papers that measure the same structure, a slight difference in the psychometric properties of the tests might cause significant differences in test results. Individuals do not always reflect their capabilities, and the differences in the difficulties of the tests affect these scores. This leads to misinterpretation in the comparison of test results. Therefore, test equating studies are carried out to eliminate comparison errors. Individual characteristics that cause individuals to obtain different scores can be considered as a covariate. The BNP model helps to provide convenient explanations of these differences. The requirement of obtaining booklets with the same level of difficulty and level of discrimination was challenging. The difference between the scores of the individuals is thought to have been caused by the differences in the booklets. Past variables of the individuals can show tolerance of the difference between booklets and make it easier for individuals to compare their scores. Therefore, the second test score could be estimated according to the points that individuals could get in the first test. Thus, the differences between the score obtained from the second and predicted scores can be examined. The estimation methods used in classical methods can also be affected by the characteristics of the group. In this respect, using a model that can make more accurate predictions and provide detailed information by including the characteristics of individuals in the analysis process will be an important step in the test equating process.
In this study, equated scores were obtained using the BNP model, a new approach that facilitates the inclusion of variables in the test equating process. Two different variables were used to describe students’ characteristics. Gender was a discrete variable, and the attitudes of individuals towards mathematics were used as a continuous variable during the analysis. Representational situations were submitted to facilitate understanding and comparing three different mathematical attitude levels–positive, negative and neutral. To make a comparison, linear equating methods and mean equating methods were used from the classical test theory, in which various assumptions are checked before computing equated scores. The BNP model with covariates for the test equation controls group invariance. Thus, the BNP model for equating does not require the same conditions that need to be checked in other equating methods. 24 This research examines the comparison of the BNP model and CTT in test equating in small groups. The combination of these factors makes this study different from other studies. Because of the comparisons, the best results are the equated scores obtained from the BNP model. This shows that the Bayesian model provided better results than classical tests in a small sample. Studies that state that the Bayes method makes better predictions than classical methods and provides more helpful information to support this result.16,17,21
Two advantages of using the BNP model in test equating analyses are shown in this study. First, the BNP model could make robust predictions when assumptions were not met or were missing. Thus, it allowed test equating even in a small sample and provided an opportunity to reach a value close to the target test scores. The second advantage was the simplicity of including the characteristics of the individuals in the model as a covariate. There are many studies in the literature showing that using covariates in the Bayesian approach gives better results and reduces the equating error in cases where the assumptions of the classical theory are not fully met, or the sample size is not sufficient.20,47 In addition, unlike the classical model, using the correct covariates in the BNP model allows the analysis of the characteristics of included variables according to their subcategories.19,20,22,25,34,35
The density of high scores in both booklets was shown to increase among students who had a positive attitude towards mathematics, and the density of low scores increased among students who showed a negative attitude. The high score density of male students was higher than female students, which can be expressed as male students had better scores than female.
Figure 1 shows female students were more successful in 2012, whereas Figure 3 shows that male students were more successful in 2011. This outcome indicates that there may be gender-biased questions in the booklets. Comments can be made about the direction of DIF regarding the distributions. Therefore, the presence of DIF in the booklets can be tested as a result of the test equating performed by the BNP model. The DIF studies in the literature identified unfair questions in 201148,49 and 2012 booklets 50 of the mathematics subtest. Regarding psychometric properties of the booklets, it can be said that the exam conducted in 2011 was more straightforward and the booklet applied in 2012 contained more distinct questions for female and male students.
In conclusion, the results obtained using the BNP model are closest to the target test. More detailed analyses can be performed by including gender and attitude towards mathematics as covariates. This eliminates the negativity arising from accepting individuals with different characteristics similar to occurrences in classical methods. Researchers who want to obtain information about subgroups and research cases where assumptions are not met can carry out equating studies using the Bayesian approach. Many characteristics can be added to the model as covariates. This model allows for the comparison of features such as difficulty and discrimination between booklets.
Supplemental Material
sj-docx-1-sci-10.1177_00368504211028371 – Supplemental material for The comparison of the scores obtained by Bayesian nonparametric model and classical test theory methods
Supplemental material, sj-docx-1-sci-10.1177_00368504211028371 for The comparison of the scores obtained by Bayesian nonparametric model and classical test theory methods by Meltem Yurtcu, Hülya Kelecioglu and Edward L Boone in Science Progress
Footnotes
Declaration of conflicting interests
The author(s) declared no potential conflicts of interest with respect to the research, authorship, and/or publication of this article.
Funding
The author(s) received no financial support for the research, authorship, and/or publication of this article.
Supplemental material
Supplemental material for this article is available online.
Author biographies
References
Supplementary Material
Please find the following supplemental material available below.
For Open Access articles published under a Creative Commons License, all supplemental material carries the same license as the article it is associated with.
For non-Open Access articles published, all supplemental material carries a non-exclusive license, and permission requests for re-use of supplemental material or any part of supplemental material shall be sent directly to the copyright owner as specified in the copyright notice associated with the article.