
Abstract
The acceptance sampling plan (ASP) is a statistical tool used in industry for quality control to determine the quality of products by selecting a specified number for testing in order to accept or reject the lot. The main objective is to develop a new ASP based on truncated life tests assuming that the lifetime follows the two parameters Quasi Shanker distribution, since this distribution showed its superiority in providing a better model for some applications than the exponential distribution. The ASP steps are carried out to find the minimum sample sizes needed to assert the certain life mean that are calculated under a given customer’s risk. The operating characteristic values of the sampling plan and the producer risk values are obtained. The efficiency of the suggested plans is analyzed based on real data that is fitted to the Quasi Shanker distribution. For various values of the Quasi Shanker distribution parameters, numerical examples are presented for illustrative purposes. The results indicate that the suggested ASP provides smaller sample sizes than other competitors considered in this study. The suggested ASP has been found to provide a substantial sampling economy in terms of reducing the sample. Hence, it is recommended that the ASP can be used in industry and for future research works as double and group ASP.
Keywords
Introduction
Shanker 1 suggested one parameter lifetime distribution known as Shanker distribution (SD) for modeling lifetime data from engineering and biomedical sciences with a cumulative distribution function (CDF) and probability density function (PDF), respectively, given by

and

Due to the importance of Shanker distribution, a two-parameter Quasi Shanker distribution 2 (TPQSD) is suggested as a modification of SD and to be more flexible than SD. The QSD is a special case of the TPQSD. The latter showed its superiority in providing a better model for some applications than the exponential distribution. 2 The probability density function of TPQSD is given as

The corresponding CDF of the TPDSD is

The rth non-central moment about the origin is given by

Therefore, for
The reliability, hazard rate and the mean residual life functions of the TPQSD distribution, respectively, are


and

The coefficient of variation (

and
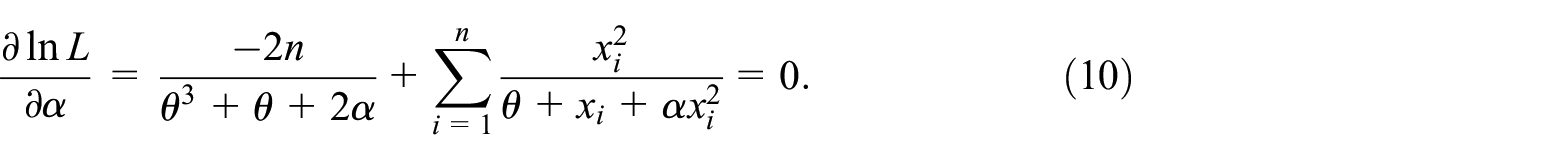
The maximum likelihood estimates (MLE) of distribution parameters

The TPQSD is considered in this paper to suggest new single acceptance sampling plans. The acceptance sampling plan (APS) is a valuable methodology for the producers to accept or reject the lot based on the quality of the samples’ inspection. It is useful in reducing the cost of full inspection since the latter is costly and time-consuming.
The ASPs focusing on the truncated lifetime tests are considered in literature by many researchers in many cases. See, for example, a list of applications with the corresponding references: the Tsallis q-exponential distribution, 3 the generalized exponential and exponential distributions,4,5 the generalized inverted exponential distribution, 6 the weighted exponential distribution, 7 the three-parameter Kappa distribution, 8 the Birnbaum Saunders model, 9 the Garima distribution, 10 the transmuted generalized inverse Weibull distribution, 11 the extended Exponential distribution, 12 the new Weibull-Pareto distribution, 13 finite and infinite lot size under power Lindley distribution, 14 double ASP based on truncated life tests for the inverse Rayleigh distribution, 15 double ASP based on the Burr type X distribution, 16 the generalized inverse Weibull distribution, 17 the transmuted inverse Rayleigh distribution, 18 the Sushila distribution, 19 double ASP for transmuted generalized inverse Weibull distribution, 20 the generalized exponential distribution, 21 the Weibull product distribution, 22 the Gamma distribution, 23 the log-logistic model, 24 the inverse-gamma distribution, 25 ASP for Akash distribution, 26 length-biased weighted Lomax distribution, 27 three-parameter Lindley distribution, 28 double ASP for Half-Normal distribution, 29 and exponentiated generalized inverse Rayleigh distribution. 30 Also, see a mixed double sampling plan based on Cpk, 31 design of variables sampling plans based on the lifetime-performance index in the presence of hybrid censoring scheme, 32 determination of multiple dependent state repetitive group sampling plan based on the process capability index, 33 and selecting better process based on difference statistic using double sampling plan. 34 Also, other ASPs are suggested by some researchers considering different methods.35–41 To the best of our knowledge, there are no studies about the ASPs for the TPQSD.
The structure of this paper is as follows. “
Method
Design of the ASP
This section provides the new proposed ASP based on the assumptions that the lifetime follows the two-parameter Quasi Shanker distribution. An ASP-based on truncated life tests consists of:
Step 1: The number of items n to be selected from the lot.
Step 2: The acceptance number c, and if c or fewer failures out of sample size n occur within the test time (t), the lot is accepted.
Step 3: The ratio
Minimum sample size
Within the experiment, assuming that the lot size is sufficiently large, the binomial distribution can be used to find the probability of accepting the lot. Also, it is assumed that the consumer risk is specified to be

where
In this study, the ASP values are
Minimum sample sizes necessary when
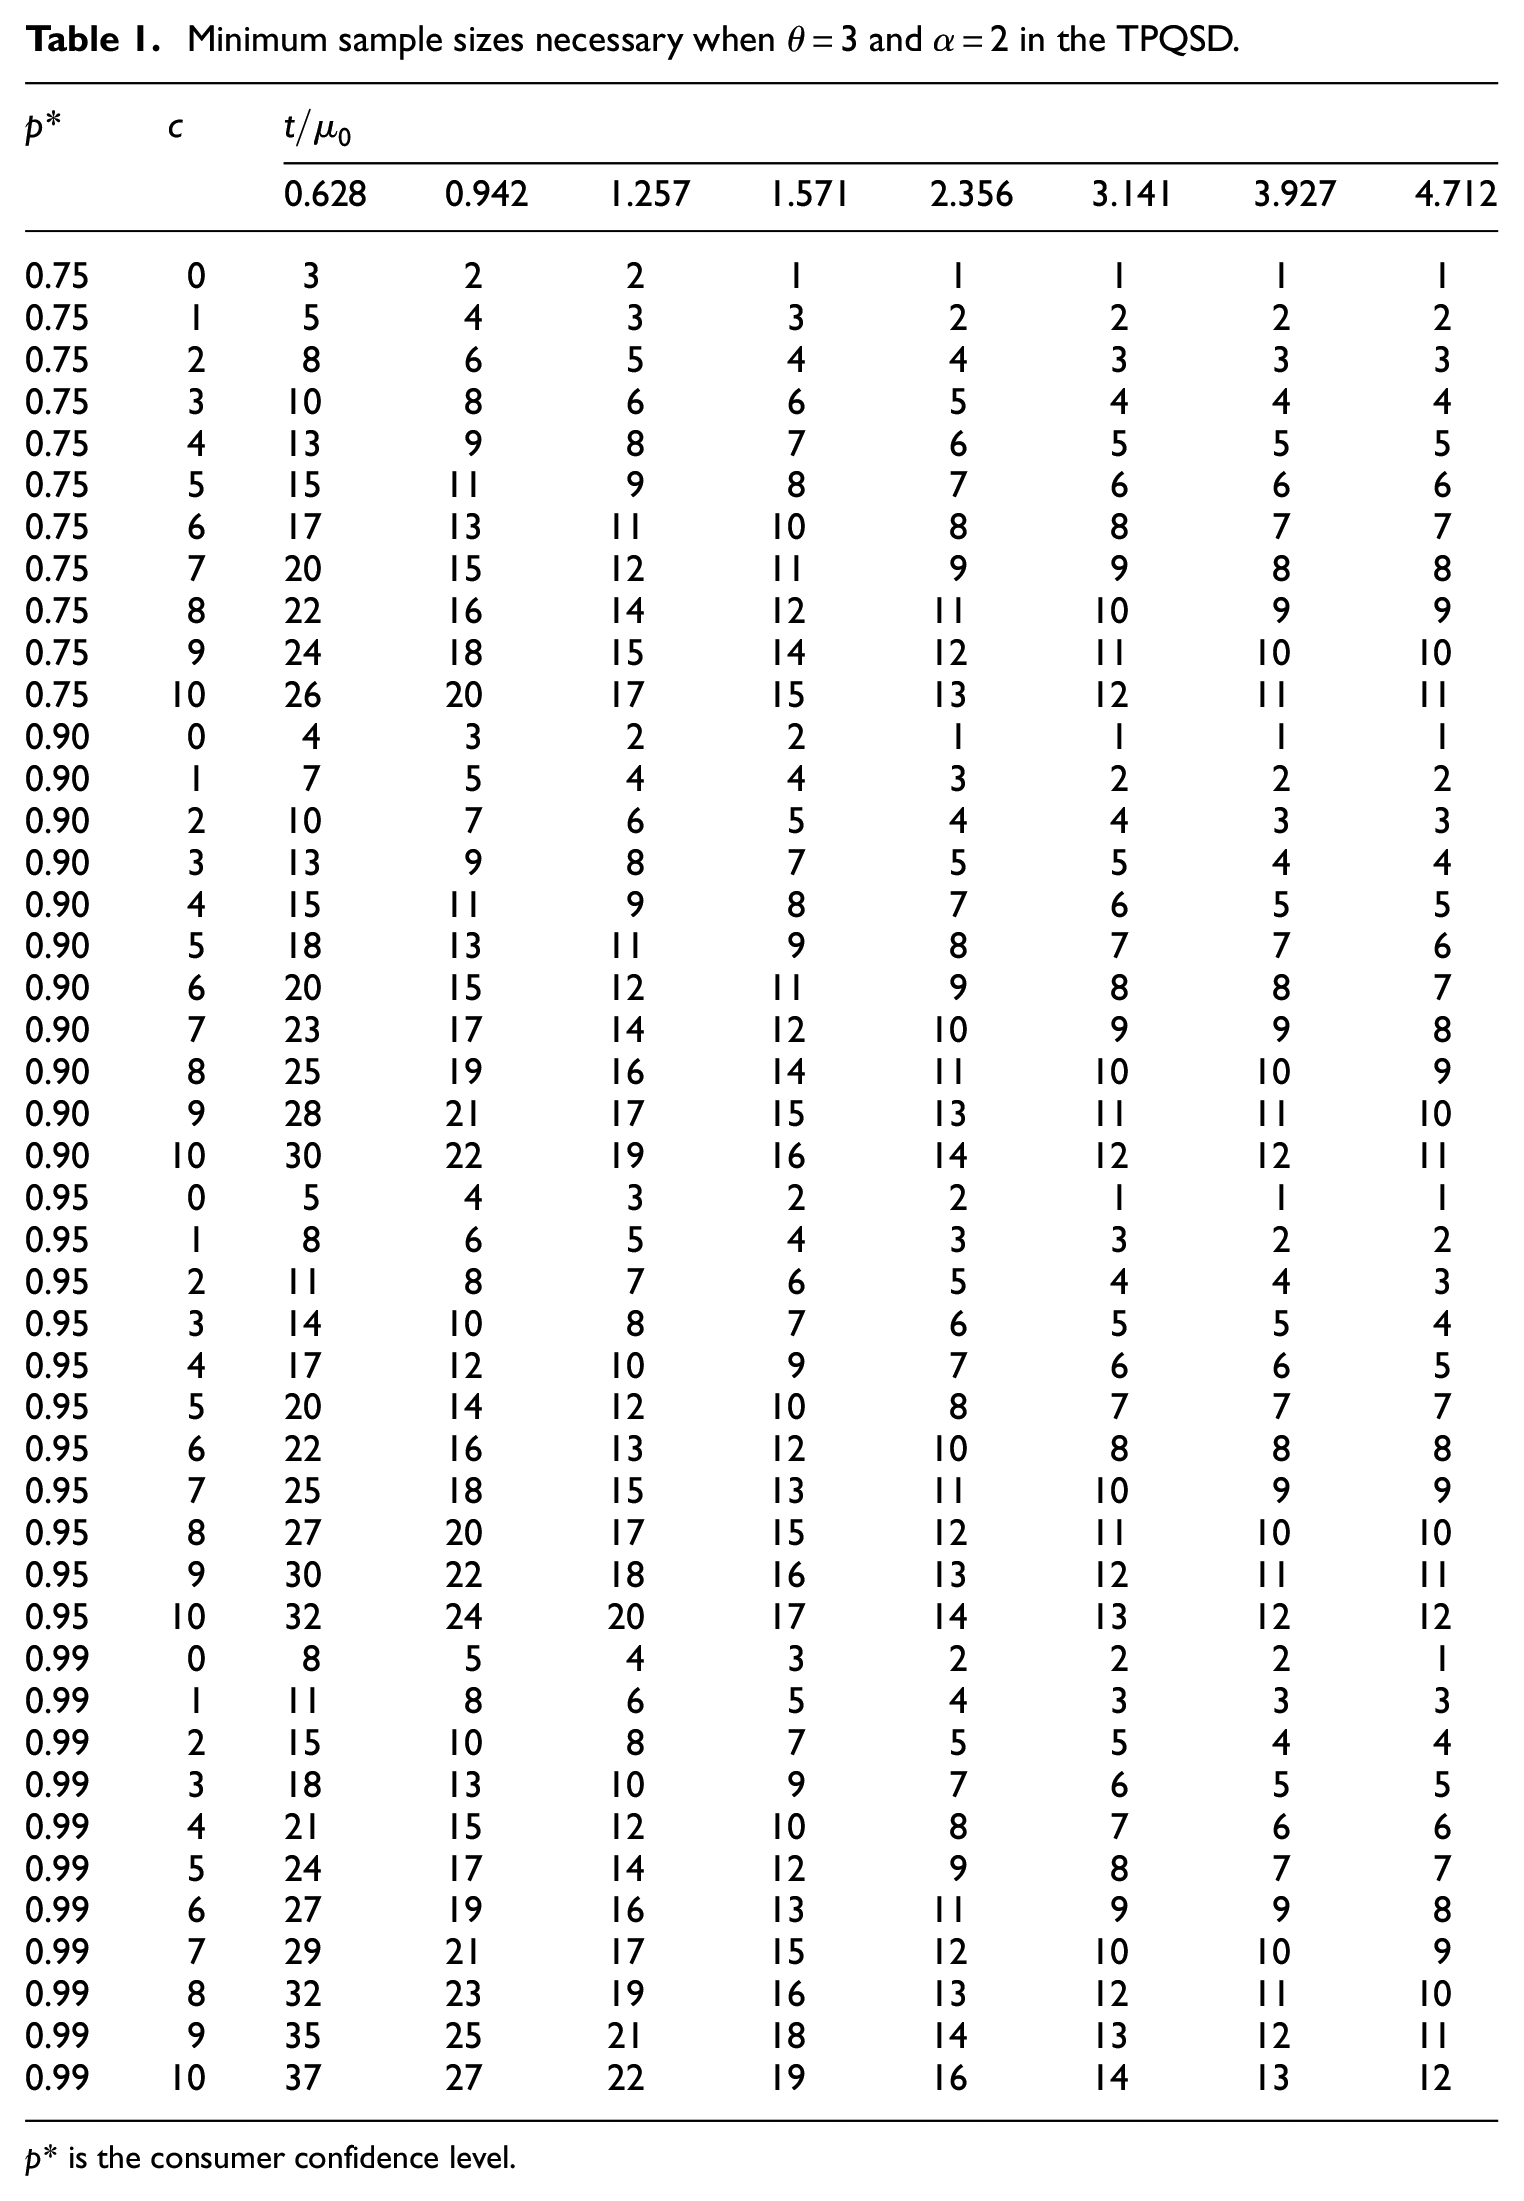
p* is the consumer confidence level.
Operating characteristic value
The operating characteristic
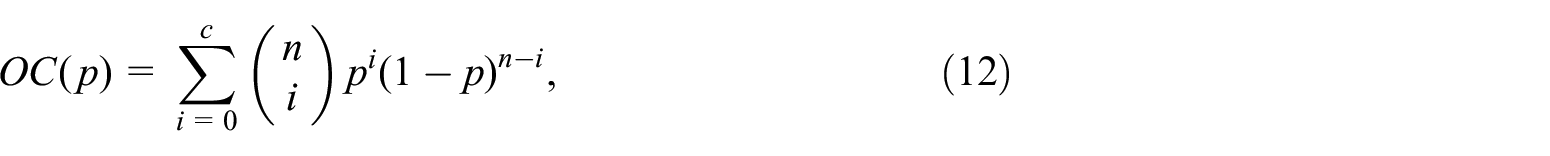
where
Operating characteristic function values of the sampling plan of
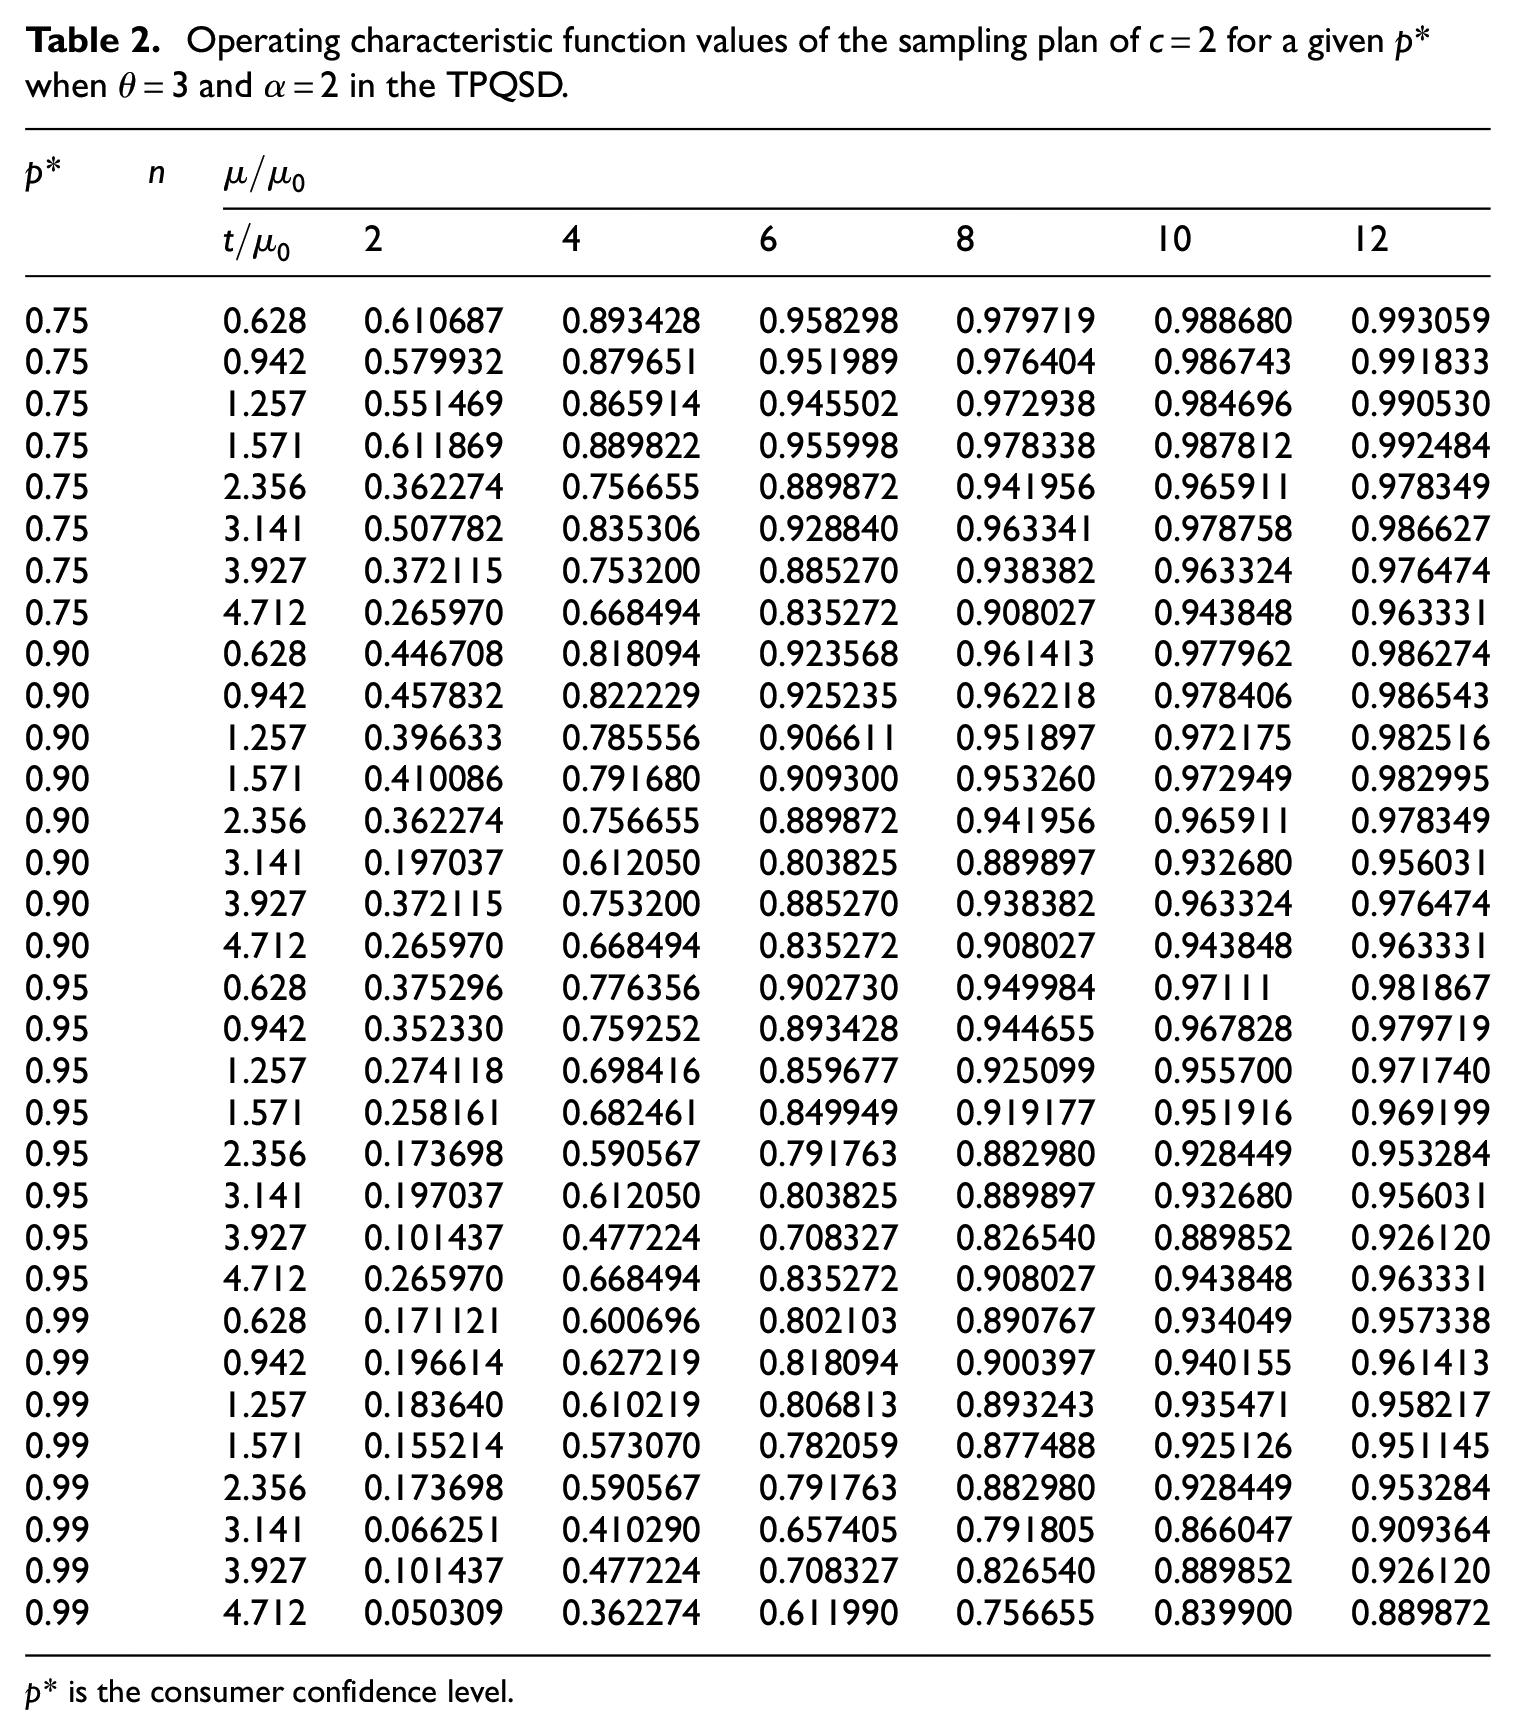
p* is the consumer confidence level.
Producer’s risk
The producer risk is the probability of rejecting a good lot when

For a given value of producer’s risk, say

For a given ASP
Minimum ratio of

p* is the consumer confidence level.
Results and discussions
In this section, we discuss the results obtained based on the suggested ASP. Recall that, the results for
Minimum sample sizes necessary when

p* is the consumer confidence level.
Operating characteristic function values of the sampling plan of

p* is the consumer confidence level.
Minimum ratio of

p* is the consumer confidence level.
Results for
Assume that the researcher needs to show that the true mean lifetime is at least
Table 2 shows the
The minimum ratio of the true mean lifetime to the specified value for the acceptance of a lot is given in Table 3, with producer’s risk of
Results for
The tables in this section are for the suggested ASP when the distribution parameters are
Comparing to other distributions, the minimum sample sizes, specified in Tables 1 and 4, are less than the corresponding values given for the inverse-gamma distribution 24 and the transmuted generalized inverse Weibull distribution. 7 Therefore, we can say that this paper’s minimum sample sizes are superior to their competitors considered in this study.
Real data application
To examine the efficiency of the suggested acceptance sampling plans, we analyzed the data considered by Zimmer et al.
42
in 2003. The real data consists of the lifetime (in months) to the first failure of

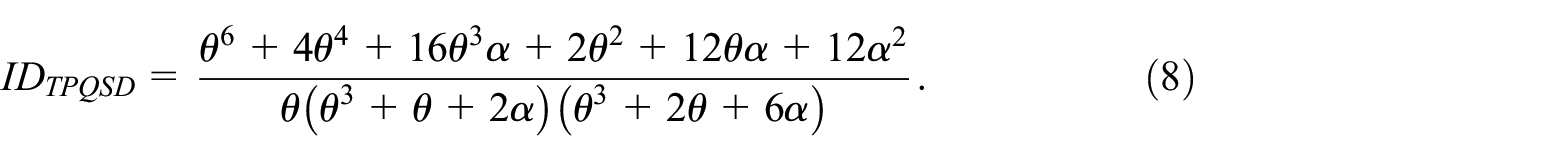
Also, the data is fitted to Ishita distribution (ID), with pdf given by

and to transmuted generalized inverse Weibull distribution (TGIWD) with pdf

Now, we have to check whether the two-parameter Quasi Shanker distribution fits the electric carts data. We considered the Bayesian Information Criterion (BIC), the Hannan-Quinn Information Criterion (HQIC), Akaike Information Criterion (AIC), the Consistent Akaike Information Criterion (CAIC), and the maximized log-likelihood (MLL) for selecting the best fit to the data, where
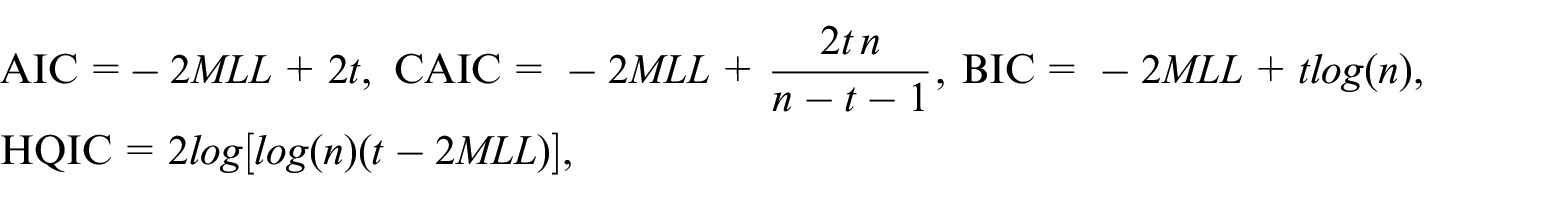
where n is the sample size and t is the number of parameters. The outcomes are given in Table 7. Also, we obtain the Kolmogorov-Smirnov statistics (K-S) and the corresponding P-Value (shown in brackets) for the TPQLD and the AD, TGIWD and ID. The best distribution with the smallest values of these measures is the better one in fitting these data.
The AIC, CAIC, BIC, HQIC, −2MLL, K–S (p-value), and the MLE (error) for the electric carts data.

Based on the above results in Table 7, the TPQSD fits the electric carts data adequately and better than the AD, TGIWD and ID. Using the MLE values of

Suppose that the lifetime of a product of the electric carts data follows TPQSD distribution. In the suggested ASPs, we assumed various values of the distribution parameters which are different from the real data’s estimated parameter values. Hence, we re-compute the minimum sample sizes and the operating characteristic functions based on the estimated parameter values. Assume that the specified average lifetime and the testing time are
The minimum sample sizes for
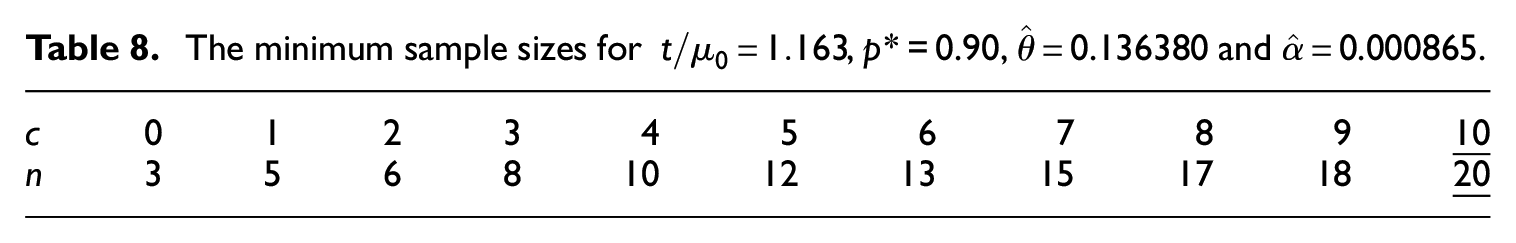

Based on these results, we want to check whether the lot can be accepted or not. From Table 8, for
Conclusion
In this paper, we develop a new acceptance sampling plan when the product’s lifetime follows the two-parameter Quasi Shanker distribution. The minimum sample size needed to guarantee a particular mean life of the test units is provided. The tables of the operating characteristic function values and the associated producer risk values are also obtained. Several illustrated examples of the tables are also provided. An application of real data is presented to dominate the superiority of the proposed acceptance sampling plan.
The TPQSD distribution is a new lifetime distribution and showed its superiority in providing a better lifetime model for some applications than other exponential distributions. It is strongly recommended that industrial practitioners use the suggested sampling plan to test products when the failure time of products follows the TPQSD. The proposed ASP based on truncated lifetime for the TPQSD distribution is essential for industrial companies since the suggested small sample size based on the ASP will save the time and cost of investigation for any product issues.
For future works, the motivation, based on this paper’s results, is to investigate the TPQSD for specific percentile lifetime, double, and group acceptance sampling plans.
Footnotes
Declaration of conflicting interests
The author(s) declared no potential conflicts of interest with respect to the research, authorship, and/or publication of this article.
Funding
The author(s) disclosed receipt of the following financial support for the research, authorship, and/or publication of this article: The authors thank the Deanship of Scientific Research at King Khalid University for supporting and funding this work through the research group program under grant number R.G.P. 2/82/42.