
Abstract
Casing wear is a serious problem in highly-deviated wells because serious wear will lead to casing deformation, drilling tool sticking and failure of subsequent operations. The purpose of this paper is to predict casing wear depth and evaluate its effect on casing strength degradation in highly-deviated well drilling operation. Special attention has been given to the algorithm to achieve the prediction and evaluation. The effect of tool joint on contact force distribution is considered in contact force model. Then a wear depth prediction model and its solution method are proposed based on crescent-shaped wear morphology and wear-efficiency model. Besides, strength degradation of worn casing is analyzed in bipolar coordinate system and the model is verified by finite element method. Therefore, the technology of casing wear prediction and residual strength evaluation is completed systematically. Then, to apply casing wear prediction and residual strength evaluation technologies to an actual highly-deviated well, casing wear experiment and friction coefficient experiment are carried out to obtain wear coefficient and friction coefficient. Finally, based on the established models as well as experimental results, the distribution of casing wear is predicted and residual strength is evaluated. The method presented in this paper will contribute greatly to casing wear prediction and evaluation in highly-deviated wells.
Introduction
Highly-deviated well has been recognized as an effective method for the exploration and exploitation of offshore oilfields and coastal oilfields. However, in the drilling operation of long open hole after cementing of intermediate casing, inevitable casing wear will impose a significant influence on casing structural integrity and residual strength. 1
To study casing wear mechanism and predict downhole casing wear accurately, many researches have been carried out. Bradley and Fontenot 2 compared the various modes of casing wear and established models to predict casing wear caused by different downhole operations based on laboratory-measured casing wear rates. Best 3 performed a full-scale test with field conditions and found that the major mechanisms responsible for casing wear by tool joints are adhesive wear, abrasive wear, and ploughing. White and Dawson 4 investigated casing wear with a full-scale test machine and established a wear-efficiency model based on energy principle. During the widespread use of this model, field identification has verified its accuracy and efficiency. The first analytical solution for residual burst strength of worn casing was developed by Song et al. 5 Full size tests were conducted and the comparison between actual rupture pressures and predicted values of worn casing verified the accuracy of the method. Hall and Malloy 6 acquired best fitting empirical function for the majority of more than 450 wear tests data and confirmed the nonlinear relationship between casing wear volume and dissipation energy. Sun et al. 7 classed wear stages into steady-state wear and running-in wear, and a nonlinear wear prediction model was developed. The effect of tool joint size change casing wear included three forms: single wear, sharp composite wear, and blunt composite wear. Kumar et al. 8 developed a mathematical model that describes casing wear in terms of the total wellbore energy and used this model to quantify and estimate the depth of downhole wear groove and wear volume. In order to solve the confusion regarding the fundamentals behind using wear factors, Kumar and Samuel 9 provided detailed explanations to help understand the fundamental concepts and apply appropriate wear factors for accurate downhole wear estimation. Through full scale experiment and numerical simulation, Moreira Junior et al. 10 carried out detailed research on worn casing’s residual strength, considering both initial and produced geometric imperfections. Li and Samuel 11 built a model for stress distribution along the casing circumference based on crescent-shape casing wear and developed hoop strength of worn casing with force and moment balance equations. The results were validated through comparison with finite element method.
Despite the previous studies on casing wear, casing wear prediction and evaluation method are not studied systematically, and the application to actual casing safety assessment is rare. Therefore, a comprehensive solution to this complex problem of accurately predicting and evaluating downhole casing wear is still urgently-needed.
In this paper, the technology of casing wear prediction and evaluation is completed systematically through theoretical derivation, physical experiment, field application and verification. A feasible solution to the complex casing wear prediction and evaluation problem is proposed. The novelty of this research lies in systematical prediction and evaluation method presented.
Casing wear prediction
Casing wear is due to the loss of casing material caused by friction between casing and drill pipe. The decreased casing wall thickness (Figure 1) will lead to casing strength degradation, resulting in drilling and completion failures, economic losses and even premature abandonment of the wells. Casing wear is hard to predict or evaluate, but severe tool joint wear is another evidence for possible casing wear, as shown in Figure 2. Therefore, it is of great significance to carry out assessment of residual strength after casing wear, so as to reveal current pressure capacity and take appropriate measures.
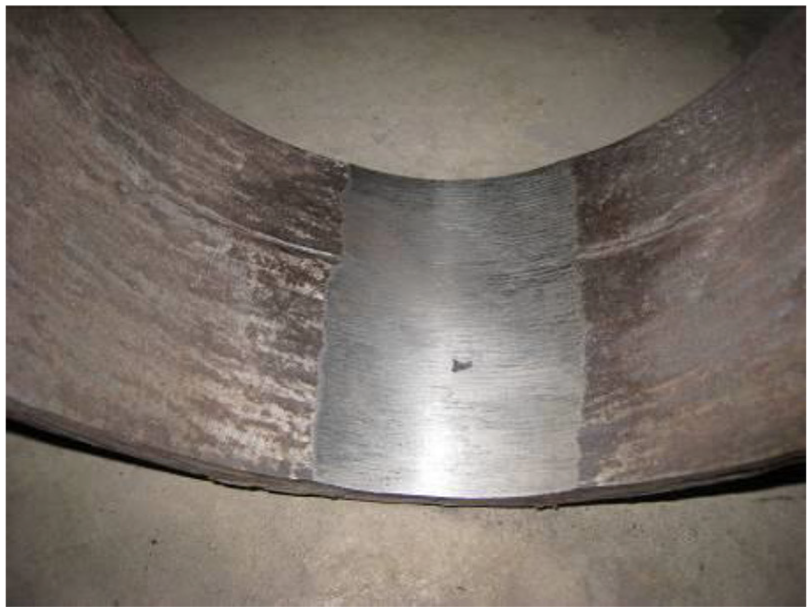
Casing wear morphology.
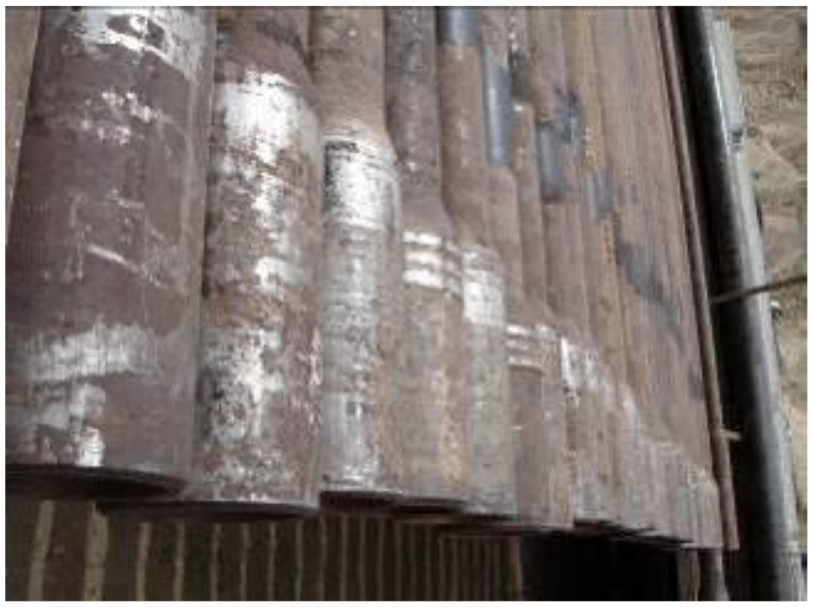
Tool joint wear morphology.
Contact force model
Casing wear is mainly caused by tool joint rotation in high dogleg section. 3 So casing wear prediction needs downhole torque/drag analysis and contact force calculation. Previous study mainly investigates the contact force between casing and drill pipe body. 7 However, the effect of tool joint on contact force distribution cannot be ignored because tool joint is generally bigger than drill pipe body, which is especially true in highly-deviated wells or extended reach wells. 12
To consider the effect of tool joint on contact force distribution, mechanical analysis is carried out on the drill pipe unit in Figure 3. Assumptions are made as follows:
Tool joint instead of drill pipe body contacts casing and all the tool joints contact the inner wall of casing inner wall at initial state.
The contact between casing and tool joint is rigid contact.
Downhole dynamic effect is neglected.

Force state of drill string in three-dimensional borehole.
The coordinate transformation equation between fixed coordinate (E, N, H) and active coordinate (x, y, z) can be expressed as:

where, αi is inclination angle of ith drill sting unit; φi is azimuth angle of ith drill sting unit.
The force equilibrium equation of ith drill pipe unit can be expressed as:

where, Ti−1 is tension of lower end of drill string unit; Ti is tension of upper end of drill string unit; Fi is friction force; Ni is contact force of tool joint; Wi is the weight of drill string unit.
The equilibrium equation for torque is:

where, Mi and Mi−1 are torques of upper and lower end of drill string unit, respectively; μt is circumferential friction coefficient; Dtj is outer diameter of tool joint.
Equation (2) can be rewritten in active coordinate (x, y, z) as:
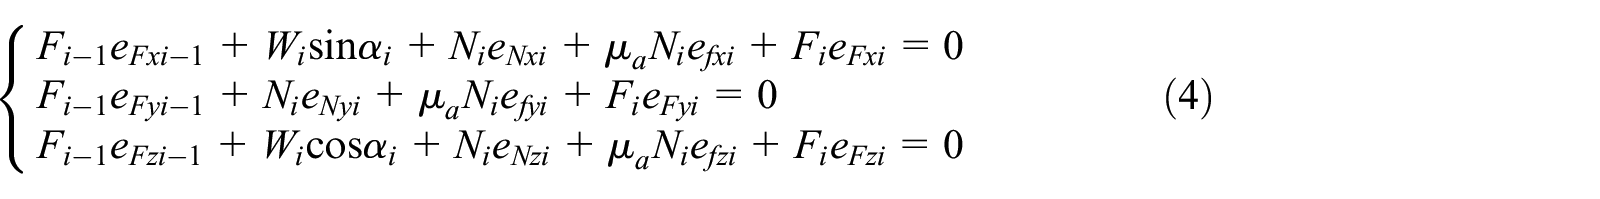
where, μa is axial friction coefficient.
Contact force and friction force should be perpendicular to each other, so equations (5) and (6) are automatically satisfied.


In rotary drilling process, the friction coefficient of compound motion is related to axial velocity and circumferential velocity. Axial and circumferential friction coefficients can be expressed as:
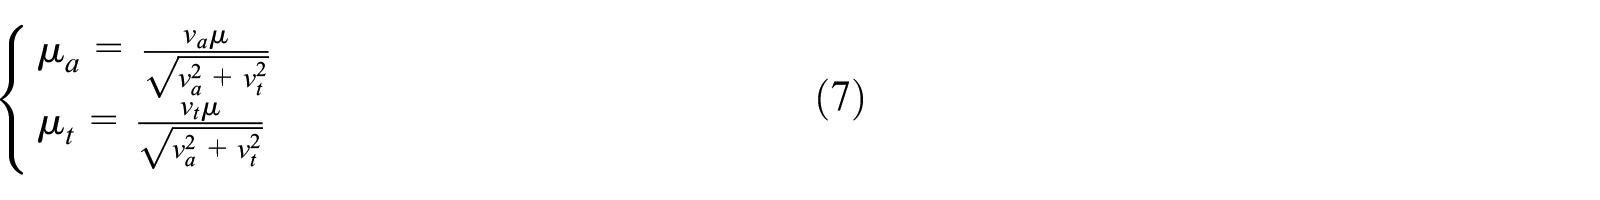
where, μ is coefficient of sliding friction; va and vt are axial and circumferential velocity.
Contact force can be calculated combining equations (1) to (7). Boundary conditions of the iteration are WOB (weight on bit) and TOB (torque on bit). When calculating contact force distribution, this method requires division of drill string into n units from drill bit upward to wellhead.
Wear depth model
Casing wear volume is mainly associated with sliding distance and contact force between tool joint and casing. At present, most computer programs for casing wear prediction have been developed on the basis of wear-efficiency model. 7 In this model, wear volume caused by rotary drilling process is expressed as 13 :

where, Vw is wear volume loss; f is wear coefficient; l is drilling depth; RPM is rotary speed; ROP is rate of penetration.
Many literatures have clarified that casing wear morphology is crescent-shaped.5,14,15 According to crescent-shaped morphology, the cross section of worn casing is shown in Figure 4.
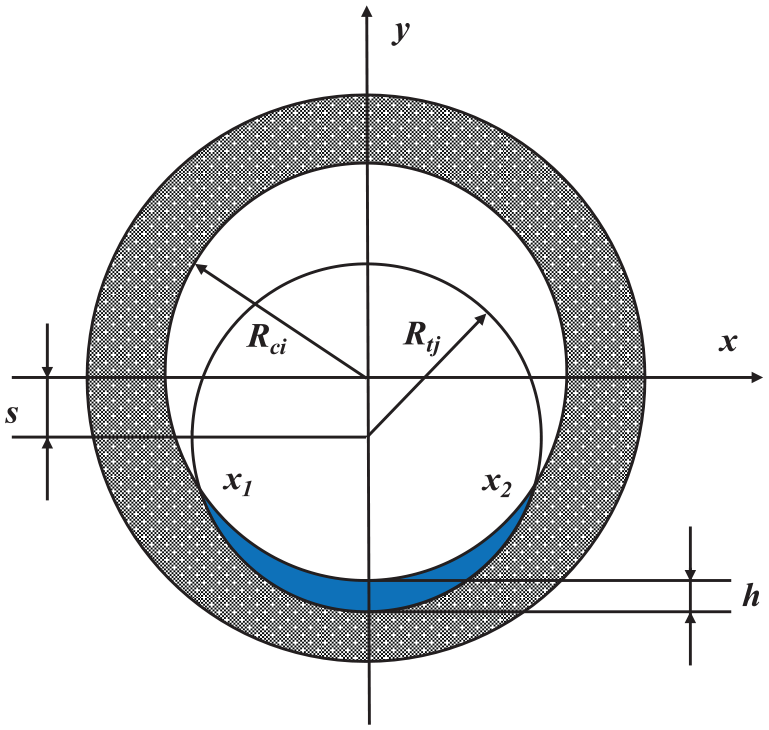
Coordinate system for crescent-shaped casing wear.
Casing wear area is expressed as the following equation 16 :
where, Rci is inner radius of casing; Rtj is radius of tool joint; x1 and x2 are the x-coordinates of wear boundary, expressed as:

s is the eccentric distance of casing center and tool joint center, expressed as:

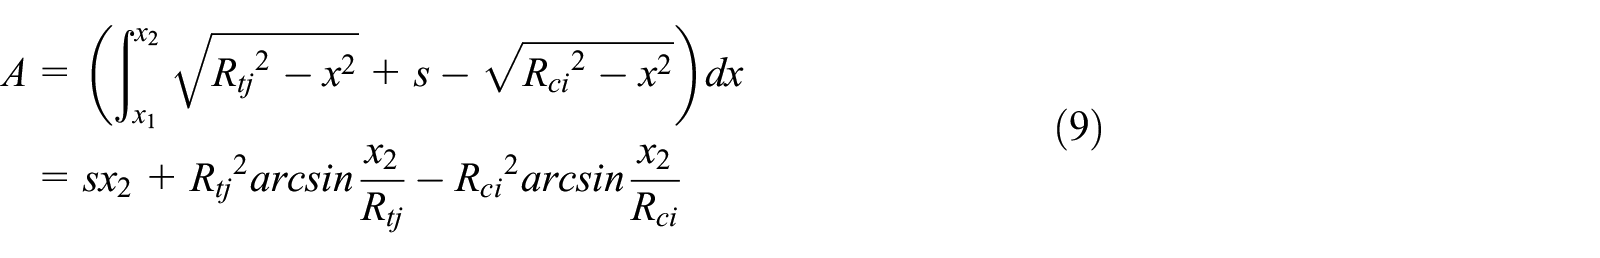
Therefore, according to equations (9) to (11), casing wear depth can be calculated at a given wear volume. In this paper, binary search algorithm is used to determine wear depth, as shown in Figure 5. The calculation of contact force and wear depth need iterations, so casing wear prediction can be realized using computer programs to achieve effectiveness and accuracy of prediction.
The solution flowchart for wear depth.
Residual strength evaluation
Eccentric pipe model
The engineering problems caused by casing wear are mainly related to reduced casing strength and damaged casing integrity. The accurate evaluation of worn casing strength is the key to a technically and economically feasible well design. 10
In this paper, morphology of worn casing is simplified to an eccentric pipe. Eccentricity is determined by wear depth. Bipolar coordinate system is a set of plane orthogonal curve coordinates to facilitate solving the problems involving two eccentric circular boundaries. Therefore, the derivation in this section is based on bipolar coordinate system, as shown in Figure 6.
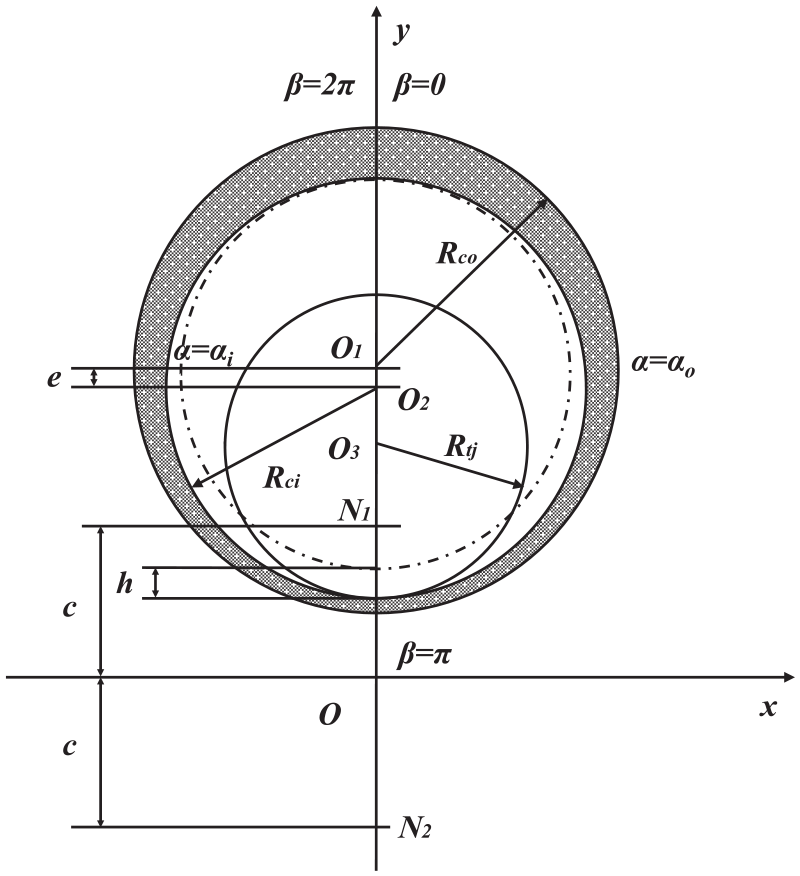
Bipolar coordinate system for eccentric pipe.
The mapping function ω(ξ) between Cartesian coordinates (x, y) and bipolar coordinates (α, β) is expressed as 17 :

where ξ is complex variable about the bipolar coordinates (α, β). Solving equation (12) yields:

And eliminating β from equation (13) yields:

Equation (14) represents a circle centered at (0, ccothα) on the y-axis and with the radius of ccothα. Therefore, α = αi and α = αo represent for the inner boundary and outer boundary of the eccentric pipe respectively.
The outer boundary radius, inner boundary radius and eccentric distance can be expressed as:

where Rco is outer radius of casing; e is eccentric distance of inner circle and outer circle; Ri is inner radius of eccentric pipe, expressed as:

According to complex potential theory, the stress distribution is expressed as 18 :

where σα, σβ and ταβ are the radial, hoop and shear stresses of eccentric pipe, respectively.
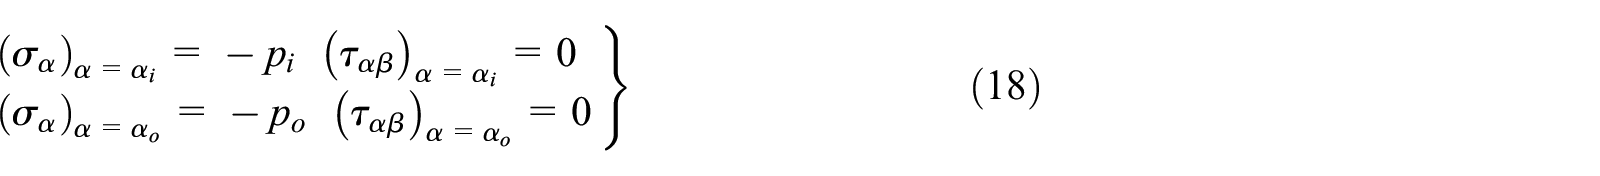
Under external pressure po and internal pressure pi, boundary conditions are determined as:
Solving Eq. (17) and Eq. (18) yields:

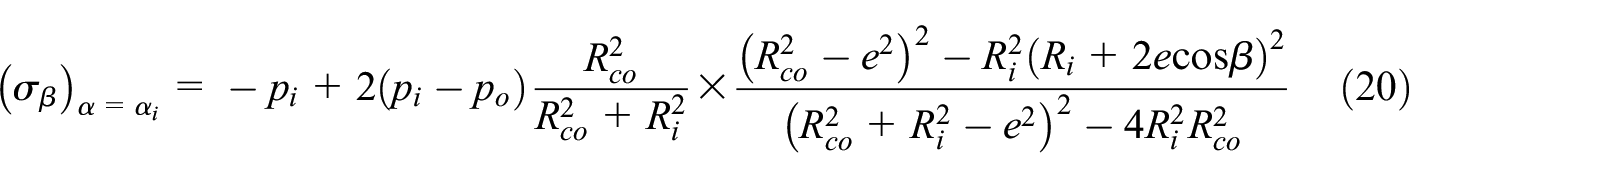
Therefore, substituting A, B, C, and D in equation (19) into those in equation (17), the distribution of hoop stress on inner boundary is 19 :
In this paper, we define SCF (stress concentration factor) as the ratio of maximum hoop stress of worn casing to the hoop stress of perfect casing. The residual strength of casing after wear can be calculated dividing casing original strength by SCF of worn casing. Figure 7 shows stress concentration factor and residual strength at different wear depth. It is obvious that wear has significant effect on casing strength degradation, and residual strength become half of the original values when the wear depth is 5 mm. With the increase of wear depth, SCF increases exponentially while residual burst strength and collapse strength decreases linearly. Moreover, the decrease rate of burst strength is faster than collapse strength.

Stress concentration factor and residual strength: (a) SCF and (b) residual strength.
Finite element verification
To acquire a more detailed representation of strength degradation and verify the results of eccentric mode, a finite element model of worn casing is established, as shown in Figure 8.

Finite element model of worn casing stress analysis.
In this model, P110 casing with outer diameter of 244.5 mm and thickness of 11.05 mm is selected to carry out numerical simulation. The model is simplified as a symmetry model and AB is the wear location of casing inner wall. External pressure of Po and internal pressure of Pi are loaded on the outer wall and inner wall of casing, respectively. Figure 9 shows the distribution of Von Mises stress of at different wear depth when Po = 40 MPa and Pi = 30 MPa.

Distribution of Von Mises stress at different wear depth: (a) 1 mm, (b) 3 mm, (c) 5 mm, and (d) 7 mm.
It can be seen the maximum Von Mises stress occurs at the inner wall of wear area. With the increase of wear depth, the distribution of stress becomes more uneven and the maximum Von Mises stress increases rapidly, under this circumstance casing is more likely to be damaged. In addition, there exists a low stress zone near the wear area, and this zone enlarges when wear depth increases.
The distribution of hoop stress at casing inner wall is also analyzed and compared with model calculated results, as shown in Figure 10. The calculated results are close to simulated results and the error is tolerable, which verifies the accuracy of eccentric model in worn casing strength evaluation. The maximum hoop stress is at the wear area, and hoop stress increases with the increase of wear depth.
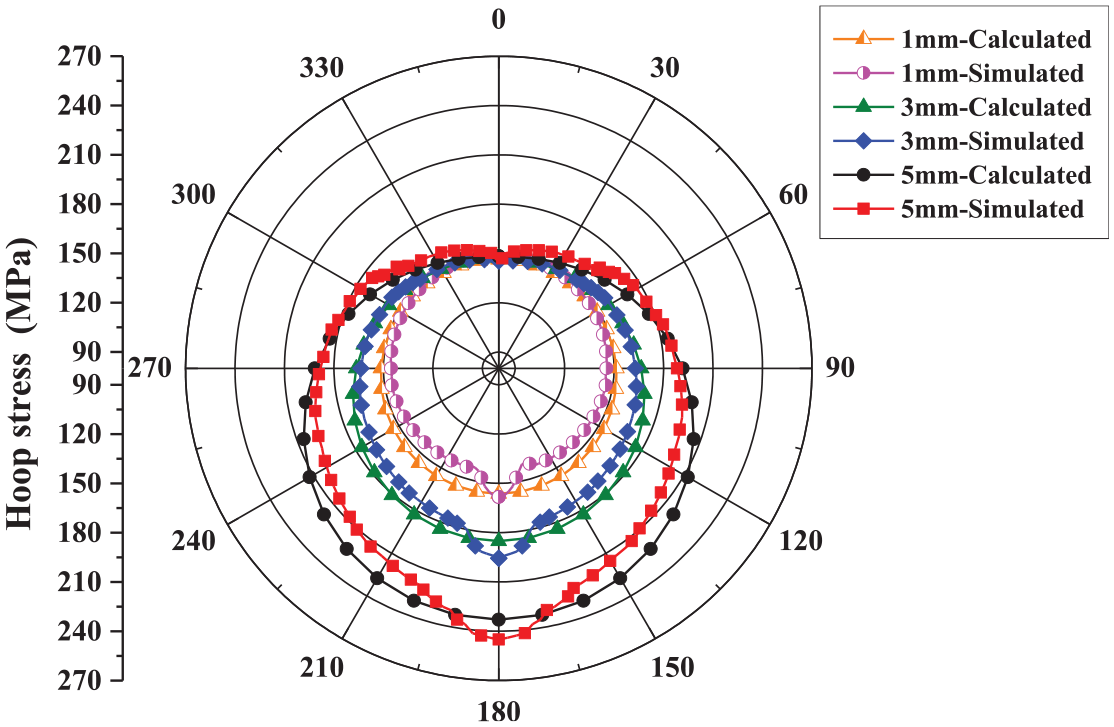
Comparison of calculated and simulated hoop stress distribution.
Case study
Basic data of X-02 well
X-02 well is a highly-deviated well on an artificial island of Eastern China. The well trajectory information: the maximum inclination angle is 82.1°, the maximum measured depth is 5630.00 m. Intermediate casing is cemented to depth of 3550 m. Most adjacent wells in this oilfield are highly-deviated wells, and intermediate casing wear is relatively serious. So prediction and evaluation of casing wear have some guiding significance for safety assessment of this well and drilling operations of other adjacent wells. This case study aims to predict wear depth and evaluate residual strength of intermediate casing in subsequent drilling operation after cementing.
Casing wear experiment
In order to accurately predict the wear of Ф 244.5 mm intermediate casing, casing wear rate should be tested. This paper conducted casing wear experiment to master casing wear mechanism and obtain wear rate parameters. The experimental apparatus is shown in Figure 11. In this experiment, the motor drove the tool joint specimen at a rotating speed of ω and load arm transferred dead weight W to the constant normal load F applied on casing specimen.

Casing wear experimental apparatus.
Casing specimen and tool joint specimen are shown in Figure 12. The physical dimension and mechanical properties of experimental specimens are listed in Table 1.

Casing specimen and tool joint specimen.
Basic properties of experimental specimens.

Figure 13 shows the wear morphology of casing specimens at different wear time. It indicates that wear area get wider and wear depth get deeper with the increase of wear time. Besides, wear depth is deeper at central wear region than wear boundary, which verifies the reliability of crescent-shaped wear pattern in casing wear analysis.
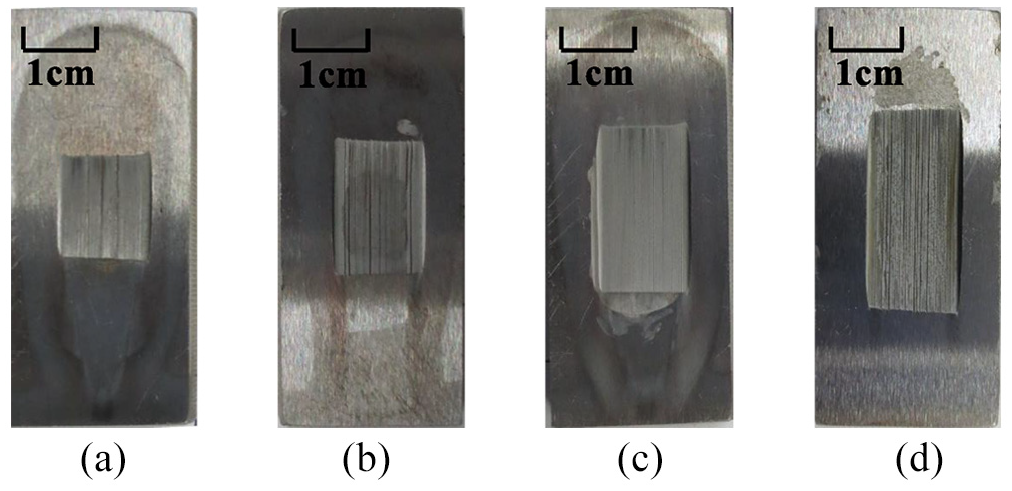
Wear morphology of casing specimens at different wear time: (a) 6 h, (b) 10 h, (c) 20 h, and (d) 25 h.
Figure 14 shows the change of wear depth under different wear time. As wear progresses, the wear depth and width increase, resulting in an increase in wear area. Conversely, as the wear area increases, the required energy increases to cause equivalent wear depth. Therefore, there is an obvious nonlinear relationship between wear depth and test time. It is also found that N80 casing is worn faster than P110 casing, which may be explained by the greater inherent hardness of P110 casing.

Wear depth of casing specimen under different wear time.
Based on wear-efficiency model, 4 wear volume is a function of friction work, expressed as:

where Wf is friction work; Ls is sliding distance.
Wear coefficient can be obtained by experimental parameters:

where ΔG is weight loss of casing specimen; ρ is density of casing material; Dtj is outer diameter of tool joint specimen; n is rotary speed; t is wear time.
According to equation (22) and experimental data, average wear coefficient is 2.1161 × 10⁻⁷ MPa−1 between P110 casing and S135 tool joint, as shown in Figure 15.

Wear coefficient of P110 casing.
Friction coefficient experiment
In order to obtain the average friction coefficient between casing and tool joint, friction coefficient experiment was conducted in this paper. The testing apparatus was mainly composed of main shaft, force sensor, elastic mechanism, slide platform, motor and screw rod, as shown in Figure 16.

Apparatus and specimens for friction coefficient experiment.
Casing specimen with outer diameter of 54 mm and inner diameter of 38 mm was used to rub against tool joint specimen with diameter of 4.7 mm. In the experiment, when rotating speed was constant, the normal load between casing and tool joint specimens was changed and friction moment was measured. Then Friction coefficient can be expressed as:

where,
After processing the experimental data, the average friction coefficient of P110 casing and tool joint is 0.256, as shown in Figure 17.

Friction coefficient between tool joint and P110 casing.
Casing wear prediction and evaluation
According to the friction coefficient obtained from experiments and actual drilling parameters of X-02 well, the distribution of contact force can be calculated, as shown in Figure 18. The maximum contact force occurs at build-up section (MD: 450 m–1000 m) because dogleg severity is high in that section. The most magnitude of contact force is contributed by principal normal component. Besides, the variation of bi-normal component between positive and negative can lead to varied contact position along drill string. So the variation of contact force distribution along casing string is not only in magnitude but in direction.
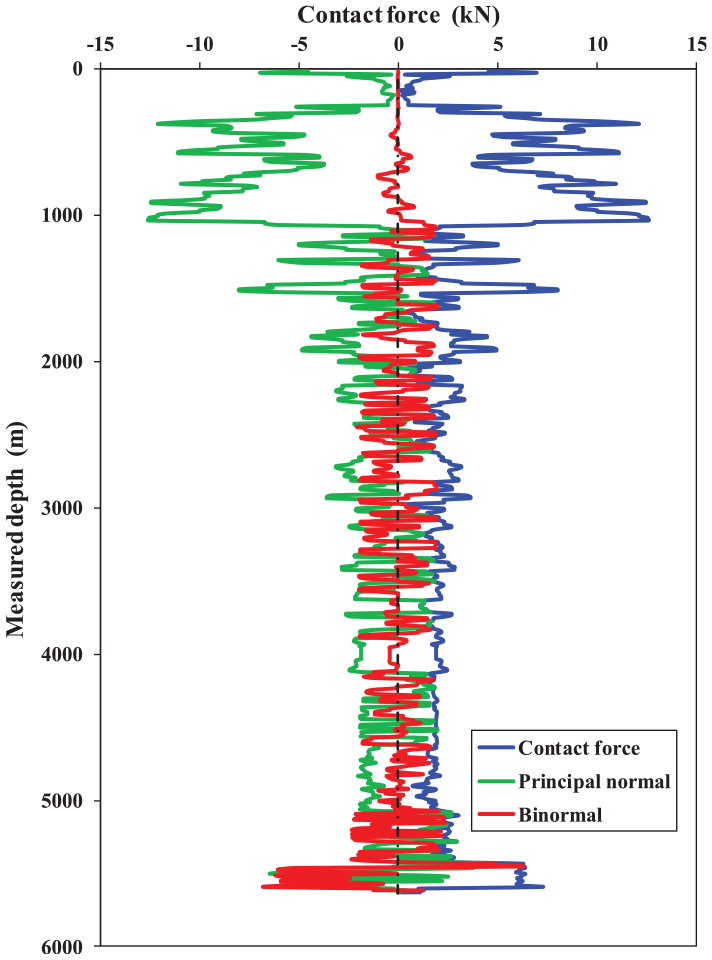
Contact force distribution (drilling depth of 5630 m).
Casing wear caused by tool joint rotation is a dynamic process because contact force distribution and drilling parameters change constantly as drill bit drills ahead. Therefore, the first step is accomplished by calculating contact force distribution at a given drilling depth. Then according to the experimental wear coefficient and casing wear prediction model, wear volume caused by different tool joints in drilling process is accumulated. Finally, wear depth of intermediate casing can be predicted using binary search algorithm. The prediction results of wear depth is shown in Figure 19. A maximum casing wear depth of 2.31 mm occurs at build-up section. Comparison with Figure 18 finds that contact force has important impact on casing wear, which can be the key for preventing or reducing casing wear.

Casing wear prediction and measurement results.
Figure 20 is the distribution of residual strength and safety factor based on equations (13) to (24). The original collapse strength is 30.48 MPa and original burst strength is 59.98 MPa. The minimum residual collapse and burst strengths are 24.82 MPa and 47.51 MPa respectively at build-up section. The distribution of safety factor of intermediate casing is calculated, as shown in Table 2. Although casing is seriously worn at build-up section, the loads acted on casing are not large in that section, so safety factors decrease slightly and casing has enough strength for subsequent operations. However, to ensure casing safety of adjacent wells, necessary measures are suggested, including improving the lubricity of drilling fluid, using tool joints without hardfacing and optimizing hole quality.

Residual strength and safety factor of worn casing.
Safety factors of intermediate casing before and after wear.

Conclusion
Casing wear prediction and residual strength evaluation is studied systematically in this paper, based on modeling and simulation. The methods and algorithms to achieve prediction and evaluation are proposed. The prediction of casing wear is based on contact force model and wear depth model established in this paper. According to downhole torque/drag analysis, a contact force model is established with considering the effect of tool joints. A wear depth calculation and solution method is also proposed according to wear-efficiency model and crescent-shaped wear morphology. The strength degradation of worn casing is quantified in bipolar coordinate system based on eccentric model. To verify the results of eccentric model, a finite element model of worn casing is established and stress distribution under different wear depth is analyzed. Comparison indicates that calculated results are close to simulated results and that the established eccentric model can be used to evaluate residual strength of worn casing. Wear experiment is carried out and the results indicate that average wear coefficient between P110 casing and S135 tool joint is 2.1161 × 10⁻⁷ MPa−1. Friction coefficient experiment is conducted and the average friction coefficient between casing and tool joint is 0.256. Finally, based on mathematical models and experimental results, casing wear of a highly-deviated well is predicted and evaluated. The most serious wear occurs at build-up section and wear depth is 2.31 mm. Residual strength evaluation indicates that the worn casing is still safe for subsequent operations.
Footnotes
Acknowledgements
The authors are grateful to the support from the National Natural Science Foundation of China (No. 51704034), Open Fund of State Key Laboratory of Oil and Gas Reservoir Geology and Exploitation (Southwest Petroleum University) (No. PLN201707) and China Postdoctoral Science Foundation (2020M673286).
Declaration of conflicting interests
The author(s) declared no potential conflicts of interest with respect to the research, authorship, and/or publication of this article.
Funding
The author(s) received no financial support for the research, authorship, and/or publication of this article.