
Abstract
The study of water entry cavity and the analysis of load characteristics are hot topics in water entry research. The coupled Euler–Lagrange method is used to carry out simulation research on the water entry process of a cylinder. Aiming at the water vapor mixing phenomenon caused by structure slamming on the water at the initial time of water entry, the slamming load is further studied by correcting the sound speed in the water. The differences between the calculated results obtained by adjusting the number of units in the numerical simulation prove the convergence of the numerical method. Water entry experiments of a cylinder were carried out, and the results are in good agreement with the simulation data. The motion state simulation and analysis are carried out for the process of water entry with different initial speeds and angles. The changes in the structure’s positions, air cavities, and slamming loads are obtained. The rule of slamming pressure with the water entry angle and the relationship between pressure and acceleration are determined.
Introduction
Due to the need for underwater weapons, the issue of water entry has been the focus of attention since the beginning of the 20th century. The huge slamming load in the initial stage of water entry is extremely harmful to the structure and equipment.1,2 Therefore, it is of great significance to study the slamming load for the safety and reliability of the structure of underwater weapons. Furthermore, the determination of the air cavity’s shape in the water entry is the key to predict the trajectory in the initial stage of water entry. At present, theoretical method, experimental method, and numerical method are mainly used to analyze the water entry problems.
In terms of theoretical research, Von Karman 3 is a pioneer in the study of water entry. He began to study the slamming phenomenon and slamming force of seaplanes in 1929. Analytical solutions were used by Miloh4,5 to calculate the slamming force when the sphere entered incompressible fluid obliquely. Howison et al. 6 extended the analytical solution of slamming load of symmetric body, without considering the influences of compressibility, gravity, and viscosity. Aristoff and Bush 7 studied the water entry problem of hydrophobic spheres and cylinders and proposed a theoretical model to determine important parameters, including cavity closure time, shape, and depth of closure. In addition, many researchers, including Dobrovol’skaya, 8 Lee et al., 9 Tassin et al., 10 Kou et al., 11 and Dyment, 12 devoted themselves to the theoretical study of water entry and have made a great deal of analysis on the mechanism of water entry. Although several theoretical methods have been developed for water entry problems, some important parameters are ignored, such as fluid viscosity, flow separation, and nonlinear free surface boundary.
Experimental research is the most persuasive method. In 1900, Worthington et al. 13 used flash photography technology to record the water entry of spherical shells in different liquids. In terms of water entry laws, Truscott et al. 14 have carried out a large number of experimental studies on the water entry problem caused by the rotation of the sphere and have analyzed the influence of rotary speeds, water entry speeds, and other factors on the cavity development process. In order to study the influence of fluid medium in the process of water entry, after spreading smoke particles in the air domain, Gekle et al. 15 carried out the water entry experiment of a disk and observed the law of gas flow in cavity. The results show that after cavity is formed, the speed of gas jet at the cavity opening is extremely high. Liu et al. 16 carried out experiments on the water entry of spherical hydrophilic particles under different density and viscosity liquid conditions and measured the critical water entry speed that can ensure the stability of hydrophilic particles above the liquid surface for different liquids. In China, the focus of experimental research is mainly on the influence of structural geometric parameters in the process of water entry. Gu et al. 17 conducted water entry cavity and ballistic experiments at different speeds and depths for warheads with different head shapes. Zhang et al. 18 carried out water entry experiments for flat, oval, and truncated oval projectiles and obtained the trajectory and cavity shapes of the three projectiles in the initial stage of water entry. A series of experimental studies were carried out by Wei and Hu 19 on water entry of three-dimensional circular cylinders for low Froude numbers. The focus is on the effect of inclined angles.
More experimental research has been done on the influence of water entry medium and the shape of water entry cavity, but little on slamming load. In addition, due to the high experimental cost and troublesome operation, and the rapid development of computer technology, the simulation methods have been widely used. Volume of fluid (VOF) and smoothed particle hydrodynamics (SPH) method are all effective methods for numerical study. Oger et al. 20 applied SPH method based on mesh-free numerical techniques to study the water entry problem of two-dimensional wedge and analyzed the interaction between fluid and solid in the whole water impact process. The motion characteristics obtained by numerical calculation are in good agreement with the experimental results. SPH and VOF methods were used, respectively, by Marcer et al. 21 to study the phenomenon of ship slamming on the water. The results show that SPH method has extremely high accuracy for simulating the dynamic response of the liquid surface, while VOF method is better for large-area water contact problems. The VOF method was used by Ma et al. 22 to simulate vertical water entry of a conical cylinder with high speed. In the same way, Hou et al. 23 carried out the unsteady characteristics research of the cylinder entering the water obliquely, which matches well with the experiment. Based on Reynolds-averaged Navier–Stokes (RANS) equation, combined with VOF multi-term flow model and dynamic grid technology, Wang et al. 24 simulated the uniform vertical water entry of cone-nosed cylinder and obtained the effect of natural cavitation on the water entry form during the vertical water entry process. Gao et al. 25 studied different entry conditions by solving RANS equations coupled with 6-degree-of-freedom rigid-body motion equations. It is found that the speed attenuation during the entry process is mainly affected by the projectile geometric parameters such as its head shape and length, rather than the entry angles and velocities. Besides these, the boundary element method, 26 constrained interpolation profile (CIP) method, 27 the arbitrary Lagrange–Euler (ALE) method,28,29 and lattice Boltzmann method (LBM) 30 are all used for numerical simulation of water entry. Coupled Euler–Lagrange (CEL) analysis is another method to deal with the water entry problem,31,32 which is effective and beneficial. Ahmadzadeh et al. 33 adopted CEL method to simulate a free-falling sphere impacting the free surface of water. In addition, this method was used by Erfanian et al. 34 to simulate the water entry of three-dimensional projectile. The simulation results of air cavity shape and projectile trajectory are in good agreement with experiments. In the CEL method adopted in many articles,33,34 the upper region of Eulerian domain is defined as a void, which ignores the influence of gas. In addition, the study is more focused on the evolution of water entry cavity or limited to the characteristics of load and lacks systematic arrangement.
In this article, based on the settings of CEL method,31–34 with consideration of the influence of air content in water, an improved CEL method is proposed to simulate water entry of the cylinder. Besides, the water entry experiments of the cylinder are carried out. The numerical method is validated by comparing the numerical results with experiment data. Then, according to the general situation of water entry, the shape, and evolution of cavity, changes in slamming load and acceleration at different speeds and different angles are systematically analyzed to explore the law between the water entry phenomenon and the load.
Numerical method
CEL method is a numerical solution method for hydrodynamic and fluid–solid coupling problems based on finite element platform. CEL method simplifies the N-S equation, so it does not consider the flow boundary layer effect, but focuses on the basic form and evolution of air cavity, as well as the application of water trajectory and hydrodynamic load. 35 In the CEL method, the calculated pressures and stresses in the Eulerian mesh are applied on the Lagrangian cells as external loads. However, the Lagrangian mesh motion acts as a boundary condition on the flow of material in the Eulerian meshes.
The governing equation
Pure Eulerian analysis is a finite element technique in which materials are allowed to flow across element boundaries in a rigid mesh. In the calculation process, there can be different substances in an Euler element, and the material mesh is transported to a fixed space mesh by the state variable of the Lagrange element. The specific governing equation is given by


where
Lagrange algorithm is a discretized numerical solution method. Materials are closely associated with an element, and the materials move with the deformation of the mesh. The specific governing equation is given by


where
CEL method absorbs the advantages of Euler method and Lagrange method. Euler mesh is fixed and material can flow freely in the mesh, which solves the problem of element deformation in large deformation. When solving the governing equations of the motion process, the continuity equation is adopted as the mass conservation equation. For fluid calculation, Euler equation is used to solve the momentum conservation relation. Viscosity is not considered in the Euler equation solving process, and the influence of fluid viscosity is considered in the definition of material state equation by linear Us-Up state equation, which belongs to Euler equation with viscosity correction. 36
Equation of state
An equation of state is a constitutive equation that defines the pressure as a function of the density and the internal energy per unit mass. In this study, the Mie–Grüneisen equation of state supported in Abaqus is appointed. This equation is typically used to model materials at high pressures. It is linear in energy and assumes a linear relationship between the shock speed and the particle speed.
A Mie–Grüneisen equation of state is linear in energy. The most common form is

where

where
The Hugoniot energy,

where

The equation of state and the energy equation represent coupled equations for pressure and internal energy. Abaqus/Explicit solves these equations simultaneously at each material point.
Linear Us–Up Hugoniot form. A common fit to the Hugoniot data is given by

where

With the above assumptions, the linear

where
The linear Hugoniot form (
This equation of state involves the selection of
The revised sound speed with the influence of air content in water
For the problem of sound speed in two-phase system, the derivation process of the sound speed in water mixed with gas is based on the following assumptions:
Water and air are uniformly and isotropically mixed, and there is no transformation between phases.
Elastic boundaries are set between different phases.
Surface tension and friction are not considered.
The expression of sound speed

where
It is assumed that the gas phase and the liquid phase are equivalent to separately propagating media. The labels “L” and “G” represent liquid phase and gas phase, respectively.


where


Take the liquid phase as an example to obtain the equivalent sound speed in the liquid phase. For isotropic homogeneous water–gas mixtures, it is assumed that the volume fraction of the gas phase is


Then

When the above formula is brought into the sound speed formula of the liquid phase,


The equivalent sound speed of liquid phase can be given by

Similarly, the equivalent sound speed of gas can be written as

Based on the above parameters, the equivalent sound velocity in the water–air mixed phase is given by
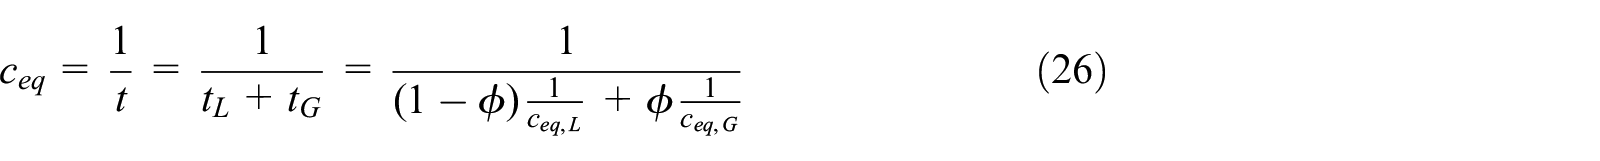
Using the above formula, the sound speed can be written as

The expression of equivalent sound speed in water–gas mixture is obtained. The variation curve of sound speed in the water–gas mixture with air content
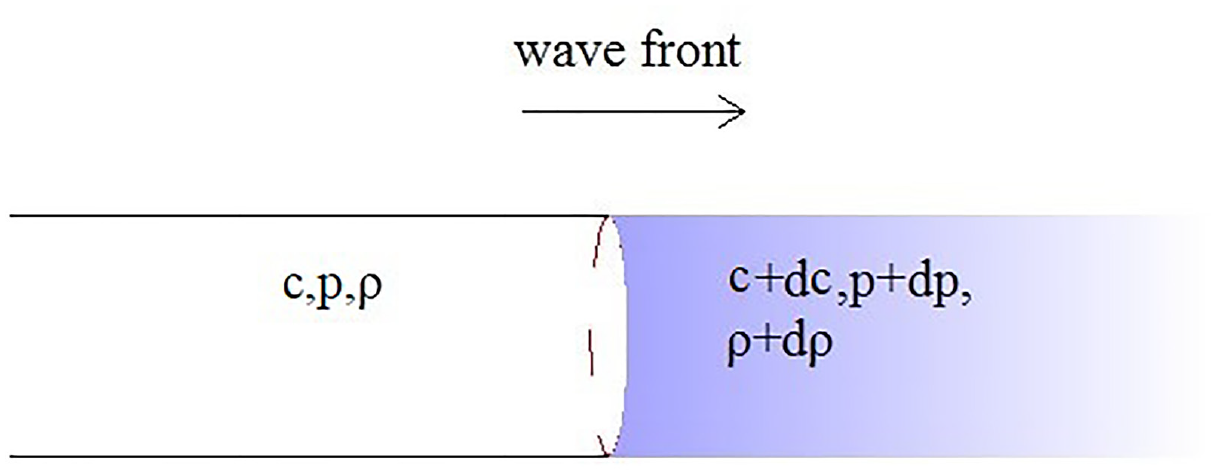
The balance at the two sides of wave front.

Variation curve of sound speed with air content
The selection of air content is very critical. Different air content is selected for different problems. Generally, the air content is determined by experiments. For the water entry problem in this article, the air content is 1.009%; the density of water is 989.91 kg/m3 and the speed of sound is 190 m/s. The material parameters of water and air are shown in Tables 1 and 2.
Basic parameters of water.

Basic parameters of air.

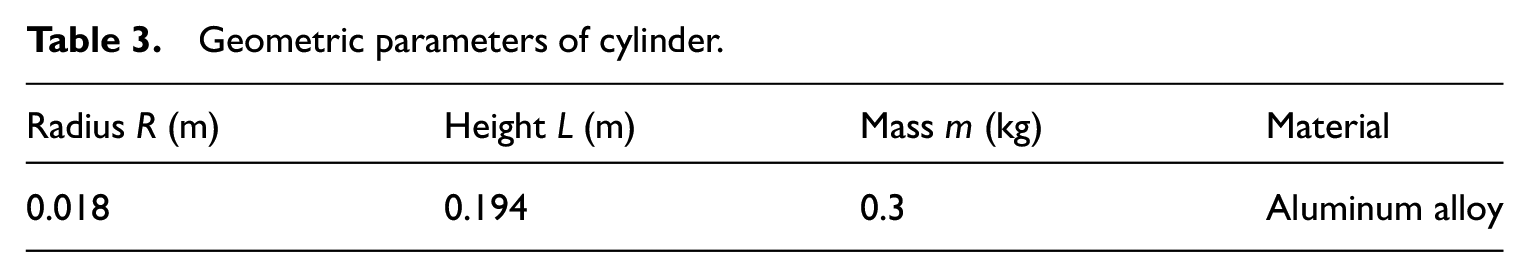
Geometric parameters of cylinder.
Validation of calculation effectiveness
Experimental detail
To verify the reliability and accuracy of the numerical algorithm, we have carried out a series of water entry experiments.
For the water entry experiment, a set of equipment which is composed of a launching system, an experimental observation system, and a data acquisition system has been used. The launching system consists of a gas cylinder, an accelerating tube, an air tank, and an air compressor. The experimental observation system includes a high-speed camera and a control cabinet. The data acquisition system is composed of a pressure sensor and a computer. In high-speed water entry experiments, the required sensors must meet the characteristics of small size, high strength, and waterproofness. Therefore, the micro-high-frequency dynamic pressure sensor is customized. The control cabinet is used to control the start-up of the water entry equipment. The shooting frequency used in this experiment is 2800 fps; the connection between the camera and the computer is realized through the data line and the camera software Phantom2.8, and the data transmission and storage can be completed synchronously. The software can simultaneously measure parameters such as size of the cavity and velocity of the cylinder as shown in Figure 3.
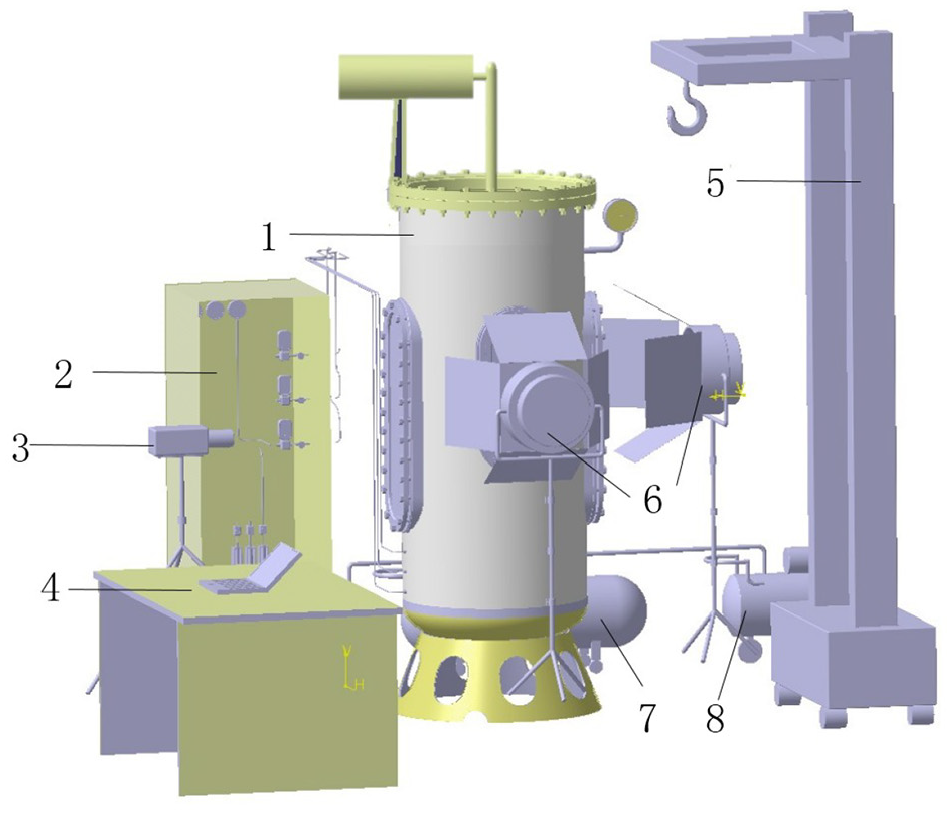
General arrangement of water entry device.
The high-speed pneumatic launcher shown in Figure 4 was designed according to the actual engineering requirements. The device adopts high-pressure pneumatic technology, and light-weight high-pressure gas is used as the primary driving force to push objects to move at high speed. In order to meet the size requirements of the accelerating tube, the parameters of the cylinder are taken as radius R = 0.018 m, height L = 0.194 m, and mass m = 0.3 kg, as shown in Figure 5. Table 3 lists the dimensional parameters of the cylinder. In the scheme of load measurement, the sensor is placed inside the cylindrical model and enters the water at high speed with the model. The oblique water entry calculation is carried out on the model. In the experiment, by adjusting the pressure of the air compressor and the incline angle of the launching tube, the model obtains different speeds and angles. When verifying the validity of the numerical method, the water entry angles are adjusted to 85° and 90°, respectively, and the obtained water entry images and slamming load data are compared with the simulation results.

Assembly drawing of high-speed pneumatic launcher.

Overall assembly drawing of model: (a) cylindrical model and (b) sensor.
The repeatability of this experiment is high, and there are repeated experiments for all the working conditions in this article, three to four times for each group of working conditions, eliminating the occurrence of accidental situations.
Numerical model
Geometric features
Figure 6 shows a schematic diagram of the water entry model. Three-dimensional solid cylinder with its axis perpendicular to the water surface enters the water. The radius r and height L of the cylinder are, respectively, 0.018 and 0.194 m. The mass of the model is 0.3 kg. The size of the fluid domain is 0.4 m × 0.4 m × 0.6 m, which is divided into water and air by discrete field distribution. The height of water is 0.5 m and the height of air is 0.1 m.
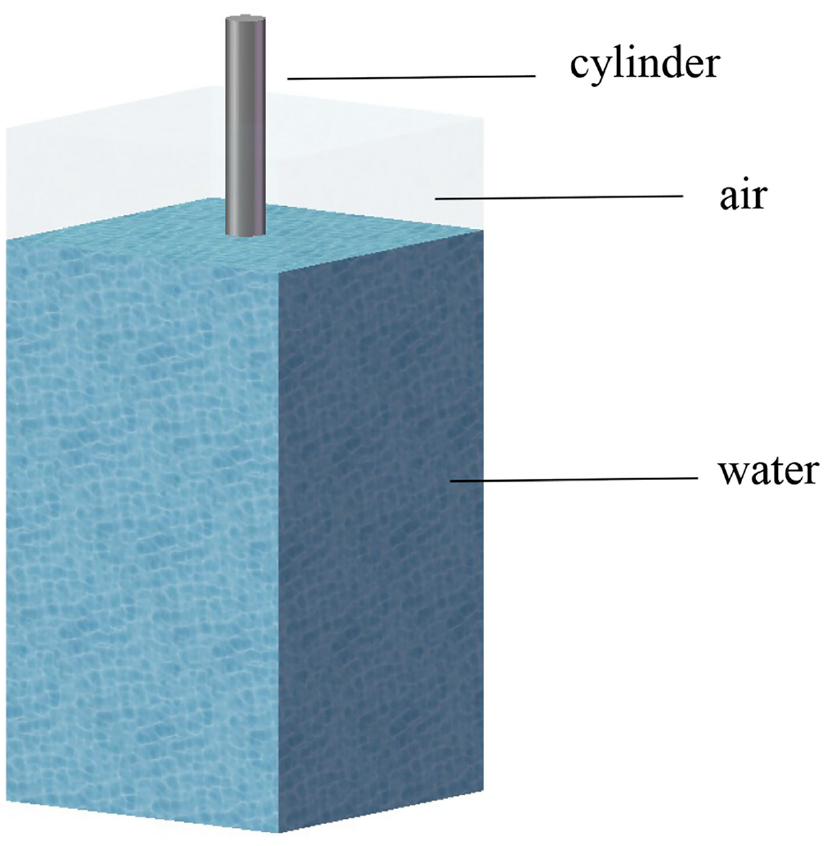
Schematic diagram of water entry model.
The pressure above the Euler domain is set at a standard atmospheric pressure, and no velocity boundary condition is applied to sides and bottom surfaces of Eulerian domain, which means fluid particles are impenetrable at the boundary. A gravity load is applied to the whole model. The acceleration of −9.8 m/s 2 perpendicular to the water surface is set. Displacement of the cylinder is not constrained in any direction and it can move freely in all directions.
Instead of simulating the full dropping event from the initial position, the cylinder is positioned close to the surface of water with prescribed initial velocity. Then, the cylinder enters the water at a speed of 14.37 m/s.
Figure 7 shows Euler domain size and meshing of half model. Cylinder is established by Lagrange method. Euler units are established in air and water areas to simulate water entry. Euler units and Lagrange units are similar in size.

Computational domain and meshing (half model).
Convergence analysis
The size of the whole fluid area is 0.6 m × 0.4 m × 0.4 m. In order to demonstrate the convergence of the numerical method, the whole area is divided into 0.5 million, 1 million, 1.5 million, and 2 million units, respectively. The sizes of corresponding grid are gradually refined. The cylinder enters the water vertically at a speed of 14.37 m/s. The center of the lower bottom surface of the cylinder is taken as a test point, and the slamming pressure time-history curve of the unit near this position is extracted. The model is submitted to a computer with 16 g of memory for calculation, and six CPUs are called. The calculation time is shown in Table 4.
Load peaks with different grid numbers.

The four curves in Figure 8 are, respectively, the load curves calculated after dividing different unit numbers. The four curves have the same trend: the initial load rises sharply and then gradually decreases to a stable level. In addition, due to the difference in mesh size, the smaller the units, the more stable the slamming pressure of the cylinder into the water. When different mesh sizes are selected, the variation trend of load curve tends to be consistent.

Load characteristics under different unit numbers.
In the experiment, the sensor is located at the head of the cylinder. The pressure measured in the experiment is compared with the slamming load time-history curves obtained by numerical calculation. The numerical results are in good agreement with the experimental results. The peak value and pulse width of the slamming load are very close, and the variation trend of the load curve is similar (Figure 9). In Table 4, the error of load peak value is controlled within 20%, and when the number of units reaches 2 million, the numerical error is 6%.

Load comparison between simulation and experiment.
The size and shape of the cavity at different unit numbers are approximately the same at time t = 0.3 ms, with slightly different splash shapes. In the case of 2 million units, the shape of the splash is obviously more delicate and clearer, which is the most obvious comparison with that of 0.5 million units. The shape of the cavity is closer to the experimental results when the number of units increases (Figure 10).

Diagram of cavity shape for different unit numbers at t = 0.3 ms.
Therefore, when the number of numerical units in this fluid domain reaches 2 million, the experimental results are more closely matched, which fully meets the requirement of accuracy.
Cavitation
When water entry angle α (the angle between the central axis of the model and the horizontal plane) is 85° and the velocity is 20 m/s, the process of water entry during the experiment and simulation is shown in Figure 11.

Shape diagram of projectile entering water (85°): (a) the process of water entry during the experiment and (b) the process of water entry during the simulation.
Figure 11(a) shows an image of the water entry experiment described in section “Experimental detail,” and the water entry angle is 85°; Figure 11(b) shows the corresponding simulated water entry image. The initial time (t = 0) corresponds to the moment that the bottom surface of cylinder touches the free surface. With the increase in water entry depth, the diameter of cavity expands continuously.
The changes in air cavity are basically similar in the early stage and that generated by the experiment is closed slightly earlier than that in the simulation. During the water entry experiment, different projectile launching speeds are obtained by adjusting the pressure of the high-pressure air chamber, and the accurate projectile launching speed is mainly determined by the actual measurement of the optical measurement system. When the pneumatic device launches the projectile into the water and the projectile exits the barrel, the free surface is corrugated due to the influence of air pressure, which is different from the static water surface during simulation, resulting in earlier closure of the air cavity during the experiment. In addition, the viscosity and surface tension of the liquid are also the reasons for this phenomenon.
The CEL method described above is used to simulate water entry of the model. The slamming load curves of the experimental value and simulation value of water entry are shown in Figure 12. The dashed red line is the curve drawn by the slamming pressure at the center of the lower surface of the simulation model, and the solid black line is the pressure curve measured by the sensor during the experiment. A good agreement can be observed between the simulation and the experiment. The result of experiment shows that the peak load is 1.98 MPa, while the simulated slamming load is 1.85 MPa, with an error of 6.6% and a similar pulse width. Compared with vertical water entry, the load peak value of oblique water entry is smaller.
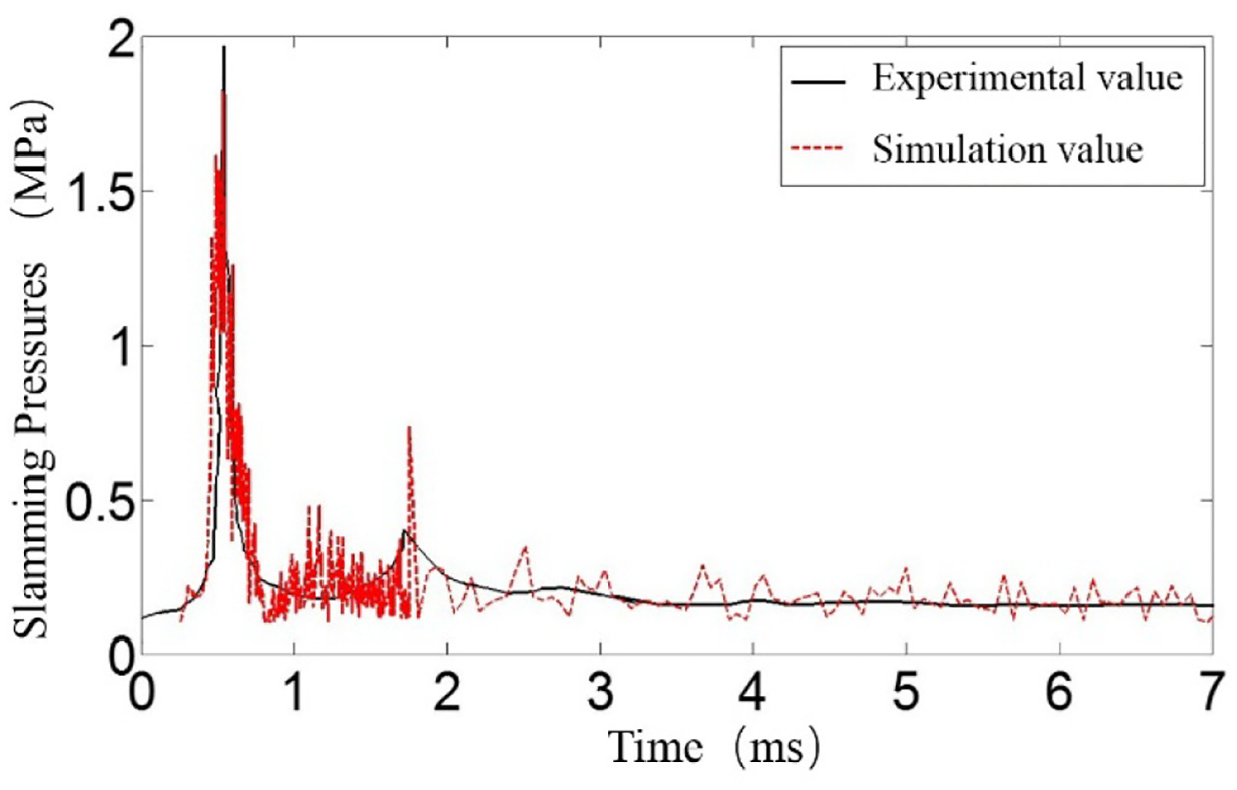
Comparison of water entry slamming load between experimental value and simulation value (85°).
Due to the slapping water of the cylinder, the fluid–solid interface is a water vapor mixture. The improved CEL adjusts the setting of air in the Euler domain module and sets the traditional void attribute as the air attribute. Besides, the velocity of sound wave in water is adjusted by setting the properties of water. Compared with the experiment, the slamming load and the cavitation shape are in good agreement.
Results and discussion
In order to analyze the influence of the water entry angles and speeds of the cylinder on the whole process, the experimental model (radius R = 0.018 m, height L = 0.194 m, mass m = 0.3 kg) was analyzed for oblique water entry. The water entry angles α are 30°, 50°, 70°, and 90°, respectively. The schematic diagram of the model is shown in Figure 13.

Model diagram (α, the angle between the central axis of the cylinder and the horizontal plane).
Dynamics analysis of the cylinder
Figures 14 and 15 are graphs showing changes in slamming pressure and acceleration of the cylinder under different water entry speeds. In the figures, the acceleration and slamming pressure increase significantly as the speed increases. When the speed is the same, the acceleration curve is similar to the slamming pressure curve at the initial stage of water entry. Later, the slamming pressure curve is more stable than the acceleration curve. The height of acceleration curve after 0.4 ms is larger than that of slamming pressure curve. It can be understood that when the cylinder enters the water, the maximum impact load occurs initially. At that time, the head just touches the water surface. The slamming pressure and acceleration reach the maximum. As the cylinder continues, the depth of water entry increases and the slamming pressure gradually decreases to a stable level. With the wet surface area increasing gradually, the force exerted on the cylinder by the water is not only the slamming of the head but also the force exerted on the side. Therefore, the acceleration curve is higher than the slamming load curve in the rear section.
Slamming load variation curves of cylinder under different water entry speeds.

Acceleration curves of cylinder under different water entry speeds.
Force analysis is carried out on the cylinder at the moment of maximum acceleration. The force on the structure is shown in Figure 16. F is the water entry slamming force. G is the gravity. According to Newton’s second law

where P is the slamming pressure on the head of the cylinder and

Simplified diagram of forces acting on a cylinder at the initial stage of water entry.
Since the maximum slamming pressure occurs at the initial stage of water entry, when studying the relationship between the slamming pressure and the maximum axial acceleration of the water entry, the size of A is determined roughly as the area of the bottom surface of the cylinder. Then,
According to the peak value of acceleration curve in Figure 15, the slamming pressure value is deduced as shown in Table 5.
Slamming pressure calculation and simulation comparison table.

The data in the column “Calculated value” are the peak acceleration data calculated by formula
By comparing the calculated slamming pressure with the simulated value, it is determined that the slamming pressure derived from acceleration is in an order of magnitude with the simulated slamming pressure, and the value calculated by acceleration is slightly larger than the simulation value.
Influence of the water entry speed on cavity shape and slamming load
Figure 17 is a shape diagram of water entry cavities at different depths of water entry. The water entry angle

Morphological comparison of water entry cavities of cylinder at different water entry depth: (a) H = 0.5 L, (b) H = L, and (c) H = 1.5 L.
The initial speed of water entry is 20 m/s, with the increase in the depth of water entry, the diameter of water entry cavity and the rise of liquid surface increase significantly (Figure 18).

Water entry cavities of cylinder when
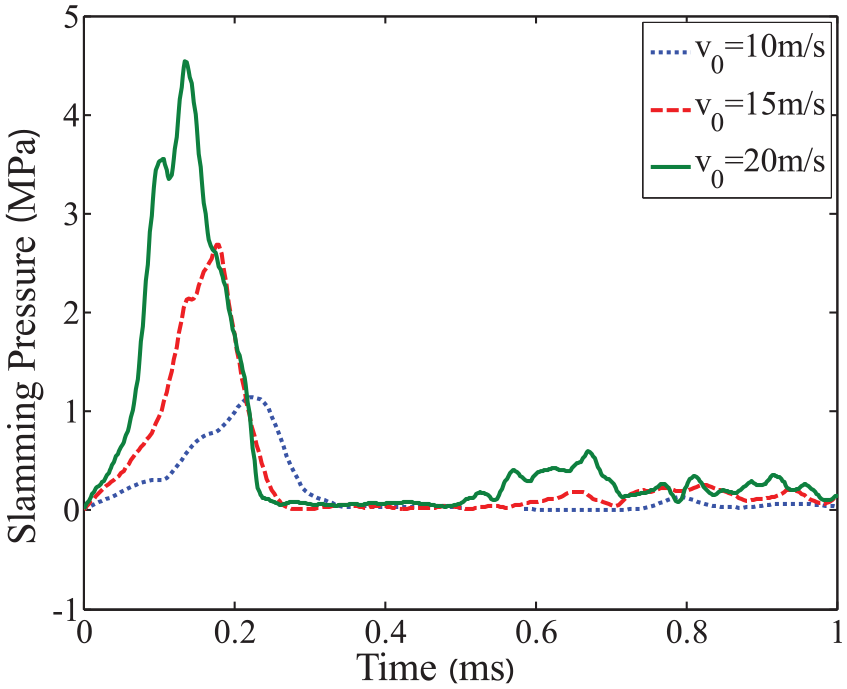
In Figure 19, under the three speeds, the trend of slamming load curves is similar. At the initial stage of water entry, the cylinder is subjected to a strong slamming load. At this time, the load curve shows the maximum peak value, and the speed of structure is significantly reduced. The water particles near the impact point get kinetic energy and then leave, and then, the slamming pressure rapidly decreases to the later stage and gradually becomes stable. The trend of the three load curves is similar. The higher the initial speed of water entry, the higher the load peak value.
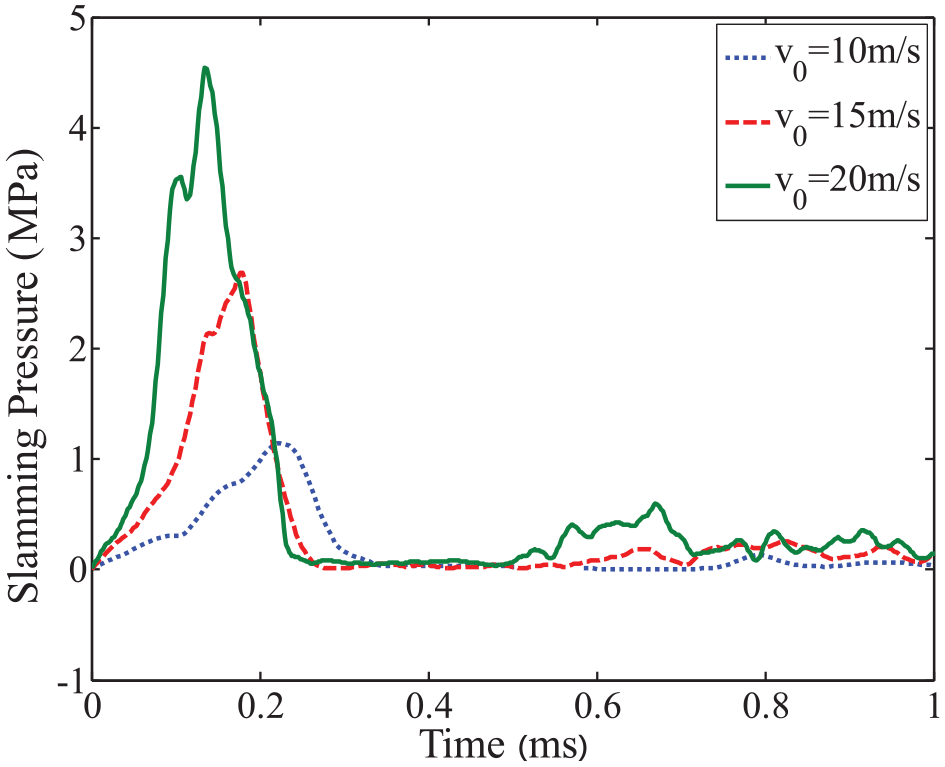
Variation curves of slamming load under different water entry speeds.
Influence of the water entry angle on cavity shape and slamming load
Figure 20 is a comparative diagram of water entry cavity shapes at different angles. The angles are 30°, 50°, 70° and 90°, respectively, and the speed is 14 m/s. In Figure 20, scale 0 on the ordinate indicates the free surface before water entry. After structure entering the water, air cavity appears and the liquid level starts to swell. At the beginning, the water entry angle of cylinder has not changed too much. The cylinder is subjected to strong impact load in the axial direction, and the speed is obviously reduced. When entering water vertically, the cylinder impacts the water surface, pushing away the surrounding water medium and forming a symmetrical cavity. When entering water obliquely, the fluid forms an asymmetric cavity. The cavity of the inflow surface is obviously larger than that of the other side. The smaller the angle of water entry, the more asymmetric the cavity is. When the depth of water entry reaches L (the length of the cylinder), the oblique water entry posture changes, and the head of the cylinder tends to tilt, mainly under the conditions of 30° and 50°. When continuing, the tail beat phenomenon occurs when entering obliquely. The tail of the cylinder contacts the liquid surface, which plays a certain role in inhibiting the change in the rotation angle. The asymmetry of cavity shape is more obvious during oblique water entry. The trend indicates that the cavity will seal earlier when the structure enters the water obliquely.

Comparison of cavity shapes at different water entry depth: (a) H = 0.5 L and (b) H = L.
Figure 21 shows the changes in the slamming load of the cylinder under the condition that the water entry angles are 30°, 50°, 70°, and 90°, respectively. The measuring position is taken at the center point of the head of the cylinder. At the initial stage of water entry, the slamming pressure rises abruptly. As the depth of water entry increases, the pressure drops to a stable value and shakes up and down. This trend is most obvious when the water entry angle is large. The larger the water entry angle is, the larger the slamming load is, and the slamming load is the largest when entering water vertically.

Variation curves of slamming load under different water entry angles.
The maximum slamming pressure at the water entry angles of 30°, 50°, 70°, and 90°, respectively, is obtained from Figure 21, and the dimensionless parameters

The maximum slamming pressure of water entry at different angles is calculated to obtain the four data points in Figure 22. The processed data points are subjected to curve fitting, and the fitting curve equation is

Schematic diagram of model slamming pressure under different water entry angles.
The larger the water entry angles, the greater the slamming load. With the increase in angles, the slamming load increases faster. It can be determined that the slamming pressure is the largest when the cylinder enters the water vertically. Therefore, for the water entry with high speed, considering the high slamming pressure of the head and adopting the load reduction method, the most dangerous condition must be analyzed first, that is, the vertical water entry of the structure with high speed.
Conclusion
In this article, an improved CEL method is used for numerical simulation. The feasibility of this method is analyzed, and the model of oblique water entry is established. The form of the water entry cavity with different water entry angles, the slamming pressure, and the acceleration of the structure are analyzed. The following conclusions are obtained.
Considering the influence of air content in water, sound wave speed in gas–water mixture has been revised. The comparison between numerical results and experimental data in section “Validation of calculation effectiveness” shows good agreement.
For oblique water entry, the radius and the expansion speed of the cavity on one side of the inclined inflow face are obviously larger than those on the back face. With the decrease in the water entry angle, the asymmetry on both sides is obviously increased. The slamming load is the largest when the water entry angle is 90°. After dimensionless treatment, the pressure peak value changes exponentially with the angle.
For vertical water entry, the slamming load goes up with the increase in water entry speed. The curve of slamming load is similar to that of acceleration in the initial trend, and the pressure calculated by acceleration is basically in agreement with the pressure obtained by simulation.
Footnotes
Declaration of conflicting interests
The author(s) declared no potential conflicts of interest with respect to the research, authorship, and/or publication of this article.
Funding
The author(s) disclosed receipt of the following financial support for the research, authorship, and/or publication of this article: This work is supported by the Fundamental Research Funds for the Central Universities of Ministry of Education of China (Grant No. HEUCFP201742).