
Abstract
Symptomatic intracerebral hemorrhage is a serious potential complication of recombinant tissue-type plasminogen activator thrombolysis in acute ischemic stroke. We investigated the optimal imaging and clinical parameters to predict symptomatic intracerebral hemorrhage in acute ischemic stroke patients after recombinant tissue-type plasminogen activator therapy. We retrospectively reviewed 151 acute ischemic stroke patients with thrombolytic therapy, who were dichotomized into symptomatic intracerebral hemorrhage group and non–symptomatic intracerebral hemorrhage group. They underwent multimodal computed tomography, including the measurement of permeability surface. We compared the clinical and radiological characteristics between symptomatic intracerebral hemorrhage group and non–symptomatic intracerebral hemorrhage group, using univariate analysis. Receiver operating characteristic analysis and multivariate logistic regression analyses were then used to determine symptomatic intracerebral hemorrhage predictors. Of 151 patients, 14 patients (9.27%) developed symptomatic intracerebral hemorrhage on follow-up imaging. Relative permeability surface (infarct permeability surface/contralateral normal permeability surface) (p < 0.05) and baseline low-density lipoprotein cholesterol level (p < 0.05) were both predictors of symptomatic intracerebral hemorrhage. Receiver operating characteristic analysis of relative permeability surface revealed an optimal relative permeability surface threshold of 2.239, with an area under the curve of 0.87 (95% confidence interval, 0.732–1.0). The relative permeability surface was 2.239, the sensitivity for symptomatic intracerebral hemorrhage was 85.7%, the specificity was 94.9%, the positive predictive value was 70.6%, and the negative predictive value was 95.5%. For low-density lipoprotein cholesterol, the optimal threshold was 2.45, with an area under the curve of 0.726 (95% confidence interval, 0.586–0.867), the sensitivity for symptomatic intracerebral hemorrhage was 73.0%, the specificity was 64.3%, the positive predictive value was 67.16%, and the negative predictive value was 79.09%. Our study demonstrated that increased infarct permeability surface and low level of low-density lipoprotein cholesterol can be two predictors of symptomatic intracerebral hemorrhage. Detection of relative permeability surface and low-density lipoprotein cholesterol may help clinicians to identify acute ischemic stroke patients with the higher risk of symptomatic intracerebral hemorrhage; intravenous thrombolytic therapy should be carefully performed for patients with high relative permeability surface and low low-density lipoprotein cholesterol. We may take relative permeability surface and low-density lipoprotein cholesterol into account to refine therapeutic decision-making in acute ischemic stroke.
Keywords
Introduction
Acute ischemic stroke (AIS) is a devastating condition with high mortality and disability in the world, early thrombolysis with recombinant tissue-type plasminogen activator (rtPA) remains a mainstay in the reperfusion therapy.1–4 However, symptomatic intracerebral hemorrhage (sICH) is the major concern in acute stroke treatment. With increase in the patients who underwent thrombolytic therapy, sICH is associated with approaching 50% mortality and significant morbidity.5,6 So, evaluating the risk of sICH becomes an important issue for improving the efficacy of this treatment strategy. To date, different clinical and radiological factors which contribute to rtPA-related sICH are identified, including time stroke symptom onset, advancing age, stroke severity, hypertension, infarct size, and other factors. Especially, the time stroke symptom onset is closely related to the efficacy of treatment.2,7–10 An accurate and timely imaging diagnosis of ischemic stroke is crucial for establishing an appropriate treatment. Multimodal computed tomography (CT), including non-contrast computed tomography (NCCT), computed tomography perfusion (CTP), and computed tomography angiography (CTA), is more available and rapidly accessible than magnetic resonance imaging (MRI) and is part of the routine acute care in many stroke centers. We sought to identify the optimal clinical, laboratory, and pre-treatment multimodal CT parameters for prediction of sICH in patients with AIS treated with rtPA in our center. We aim to optimize the decision-making process, so that more patients benefit and fewer patients undergo rtPA-related sICH.
Methods
Patient selection and clinical data
We retrospectively reviewed AIS patients admitted to stroke center of the First Hospital of Jilin University who received intravenous thrombolytic therapy with Alteplase from January 2016 to December 2018. When admitted to the stroke center, all patients underwent full clinical assessment by a neurologist with NIH Stroke Scale/Score (NIHSS) 11 and NCCT to exclude hemorrhage. The AIS patients for intravenous thrombolysis met the inclusion criteria as follows: the patient was adult (older than 18 years and younger than 80 years), time from symptoms onset to receiving NCCT scan less than 4 h, ischemic stroke confirmed by imaging, and informed consent was obtained from patient or authorized representative during the hospital stay. Exclusion criteria were as follows: intracranial hemorrhage or cancer, seizure on presentation, platelet count <100 × 109/L, major surgery within 14 days, gastrointestinal bleeding within 21 days, contrast medium allergy, kidney dysfunction, and pregnancy. These patients only received the thrombolysis treatment, but not with the mechanical thrombectomy.
Within 4.5 h after symptom onset, intravenous rtPA (Alteplase; Boehringer Ingelheim PharmaGmbH & Co.KG; 0.9 mg/kg) was administered according to the recommendations of current guidelines and physicians assessment, 10 following the admission of multimodal CT perfusion examination. After thrombolysis, all patients received standard medical treatment and general care in the comprehensive stroke center of our hospital.
The following NCCT was performed at 24 h and 1 week after the intravenous rtPA therapy, or anytime the patients need. Meanwhile, patients’ demographic characteristics and medical records were received. The data included age, sex, previous history (arterial hypertension, diabetes mellitus, smoking, alcohol use, and atrial fibrillation), symptom onset time, time to image, time to rtPA treatment, admission NIHSS score, blood glucose, blood pressure, blood lipid levels, and 90-day outcome. According to whether having symptomatic ICH after thrombolysis, the patients were dichotomized into two groups: sICH group and non-sICH group. Patients who were lost on follow-up or missed data were excluded from this study.
Imaging protocol
All patients underwent multimodal CT examination before recanalization therapy, including NCCT, CTP, and CTA with the Philip Brilliance 256-slice scanner (Philip Brilliance, The Netherlands), according to the brain CT protocol.
NCCT (120 kV, 250 mAs, 256 mm × 0.5 mm collimation, canthomeatal line as the radiographic baseline) was administered at least three times for the patient, first at admission to exclude hemorrhage before thrombolytic treatment, we can obtain the hyperdense artery sign (especially for the middle cerebral artery (MCA)) and early ischemic changes from it. The second NCCT scan was done at 24 h after the rtPA treatment, and a third scan on day 7, a control scan was performed at any time when neurological deterioration happened.
CTP (80 kV, 100 mAs, 128 mm × 0.625 mm collimation) was performed when the NCCT completed, a total of 50 mL contrast medium (Ultravist 370; Bayer Health Care, Berlin, Germany) was injected at 5 mL/s. Five-second delay after start of contrast medium injection, 40 consecutive spiral acquisition of the brain was obtained with 1.5 s each (acquisition time was 60 s), and total images acquisition time was 65 s. Images were formatted as 5-mm slices.
The monophasic CTA (100 kV, 135 mAs, 128 mm × 0.758 mm collimation) was performed after a 5-min delay from the aortic arch to the vertex with 50 mL of contrast medium (Ultravist 370; Bayer Health Care) at 4 mL/s.
Imaging postprocessing
The total time of CTP acquisition included image acquisition time and the postprocessing time. According to imaging protocol, the total image acquisition time was 65 s and the postprocessing time of CTP was up to 5 min, so the total time of CTP acquisition was up to 6 min. CTP source imaging data were analyzed by the commercially available software (the Intellispace Portal; Philips Healthcare, Best, The Netherlands). With the contrast medium mass intravenous injection, experienced neuroradiologist chose the anterior cerebral artery (ACA) as input artery, the superior sagittal sinus as the output venous, 12 and used the algorithm to deconvolve the tissue contrast function with the arterial input and venous output time-attenuation curves.13,14 Permeability surface (PS) parameter was related to the diffusion coefficient of the contrast agent through the capillary endothelium into the interstitial space, it could reflect the blood–brain barrier permeability (BBBP) and usually increased in ischemic stroke. 15 PS color maps were derived automatically with the software (CT Knetics, GE Healthcare, USA), we draw the perfusion abnormality as the region of interest (ROI), and the absolute PS value was obtained with software. Cerebral blood flow (CBF), cerebral blood volume (CBV), time to peak (TTP), mean transit time (MTT), and time to maximum (Tmax) were obtained as the same. The hemispheres were manually bisected, relative parameter values were normalized to the mean of the contralateral normal hemisphere to give relative PS (rPS), relative CBF (rCBF), relative CBV (rCBV), relative MTT (rMTT), relative TTP (rTTP), and relative Tmax (rTmax). Each parameter was measured at least twice, taking its average value.
With CTP parameters, we could acquire computerized automated map of the infarct and penumbra to evaluate stroke severity. The infarct core and penumbra were automatically calculated by using CBV and MTT thresholds, with most accurate parameters according to previous publications (MTT > 145% and CBV < 2 mL/100 g for infarct core, and MTT > 145% and CBV > 2 mL/100 g for the penumbra).16–18
CTA original images were analyzed by AVA software to reveal the presence, etiology, and site of occlusion, and we obtain vascular volume rendering (VR), maximum intensity projection (MIP), multiplanar reformation (MPR), and collateral filling data. We reported the number of patients with large artery occlusion in sICH group and non-sICH group, and classified patients in four types according to occlusion site: ACA, MCA, posterior cerebral artery (PCA), and other intracranial arteries (Others). Collateral filling was scored according to the previous report: 19 no collateral filling = 0; collateral filling ≤50% of the occluded artery territory = 1; collateral filling >50% but <100% of the occluded artery territory = 2; collateral filling all the occluded artery territory = 3.
Definition of sICH after thrombolysis
As European Cooperative Acute Stroke Study (ECASS) definition, symptomatic ICH after thrombolysis was defined as a clinically significant deterioration (an NIHSS increase of ≥4 points from baseline) or death within the first 7 days of treatment with evidence of either significant brain parenchymal hemorrhage or significant hemorrhagic transformation of an infarct on brain imaging. 20
Outcome
The clinical outcome was assessed at 90 days by modified Rankin Scale (mRS) with a score ranging from 0 (no symptoms) to 6 (death). We defined mRS scores >3 as a poor outcome and mRS scores ≤2 as a favorable outcome. The experienced neuroradiologist analyzed all the images and the clinical data.
Statistical analysis
Patients were divided into two groups, sICH group and non-sICH group. The candidate variables were expressed as medians with interquartile ranges for continuous variables and proportions for categorical variables. We performed univariate analysis to compare clinical and imaging data between the two groups. Pearson’s test or Fisher’s exact test was used for categorical data, and the two-sample t test or Mann–Whitney test was used for continuous data. We performed multivariate logistic regression analysis to assess independent sICH predictors, including all variables with p < 0.2 in univariate analysis (baseline NIHSS, low-density lipoprotein (LDL) level, rPS, large artery stenosis, infarct core volume, penumbra volume, and time to rtPA). The receiver operating characteristic (ROC) curves for rPS and low-density lipoprotein cholesterol (LDLC) were calculated to determine the best rPS and LDLC for prediction of sICH, featuring 1-specificity on the x-axis and sensitivity on the y-axis for different threshold criteria. The area under each ROC curve (AUC) was determined as a measure of performance, with the maximum possible area being 1.00. Sensitivity, specificity, positive predictive value, negative predictive value, and likelihood ratios were determined for rPS at different volumetric thresholds. Statistical analysis was performed using SPSS software (version 20.0; SPSS, IL). All p values are two sided; results were considered statistically significant at p≤ 0.05.
Results
Patients’ characteristics
Between January 2016 and December 2018, total of 163 patients were screened for this study, of which three patients missed the data of brain CT after thrombolysis, and nine patients did not have the complete laboratory data. Finally, 151 AIS patients who received the rtPA thrombolytic treatment were included in our analysis, as shown in Figure 1. Among them, 14 patients (9.27%) developed sICH; Figure 2(a)–(d) shows a typical case of sICH on follow-up CT within 1 week. There were 137 patients who had no sICH; Figure 2(e)–(h) shows the CT images in a typical case without hemorrhagic transformation. We classified the 14 patients with sICH according to the diagnosis time, 12 patients (85.71%) within 24 h and 2 (14.29%) after 24 h. Of 137 patients with non-sICH, 19 patients with asymptomatic ICH, the diagnosis time was the same as sICH patients, 16 patients (84.21%) within 24 h and 3 (15.79%) after 24 h. The baseline characteristics and risk factors had no statistical significance, including age, sex, hypertension, diabetes mellitus, smoking, alcohol use, atrial fibrillation, and hyperlipemia and other previous history as shown in Table 1.
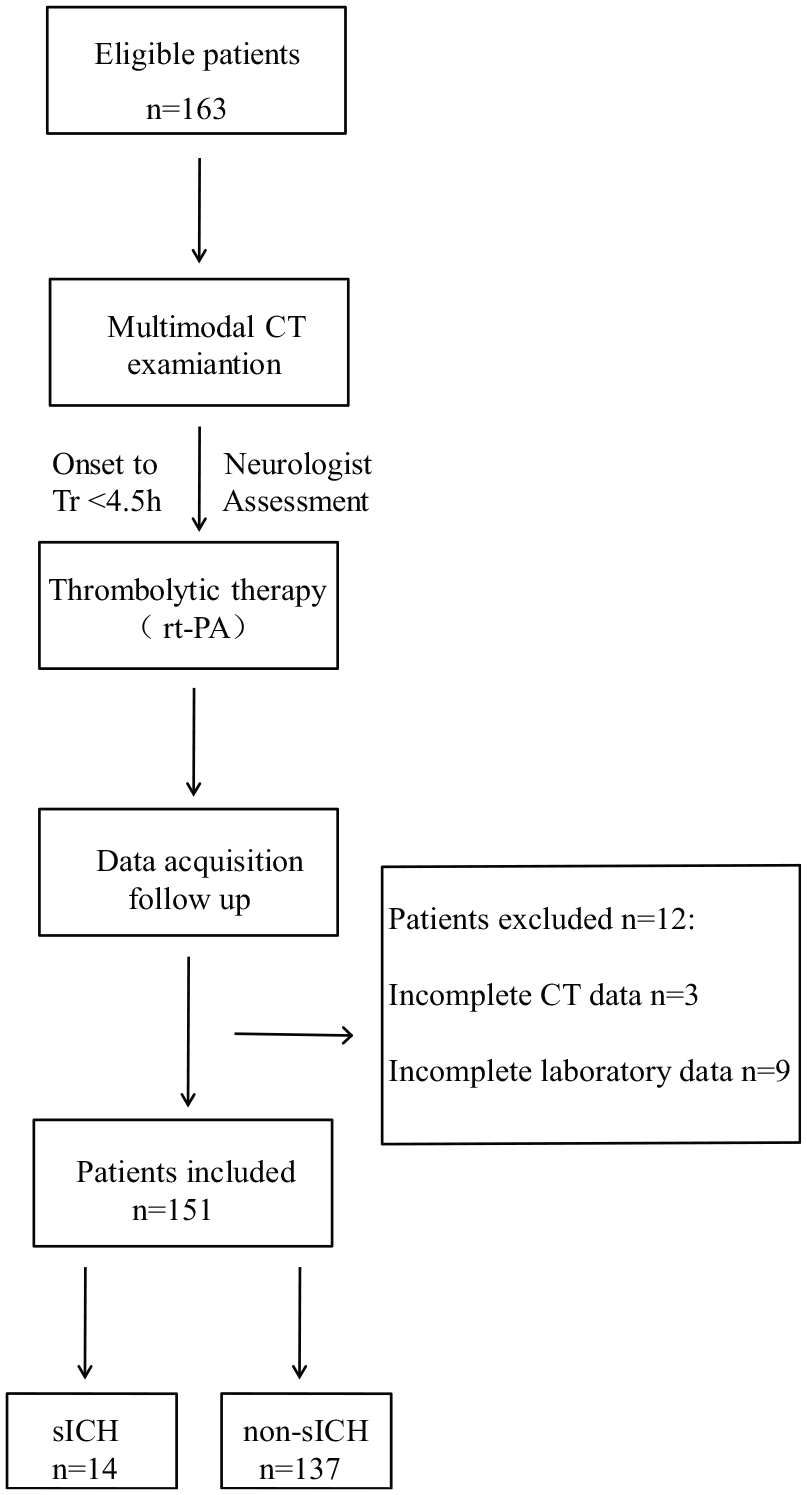
Flow chart of the study.
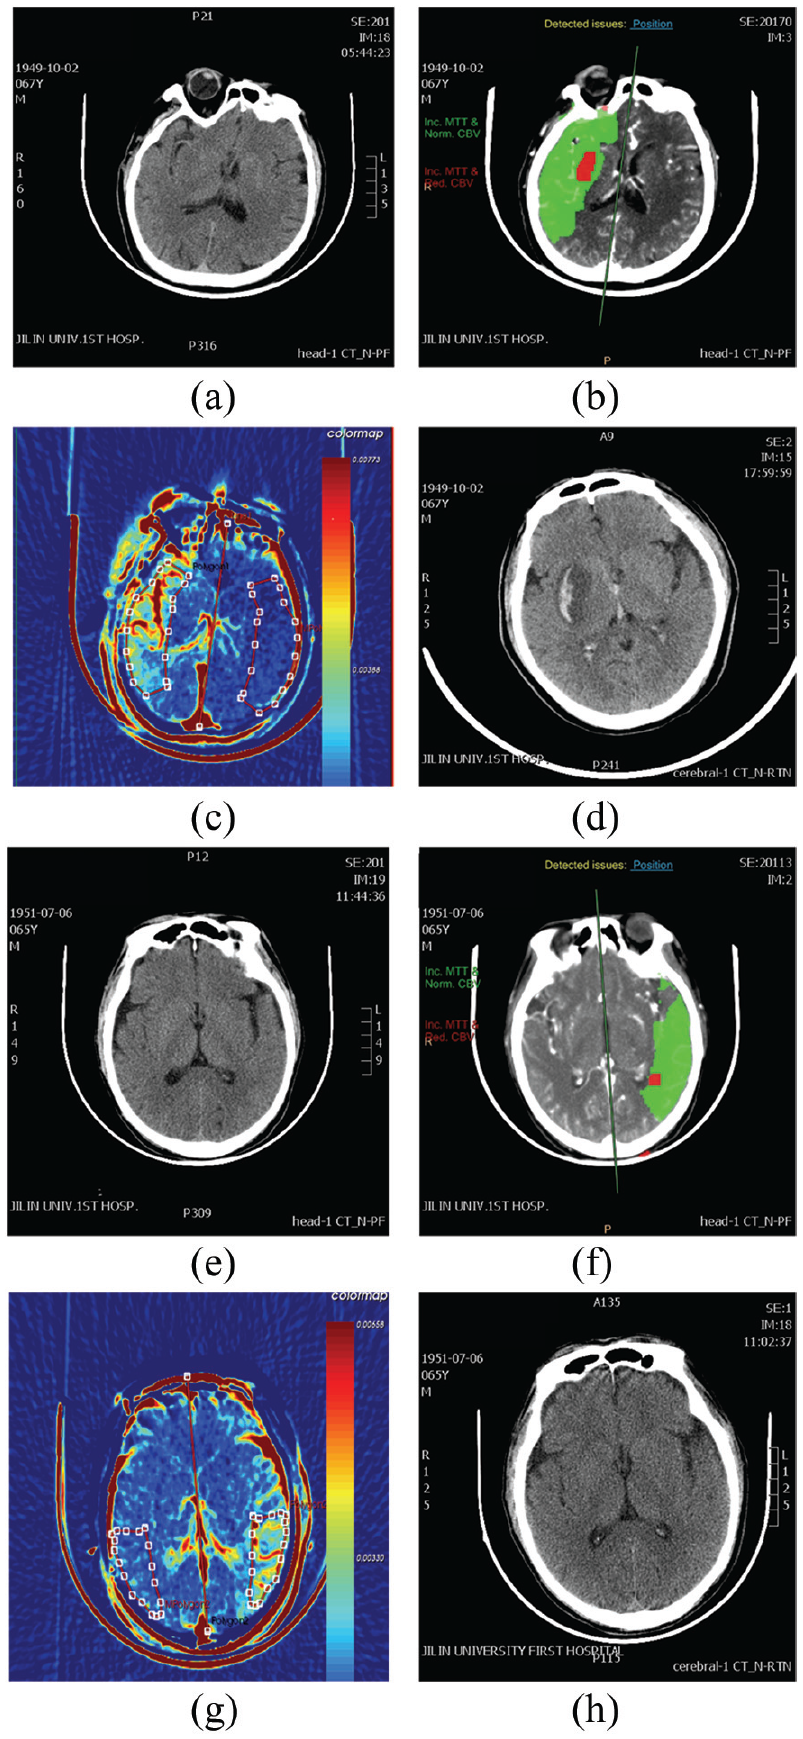
Multimodal CT images of sICH patient and non-sICH patient. (a–d) Images from a sICH patient: 67-year-old, male, with sudden onset of left hemiplegia and aphasia. (e–h) Images from a non-sICH patient: 65-year-old, male, with sudden onset of right hemiplegia and aphasia. (a) No abnormality on the emergency NCCT, except for hyperdense middle cerebral artery sign. (b) CTP shows hypoperfusion with right middle cerebral artery (the red part represents the core of the infarction, and the green part represents the ischemic penumbra). (c) PS map shows high infarct PS in right temporal lobe. (d) After 24-h rtPA treatment, follow-up NCCT shows hematoma in the right basal ganglia region, with bleed breaking into the brain ventricles. (e) No abnormality on the emergency NCCT. (f) CTP shows hypoperfusion with left middle cerebral artery (the red part represents the core of the infarction, and the green part represents the ischemic penumbra). (g) PS map showing high infarct PS in left temporal lobe. (h) After 24-h rtPA treatment, follow-up NCCT shows no hemorrhagic transformation.
Baseline characteristics of patients with acute ischemic stroke. a
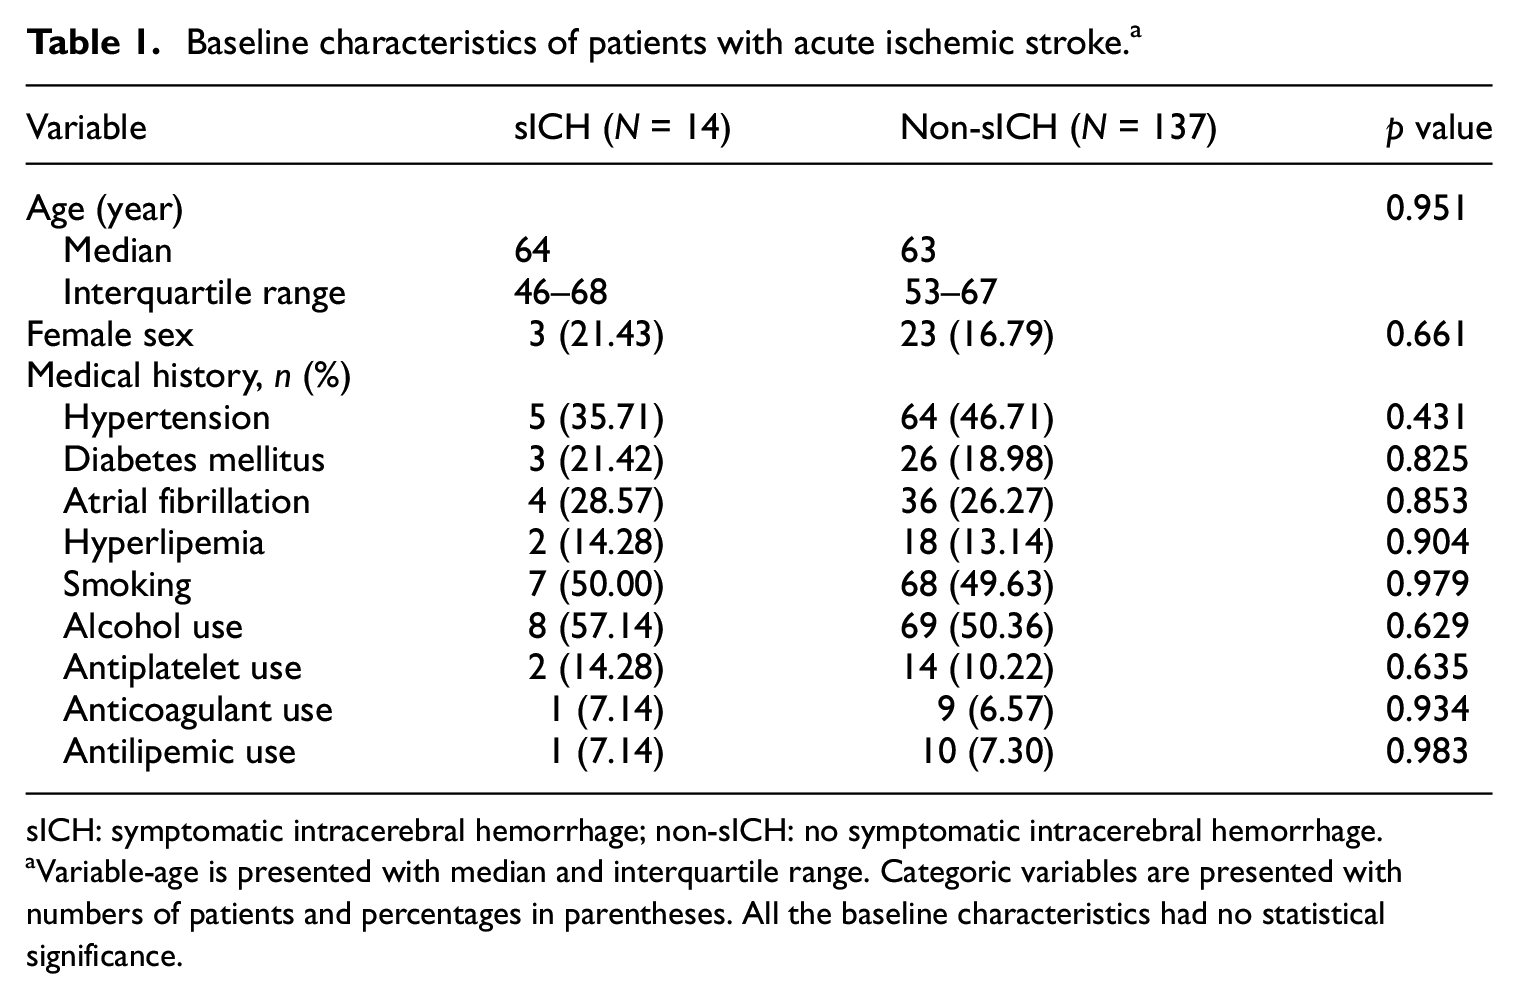
sICH: symptomatic intracerebral hemorrhage; non-sICH: no symptomatic intracerebral hemorrhage.
Variable-age is presented with median and interquartile range. Categoric variables are presented with numbers of patients and percentages in parentheses. All the baseline characteristics had no statistical significance.
Clinical and laboratory pre-treatment parameters of the sICH group and the non-sICH group are summarized in Table 2. The LDLC level of the sICH group was lower than the patients without sICH (p < 0.05, median: 2.28 mmol/L, interquartile range: 1.93–3.05 mmol/L in sICH group vs median: 2.76 mmol/L, interquartile range: 2.41–3.69 mmol/L in the non-sICH group). Of 137 patients in non-sICH group, there were 19 patients with asymptomatic ICH. The subgroup analysis of LDL showed that there was no statistical significance between sICH and asymptomatic ICH (p > 0.05, median: 2.28, interquartile range: 1.93–3.05 in sICH group vs median: 2.61, interquartile range: 1.89–3.27 in asymptomatic ICH group).
Clinical characteristics of AIS patients at hospital arrival. a

AIS: acute ischemic stroke; NIHSS: NIH Stroke Scale/Score; SBP: systolic blood pressure; HCY: homocysteine; sICH: symptomatic intracerebral hemorrhage; rtPA: recombinant tissue-type plasminogen activator; LDLC: low-density lipoprotein cholesterol; sICH: symptomatic intracerebral hemorrhage; non-sICH: no symptomatic intracerebral hemorrhage.
Continuous variables are presented with median and interquartile ranges. Only the LDLC level is statistically associated with the sICH group patients (p < 0.05).
NIHSS at hospital arrival.
NIHSS of 24 h after rtPA thrombolysis.
The highest NIHSS score during the 1 week after thrombolysis.
NIHSS of 7 days after thrombolysis.
Systolic blood pressure at hospital arrival.
Low-density lipoprotein level at hospital arrival.
Homocysteine level at hospital arrival.
Time to rtPA: time from symptoms’ onset to receiving rtPA thrombolysis.
Outcome: the clinical outcome was assessed at 90 days by modified Rankin Scale (mRS).
Despite the baseline NIHSS score was not statistically different (p > 0.05), sICH patients had significantly higher 24-h NIHSS (p < 0.05), higher day-7 NIHSS (p < 0.05), and highest NIHSS scores appeared between 72 and 96 h after thrombolysis. The systolic blood pressure (SBP), glucose level at arrival, and the time from symptom onset to the rtPA treatment are not statistically different (p > 0.05).
By 3 months, the clinical outcome was assessed by mRS. There were three patients with poor outcome (mRS = 6 also dead in two patients, mRS = 3 in one patient) and two patients lost to follow-up in the sICH group; meanwhile, only one patient with poor outcome (died, mRS = 6), and two patients lost to follow-up in the non-sICH group. Compared with non-sICH patients, the sICH patients were associated with higher mortality (14.29% vs 0.73%), higher loss of follow-up (14.29% vs 1.46%), and poorer outcome (21.43% vs 0.73%) (p < 0.05).
Imaging findings
Results of multimodal CT analysis are presented in Table 3. PS value was derived from CT perfusion, which could reflect the BBBP and usually increased in ischemic stroke. 15 We found that 151 patients’ PS value were increased in the infarct brain tissue, and the rPS >1.0 in all the enrolled AIS patients. The rPS was higher in patients with sICH than in patients without sICH (p < 0.05, median: 2.913, interquartile range: 2.369–3.436 in sICH group vs median: 2.007, interquartile range: 1.877–2.122 in non-sICH group). The box plots of the rPS are shown in Figure 3. We could find the mean rPS of sICH patients was higher than the patients without sICH (p < 0.05). Of 137 patients in non-sICH group, there were 19 patients with asymptomatic ICH and 118 patients with non-ICH. The subgroup analysis of rPS showed that there was no statistical significance between symptomatic ICH and asymptomatic ICH, but the mean rPS of sICH was higher than the patients with asymptomatic ICH (p > 0.05, median: 2.913, interquartile range: 2.369–3.436 in sICH group vs median: 2.211, interquartile range: 2.127–2.892 in asymptomatic ICH group). And there was no statistical significance between asymptomatic ICH and non-ICH, but the mean rPS of asymptomatic ICH was a little higher than the patients with non-ICH (p > 0.05, median: 2.211, interquartile range: 2.127–2.892 in asymptomatic ICH group vs median: 2.171, interquartile range: 1.947–2.459 in non-ICH group).
Multimodal CT parameters of AIS patients. a

CT: computed tomography; AIS: acute ischemic stroke; NCCT: non–contrast computed tomography; sICH: symptomatic intracerebral hemorrhage; CTP: computed tomography perfusion; rPS: relative permeability surface; HDS: hyperdense artery sign; ACA: anterior cerebral artery; MCA: middle cerebral artery; PCA: posterior cerebral artery; non-sICH: non–symptomatic intracerebral hemorrhage; rCBF: relative cerebral blood flow; rCBV: relative cerebral blood volume; rMTT: relative mean transit time; rTTP: relative transit time; rTmax: relative time to maximum; rPS: relative permeability surface.
Categoric variables are presented with numbers of patients and percentages in parentheses. Continuous variables are presented with median and interquartile ranges. The relative parameter values were normalized to the mean of the contralateral normal hemisphere to give rCBF, rCBV, rMTT, rTTP, rTmax, and rPS.
Other intracranial arteries.

The box plot of rPS of sICH.
We evaluated cerebrovascular by CTA before rtPA treatment. There were eight patients with large artery occlusion in sICH group and 50 patients in non-sICH group, there was no significant difference between the two groups (p > 0.05). According to the occlusion site, we classified patients into four types: ACA, MCA, PCA, and other intracranial arteries (Others). There was no statistical significance about occlusion site between two groups (p > 0.05, two patients of ACA, four patients of MCA, one patient of PCA, and one patient of Others in sICH group vs nine patients of ACA, 27 patients of MCA, eight patients of PCA, and six patients of Others in non-sICH group).
Infarct core volume and penumbra volume on CTP were no significant difference between sICH group and non-sICH group, but the mean core volume and the mean penumbra volume of sICH patients were higher than the patients with non-sICH (infarct core volume, p > 0.05, median: 14.68, interquartile range: 11.618–22.56 in sICH group vs median: 12.76, interquartile range: 8.325–17.64 in non-sICH group; penumbra volume, p > 0.05, median: 177.8, interquartile range: 134.55–200.925 in sICH group vs median: 145.84, interquartile range: 98.88–181.45 in non-sICH group). Other imaging parameters, hyperdense artery sign of the MCA, rCBV, rCBF, rMTT, rTTP, and rTmax did not affect the sICH risk in the AIS patients with thrombolysis.
Logistic regression analysis
We found two independent predictors of sICH using multivariate analysis in Table 4, namely rPS (odds ratio (OR): 9.617, 95% confidence interval (CI): 3.080–30.023; p < 0.05) and the LDLC level pre-treatment (OR: 0.178, 95% CI: 0.041–0.776; p < 0.05). To assess the prognostic power of our logistic regression model, we draw the ROC curve of rPS and LDLC (Figure 4). The ROC curve revealed an optimal rPS threshold of 2.239 with an AUC of 0.87 (95% CI, 0.732–1.0). At this threshold of rPS, the sensitivity for sICH was 85.7%, the specificity was 94.9%, the positive predictive value was 70.6%, and the negative predictive value was 95.5%. For LDLC, the optimal threshold was 2.45, with an AUC of 0.726 (95% CI, 0.586–0.867), the sensitivity for sICH was 73.0%, the specificity was 64.3%, the positive predictive value was 67.16%, and the negative predictive value was 79.09%.
Independent predictors for sICH.

sICH: symptomatic intracerebral hemorrhage; OR: odds ratios; CI: confidence intervals; LDLC: low-density lipoprotein cholesterol; rPS: relative permeability surface.
Two independent predictors are found using multivariate analysis.
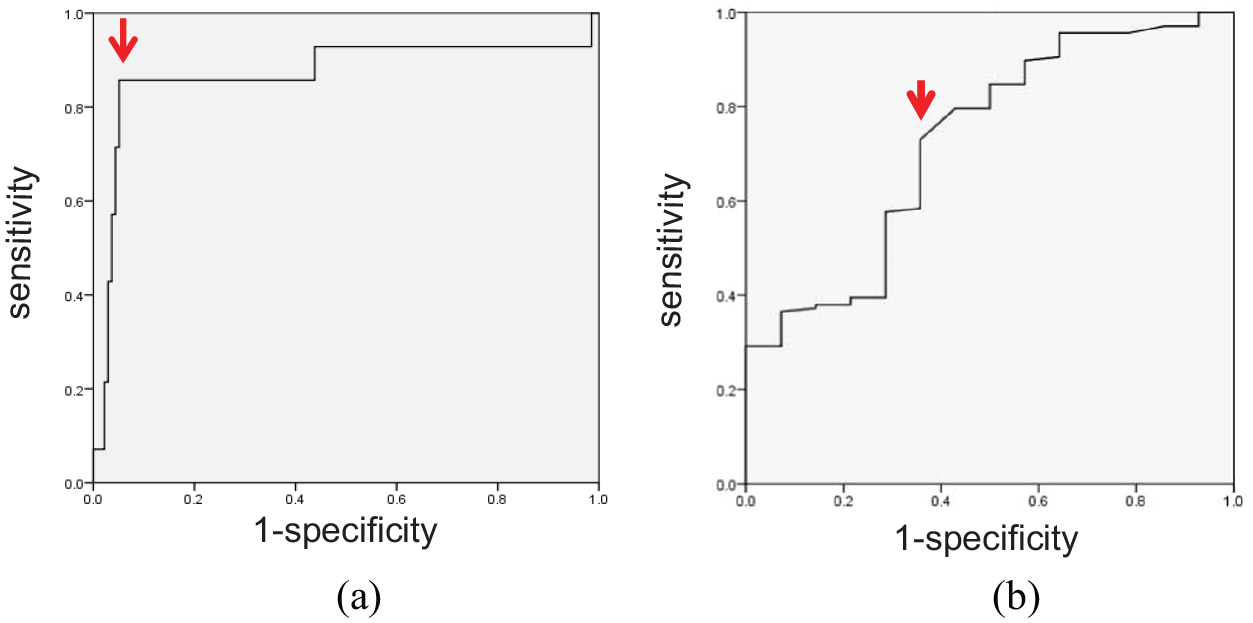
ROC for rPS and LDLC prediction of sICH: (a) ROC for rPS. A threshold rPS value of 2.239 is found to be optimal (red arrow), with an area under the curve of 0.87 (95% CI: 0.732–1.0). (b) ROC for LDLC. The optimal threshold was 2.45 (red arrow), with an area under the curve of 0.726 (95% CI: 0.586–0.867).
Discussion
Multimodal CT becomes routine examination attributed to the rapid access and much more cooperation in the emergency room for AIS patients21,22. Especially, the CTP processing is feasible, the time taken for image acquisition is typically 60–90 s, and when automated software is used, the subsequent reconstruction and processing time along with interpretation can occur in 5 min. 23 With the variable parameters of imaging and clinical data, we want to provide the early prognostic factors for rtPA-related sICH that may affect treatment decisions for the clinicians. From the retrospective study of 151 AIS patients who underwent the rtPA thrombolytic therapy, the sICH incidence was 9.27%, higher than the rate which ranged from 2% to 7% in the previous studies.5,6 This variation was likely the result of differences in study design, the populations treated, stroke severity, site of image adjudication, timing, and type of follow-up imaging, and whether a causal relationship was required between imaging and clinical worsening. The diagnosis time of the 14 patients with sICH and 19 patients with asymptomatic ICH, more than 80% was within 24 h after thrombolysis, which was coincident with previous studies.5,24 Interestingly, 11 of 14 patients with sICH were diagnosed as parenchymal hemorrhage 2 (PH2) on brain imaging,25,26 which was consistent with the idea that PH2 class of hemorrhage has been significantly associated with poor outcomes. 27
Based on CT perfusion, PS was derived, which could reflect the BBBP. In AIS patients, higher PS is associated with hemorrhagic transformation, malignant edema, and high mortality.15,16 When the stroke happens, the hypoperfusion of brain parenchyma contributes BBB disruption, rtPA recanalization treatment can make the occluded artery reperfuse and promote blood burst in the ischemic lesion with injured BBB and hemorrhagic transformation occurs. 28 In this study, we found that infarct PS elevated greatly, and PS was significantly higher in sICH group (p < 0.05), which confirmed this mechanism for the sICH. Higher rPS could help us to identify patients who have higher risk of sICH before thrombolysis.
In this study, we demonstrated that the lower level of LDLC in sICH group was the independent risk factor to predict sICH. There has been a dispute over the low level of LDLC attributed to the sICH in recent years. Some studies explored the risk factors for the sICH which showed that LDL is inversely related to sICH29–31 and pre-treatment with statin was associated with the sICH after intravenous thrombolysis. 32 However, some studies revealed that total cholesterol, LDL, and statins’ use had no influence on occurrence of sICH.33–35 Our study revealed that lower level of LDLC increased sICH risk in the AIS patients with the rtPA therapy. But we have no valid idea according to the statins’ use for the sICH risk, because that only a few patients use statins in our research, one patient in sICH group and 10 in non-sICH group. The mechanisms of low level of LDLC increased the risk of sICH are not yet. Due to adequate lipid maintaining integrity of endothelial cells in small cerebral vessels, fewer lipid causes unstable integrity. After recanalization therapy for AIS patients, blood extravasates over the unstable integrity of endothelial cells in small cerebral vessels, and hemorrhagic transformation happens. 36 Therefore, the application with statins should be individualized, and for the high-risk sICH patients, prescription of lowering LDLC should be cautious. This study showed that rPS and LDLC were two factors which could predict sICH. In our clinic practice, when rPS value was >2.239 or LDL <2.45, the risk of sICH increased. Therefore, intravenous thrombolytic therapy should be carefully performed for patients with high rPS and low LDLC. We may take rPS and LDLC into account to refine therapeutic decision-making in AIS.
As our population was small, this was a retrospective study from a single primary stroke center, and the confidence interval for rPS in regression model was wide, our study had certain limitations. We need further analysis with a larger number of patients and the optimal value for rPS and LDLC for sICH, to make more patients benefit from thrombolysis.
Conclusion
Our study demonstrated that increased infarct PS and low level of LDLC can be two predictors of sICH. Detection of the rPS and LDLC may help clinicians to identify AIS patients with the higher risk of sICH, intravenous thrombolytic therapy should be carefully performed for patients with high rPS and low LDLC. We may take rPS and LDLC into account to refine therapeutic decision-making in AIS.
Footnotes
Declaration of conflicting interests
The author(s) declared no potential conflicts of interest with respect to the research, authorship, and/or publication of this article.
Funding
The author(s) disclosed receipt of the following financial support for the research, authorship, and/or publication of this article: This work was supported by the National Natural Science Foundation of China (grant no. 81700124) to H.Y.