
Abstract
It is of great practical significance to accurately obtain formation collapse pressure and determine an effective three-pressure profile with a correct strength criterion in the drilling process to identify the best drilling fluid density. Taking the tight sandstone of the XuJiahe formation as an example, we conducted a series of rock mechanics tests, focusing on large-scale, high-density confining pressure triaxial experiments; determined a mathematical expression for the continuous tangent envelope of a nonlinear Mohr circle envelope based on a series of triaxial tests; and clarified the variation rules of cohesion force and internal friction angle with confining pressure. The impact of rock mechanics parameters determined by using the traditional method and the continuous tangent envelope method on wellbore stability is compared and analyzed by using the MathCAD program, and then the collapse pressure is obtained. The results show that the parabolic curve derived from the uniaxial rock mechanics test data of the XuJiahe formation is not suitable for the triaxial test results under high confining pressure. By means of the continuous tangent envelope method, the relationship between rock cohesion and internal friction angle and confining pressure is obtained; this replaces the traditional collapse pressure calculation results using geophysical logging data or uniaxial tests, and the relationship between cohesion and friction angle is more consistent with confining pressure. The MathCAD simulation analysis shows that the rock mechanics parameters determined by the continuous tangent envelope can reflect the stratum situation more truly than the linear envelope method. Compared with the linear envelope method and parabolic envelope method under the same conditions, the continuous tangent envelope method has certain advantages in determining the critical density, which provides a theoretical basis for the accuracy of sandstone formation collapse pressure calculation and can give significant guidance for the study of wellbore stability of deep sandstone formations.
Introduction
Wellbore stability is the key to ensuring drilling safety during drilling. Pore pressure, fracture pressure, and collapse pressure determine the reasonable range of drilling fluid density. 1 Therefore, the determination of the three-pressure profile plays a crucial role in avoiding wellbore instability. The pore pressure and fracture pressure lines are relatively clear, fixed, and easy to measure. However, collapse pressure is not clear and fixed, so it cannot be directly measured.2,3 Collapse pressure is a complex, variable parameter that is related to wellbore stability around the well. It is specifically determined by the nature of the surrounding rock, burial depth, temperature, pressure, formation pore pressure, properties of the drilling fluid, and other factors. 4 Researchers in China and abroad have found that the occurrence of shaft wall collapse is mainly related to in-situ stress. 5 In petroleum engineering, the borehole formed in the drilling process will break the original underground stress balance and concentrate the stress on the rock around the well. By analyzing downhole rock strength and wellbore stress states, researchers can establish a wellbore collapse model based on certain strength criteria and finally determine the optimal drilling fluid density. Therefore, the strength criterion used is the key to determining the accuracy of the collapse pressure prediction. 6 It is of great practical significance to obtain the accurate formation collapse pressure, the effective three-pressure profile, and the best drilling fluid density.
Owing to different understandings of rock strength characteristics, many scholars (such as Mohr,7–9 Drucker and Prager, 10 Hoek and Brown,11,12 Mogi, 13 Yu,14,15 etc.) have proposed various rock strength criteria in the past decades. The International Society of Rock Mechanics (ISRM) has also proposed methods to standardize the practical application of different strength criteria. 16 Many rock strength criteria are generally put forward under the condition of low confining pressure, which limits their application scope. When the confining pressure is relatively low, the estimated strength of the criterion is basically the same as the test strength, but with the gradual increase of confining pressure, the estimated strength will exceed the test strength. Under high confining pressure, the rock triaxial strength evaluated by these criteria deviates greatly from the experimental strength. At present, mechanical research on rocks under high in situ stress is mainly conducted through rock triaxial compression tests in laboratories. For example, Li et al. 17 and Arzua et al. 18 found that the relationship between σ1 and σ3 was linear under low confining pressure but nonlinear under high confining pressure through triaxial tests on rocks. Li et al., 19 Tarasov and Potvin 20 and other scholars conducted triaxial loading failure tests on rocks under low confining pressure and high confining pressure, respectively, and believed that the stress–strain curve of rocks presented linear elasticity under low confining pressure while presenting nonlinear and plastic deformation characteristics under high confining pressure. Singh et al. 21 aimed at the limitation that traditional Mohr–Coulomb strength criterion can only represent the change of rock triaxial strength with confining pressure linearly, improved it by applying the concept of rock critical state, 22 and proposed a nonlinear Mohr–Coulomb strength criterion, which can represent the nonlinear change of rock triaxial strength with confining pressure. Given the difficulty in obtaining downhole cores in petroleum engineering, it is necessary to achieve the best balance between the simple method of obtaining rock mechanical parameters and the accurate prediction of formation rock strength. The classic Mohr–Coulomb criterion is still the most applicable intensity criterion. 23
As mentioned above, there are many complicated relationships among the factors affecting collapse pressure. This study only focuses on one of them, that is, the influence of liquid column pressure on collapse pressure. In this study, the drilling fluid column pressure is equivalent to the confining pressure in the triaxial rock mechanics test, and a series of failure tests on rock samples under different confining pressures is conducted. The test results are drawn as the envelope of the Mohr stress cluster, and the relationship between rock cohesion and internal friction angle and confining pressure is obtained by using the continuous tangent envelope method, which replaces the results of uniaxial cohesion and internal friction angle in the traditional collapse pressure calculation. Use of this method improves the accuracy of the calculation of formation collapse pressure, thus providing a theoretical basis for ensuring wellbore stability in the drilling of sandstone formations, and is conducive to improving the drilling speed under the condition of maintaining wellbore stability.
Materials and methods
With the tight sandstone of the XuJiahe formation taken as an example, tests were conducted on the surface outcrop of tight sandstone of the XuJiahe formation on the numerous cores available offering good homogeneity; tests included uniaxial tensile tests, uniaxial compression tests, and triaxial rock mechanics tests of variable confining pressure with large-scale and high density. In this study, the uniaxial tensile strength of rock was first determined by the Brazilian fissuring method. According to GB 23561.1-2009 (Methods for determination of physical properties of coal and rock), rock samples were fashioned into specimens with length × diameter of 25 × 50 mm2. Then, the cores were baked in a drying oven at 105°C for 24 h, and then the rock samples with obvious heterogeneity and defects were screened out by means of observation and screening with a microscope, and rock samples meeting the standards were screened by an acoustic testing device. Similarly, according to GB 23561.1-2009, rock samples were fashioned into specimens with a length × diameter of 50 × 25 mm2, and then rock samples were screened according to a uniaxial tensile test method. Rock samples with obvious heterogeneity and defects were eliminated, and rock samples meeting the standard were selected for the uniaxial compression test.
The above experiments are only uniaxial without confining pressure. The triaxial rock mechanics experiment equates the drilling fluid column pressure to the confining pressure in the test. A confining pressure effect exists in the triaxial experiment, 24 which only tells us qualitatively that “rock strength changes with confining pressure.” However, for a given specific rock, the specific quantitative law governing this change must be determined by a series of triaxial compression rock mechanical tests with varying confining pressure. A triaxial experiment of large-scale, high-density variable confining pressure is adopted. The term “large-scale” refers to the segmentation of a given stratigraphic unit (i.e. a stratigraphic block with basically the same lithology). The sample is pressurized from zero confining pressure (corresponding to gas drilling and empty boreholes in engineering) to the maximum confining pressure (i.e. the liquid column pressure corresponding to the maximum well-depth and drilling fluid density of the formation unit). “High density” means that, starting from zero confining pressure, the confining pressure experiment is conducted every 5 or 10 MPa, and each confining pressure experiment is repeated three times to take the average value. In other words, three rock samples were tested repeatedly under the same confining pressure (to eliminate the influence of heterogeneity) up to the highest confining pressure. The step spacing of confining pressure variation in the triaxial test should be dense enough so that deformation and failure of the rock can be depicted smoothly and continuously and a quantitative multiparameter model describing the variation of failure strength as accurately and truly as possible can be established.
In this triaxial experiment, the surface outcrops of tight sandstone in the XuJiahe formation from the available cores offering good homogeneity were selected for the test. Similarly, according to GB 23561.1-2009, the rock sample was fashioned into specimens with a length × diameter of 50 × 25 mm2, and the end face was ground flat. Parallelism error of the two end faces was required to be ≤0.5 mm. There are 39 cores in total, and some core samples from the triaxial experiment are shown in Figure 1.

Tight sandstone of XuJiahe formation.
All the mechanical experiments were conducted with a GCTS confining triaxial rock mechanics testing machine imported from the United States, as shown in Figure 2. The complete set of equipment consisted of a high-temperature, high-pressure triaxial chamber, a confining pressure system, an axial pressure system, and a data automatic acquisition and control system. The maximum axial force of the test system was 1000 KN, the maximum confining pressure was 140 MPa, the maximum pore pressure was 140 MPa, the maximum dynamic frequency was 10 Hz, and the highest temperature was 150°C. The experimental control accuracy was 0.01 MPa, the liquid volume was 0.01 g/cm3, and the deformation was 0.001 mm. Signals such as confining pressure, axial load, displacement, and strain were collected and controlled by an SCN2000 Digital System Controller.

RTR-1000 triaxial rock mechanics test system.
Experimental results
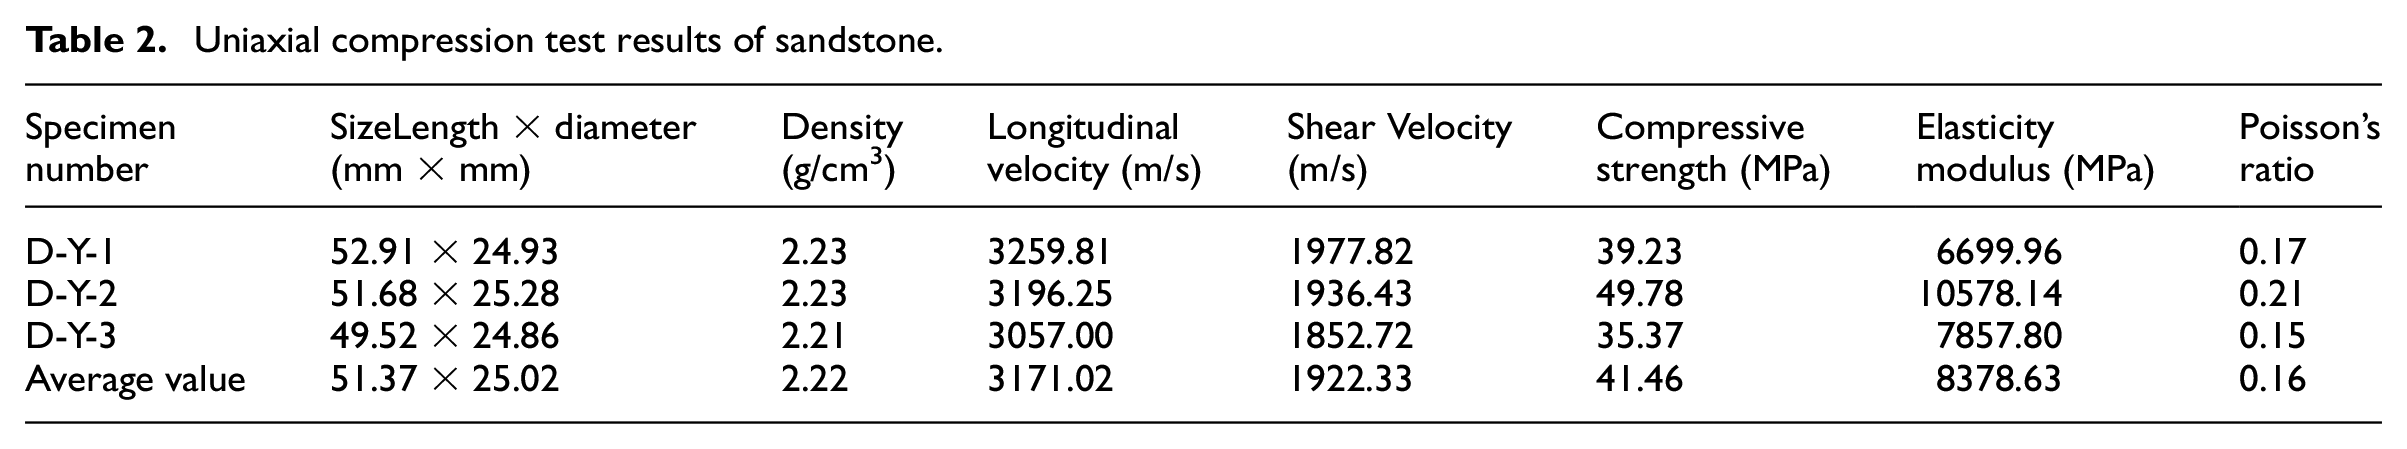
The uniaxial tensile experiment and uniaxial compression experiment were conducted in accordance with the above methods, and the experimental results are given in Tables 1 and 2.
Uniaxial tensile test results of sandstone.

Uniaxial compression test results of sandstone.
According to the experimental method of large-scale, high-density variable confining pressure, a triaxial experimental mechanical test was conducted. The experimental results of rock strength and other rock mechanical parameters under different confining pressures are given in Table 3.
Confining pressure test results of tight sandstone in the XuJiahe formation.
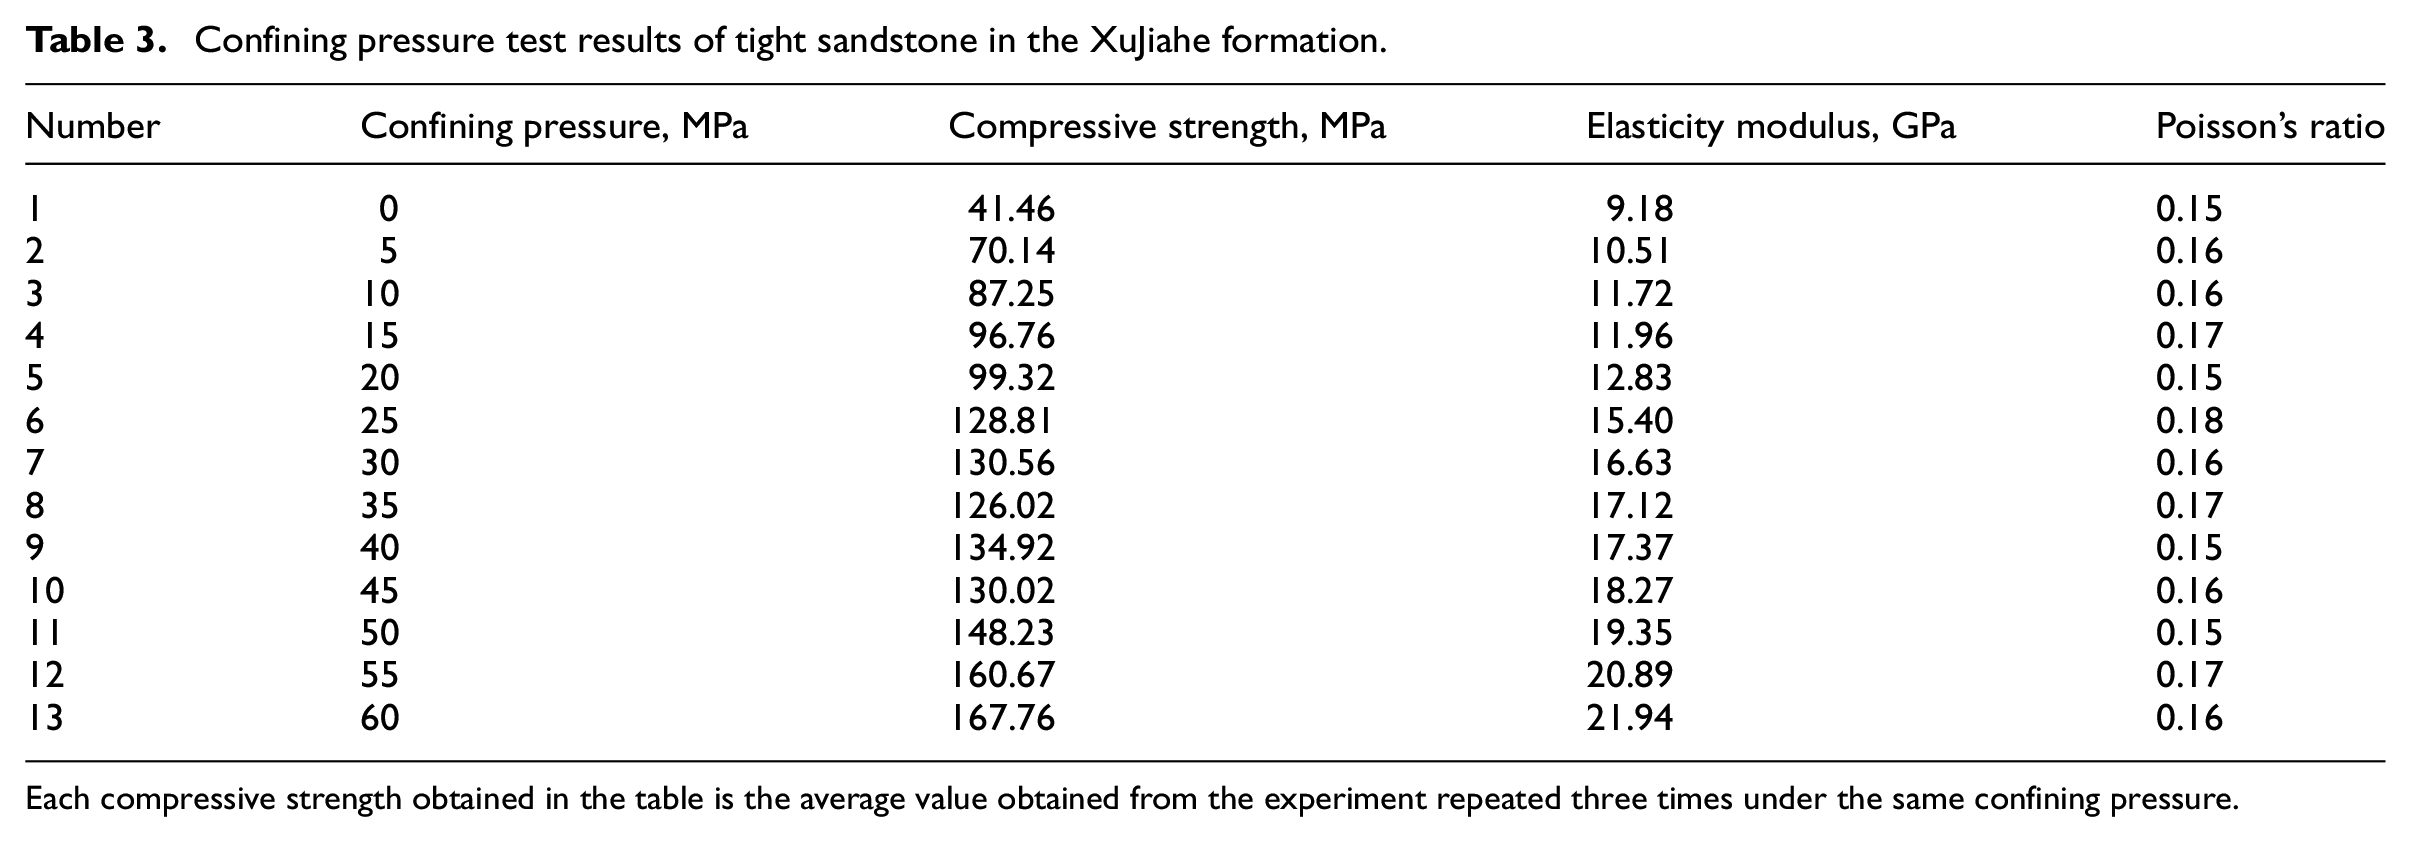
Each compressive strength obtained in the table is the average value obtained from the experiment repeated three times under the same confining pressure.
It can be seen from Tables 1 and 2 that the average uniaxial tensile strength of the tight sandstone in the XuJiahe formation is 6.53 MPa, and the average uniaxial compressive strength is 41.46 MPa. The uniaxial tensile strength, uniaxial compressive strength, elastic modulus, Poisson’s ratio, and other parameters are significantly different from those of rock samples from the same stratum. This is due to rock heterogeneity, anisotropy, and the loading speed of the instrument during the experiment. It can be seen from the triaxial test results of tight sandstone in the XuJiahe formation that the compressive strength and elastic modulus of rock samples are positively correlated with confining pressure. This is because, with the increase of confining pressure, compaction inside the sample increases and the resistance to deformation also increases.
Theory and calculation
Continuous tangent envelope method
The linear Mohr-Coulomb strength criterion can be expressed as 25

Where σ is the normal stress (in MPa), φ is the internal friction angle (in degrees), and C is the cohesion (in MPa). The linear Mohr criterion is not only simple and clear but also takes into account the confining pressure effect and the difference in tensile strength. The two parameters C and φ in the equation can be simply obtained from the uniaxial tensile strength σt and the uniaxial compressive strength σc

Where σc is the uniaxial compressive strength (in MPa) and σt is the uniaxial tensile strength (in MPa).
According to the Mohr–Coulomb strength criterion, the compressive strength of rocks increases linearly with confining pressure under the condition of triaxial confining pressure. Mohr found that the relationship between compressive strength and confining pressure is nonlinear when the confining pressure is high and the variation range is large. At present, the nonlinear Mohr parabola criterion commonly used in the field of rock engineering is the Fairhurst criterion 26

Where
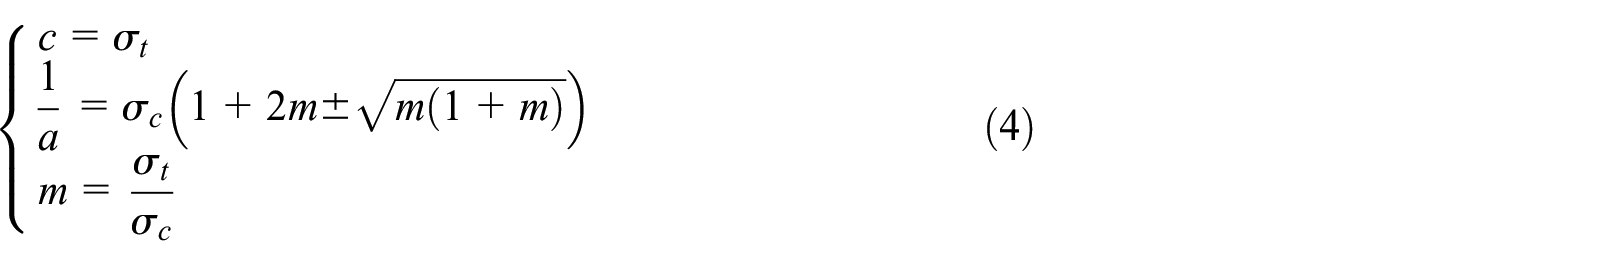
Where σ1 and σ3 are the maximum and minimum principal stresses (in MPa), respectively; σt and σc are the uniaxial tensile strength and uniaxial compressive strength (in MPa), respectively; and a and c are constants.
By substituting the uniaxial tensile strength σt and uniaxial compressive strength σc related parameters of the tight sandstone of the XuJiahe formation into equations (3) and (4), the parabolic curve of the tight sandstone of the XuJiahe formation is obtained as follows

The parabolic curve σ1–σ3 obtained is compared with the series confining pressure test results of the tight sandstone of the XuJiahe formation, as shown in Figure 3.

Comparison of parabolic criterion and confining pressure test results.
It can be seen from Figure 3 that the two are not very consistent, especially in the high-confining-pressure part of the deviation. The reason why the above nonlinear Mohr criteria are applied well in the field of ground engineering is that the depth involved in ground engineering is usually from tens to hundreds of meters, whereas the corresponding confining pressure of triaxial rock mechanics is relatively low. Therefore, the three-axis strength criterion based on the uniaxial rock mechanics experiment is not much different from the actual project in the field. However, in the oil and gas drilling field, the well depth is thousands of meters to nearly 10,000 m, and the drilling fluid column pressure (equivalent to the conventional triaxial confining pressure) is at least dozens to hundreds of MPa. In this case, it is obvious that the nonlinear criterion of the uniaxial experiment in the field of rock mechanics cannot be adapted, so a new nonlinear criterion is necessary.
The three-axis experimental results of the tight sandstone of the XuJiahe formation were plotted on a scatter diagram of σ1 - σ3 coordinates. In

The drawing of triaxial experimental results of tight sandstone in the XuJiahe formation: (a) σ1–σ3 coordinate scatter diagram and (b) Mohr stress cluster.
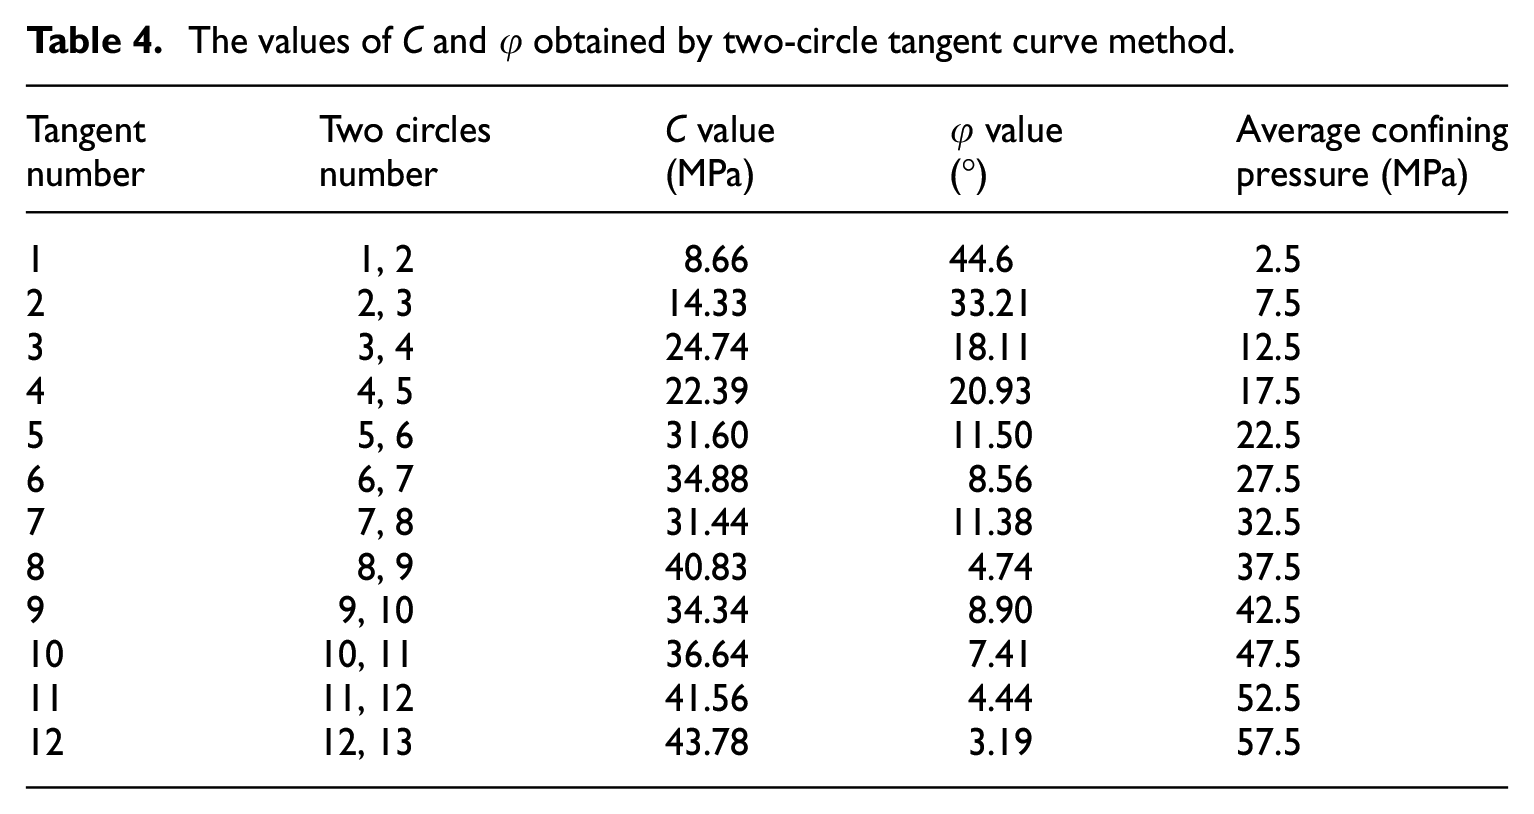
According to the algorithm for the common tangent of two circles, starting from the first circle, a series of tangent lines are tangent to each other, and each tangent line has intercept Ci and inclination φi. The schematic diagram is shown in Figure 5.

The schematic diagram of continuous tangent curve.
If the principal stress is used to represent the common tangent of the two-Mohr circle, the calculation formula is as follows 25

By putting the tested triaxial experimental data into formula (6), the C and φ values can be obtained by the two-circle common tangent method, and the results are listed in Table 4.
The values of C and φ obtained by two-circle tangent curve method.
The values of C and φ are plotted with the variation of confining pressure (average confining pressure), as shown in Figure 6:
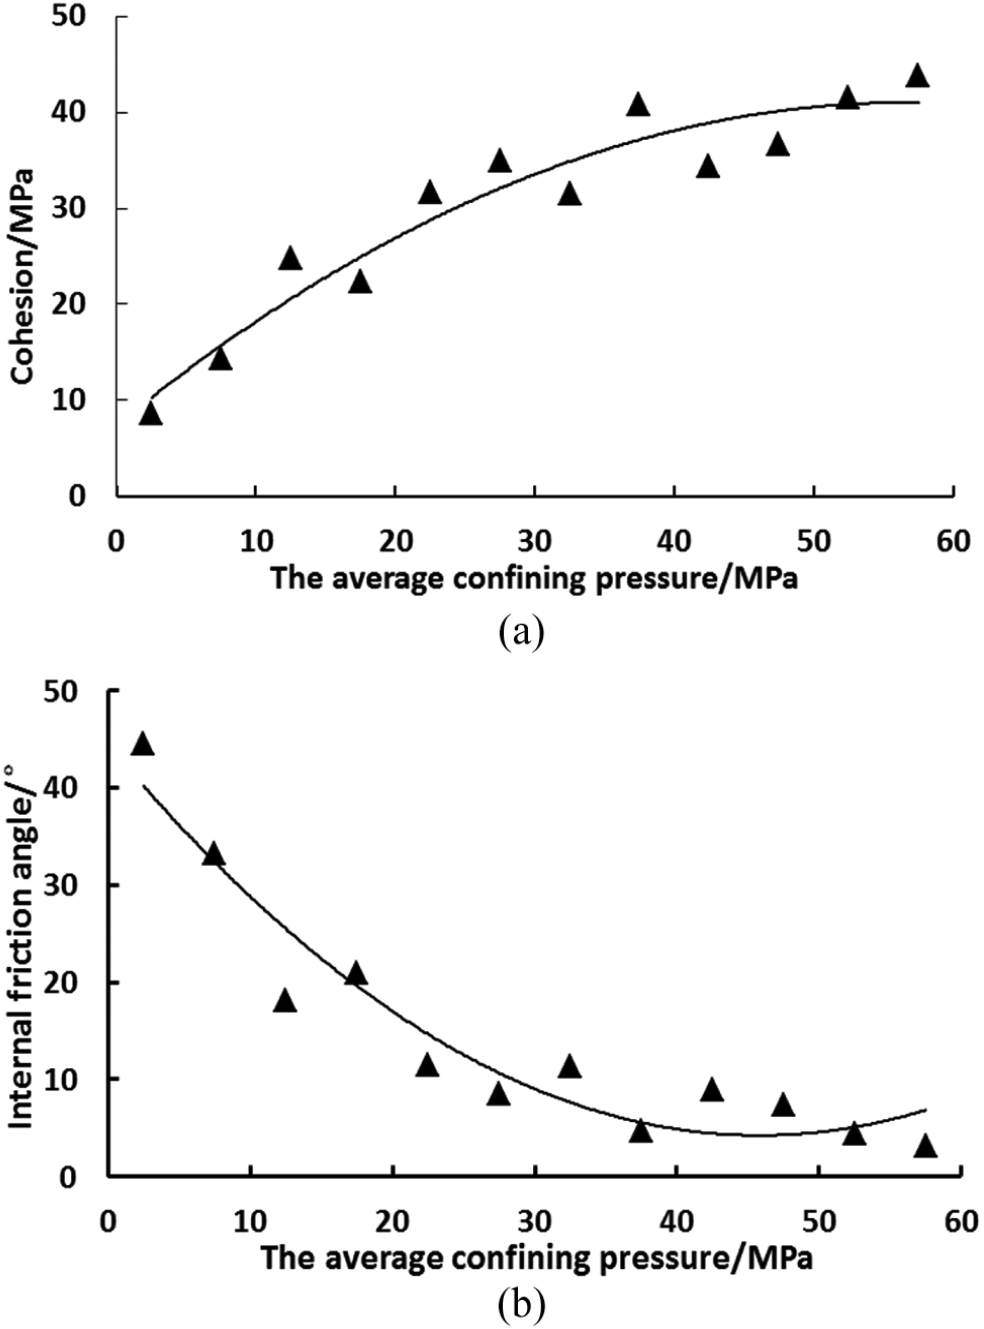
The changes of cohesion and internal friction angle with the average confining pressure: (a) the change of cohesion with the average confining pressure and (b) the change of internal friction angle with the average confining pressure.
Regression of the relationship between C and φ and σ3 into a straight line or a quadratic curve is shown in the following formulas

These equations give the variation of cohesion force C and internal friction angle φ with confining pressure. The triaxial experimental data of tight sandstone in the XuJiahe formation were substituted into formula (7), and the following corresponding mathematical expressions were obtained

It can be seen from formula (8) that the envelope obtained is not the fitting of a single function but rather a continuous connection of two circular tangents, so it is called the continuous tangent envelope.
Model
Formation collapse pressure determined by continuous tangent envelope method
As shown in Figure 7, a plane is selected at the vertical position of the borehole axis, and it is bisected into 100 × 100 equal parts, so the length of each equal part can be expressed as

Borehole wall surrounding rock plane.

Azimuth model around well.
When

Where σr is the radial stress component (in MPa); σθ is the circumferential stress component (in MPa), σz is the axial stress component (in MPa);
The calculation of formation collapse pressure by using the continuous tangent envelope is also based on the Mohr–Coulomb strength criterion. However, C and φ are not constant in the Mohr–Coulomb criterion but vary with confining pressure σ3 (or equivalent drilling fluid column pressure). In the case of all given drilling parameters, confining pressure σ3 was determined by drilling fluid density and well depth, and C and φ corresponding to this density were obtained on curves C = C(σ3) and φ = φ(σ3). Then, the wellbore stability calculation program was run, and the stress distribution and failure area distribution were obtained by MathCAD software to judge wellbore stability.
In the establishment of the stress field model around the well, it is necessary to calculate the effective stress acting on the rock skeleton, so the pore pressure is included in the wellbore stability analysis, and the Mohr–Coulomb criteria are as follows 25

When the left side of equation (10) is <0, the shaft wall remains stable, whereas the wellbore wall is unstable. The calculation parameters were substituted into MathCAD and the left part of equation (10) of the above mathematical model was used to analyze wellbore stability.
To obtain the distribution characteristics of rock stress states around the well, a typical horizontal well is calculated by taking the tight sandstone of the XuJiahe formation as an example. The parameters of the well are listed in Table 5. In this table, σH is the maximum horizontal principal stress (in MPa), σh is the minimum horizontal principal stress (in MPa), σv is the vertical stress (in MPa), Pp is the pore pressure (in MPa), ψ is the deviation angle (in degrees),
The formation parameters of a well in the XuJiahe formation.

By substituting the data (well depth H = 2000 m and drilling fluid density ρ = 0.8 g/cm3) into formula the σ3 = ρgh, σ3 = 15.68 MPa can be obtained, which can be substituted into the continuous tangent envelope formula (8) to obtain the cohesion C = 27.61 MPa and internal friction angle φ = 23.28°. The collapse pressure prediction of the well at different deviation angles was made by using the MathCAD program, as shown in Figure 9.
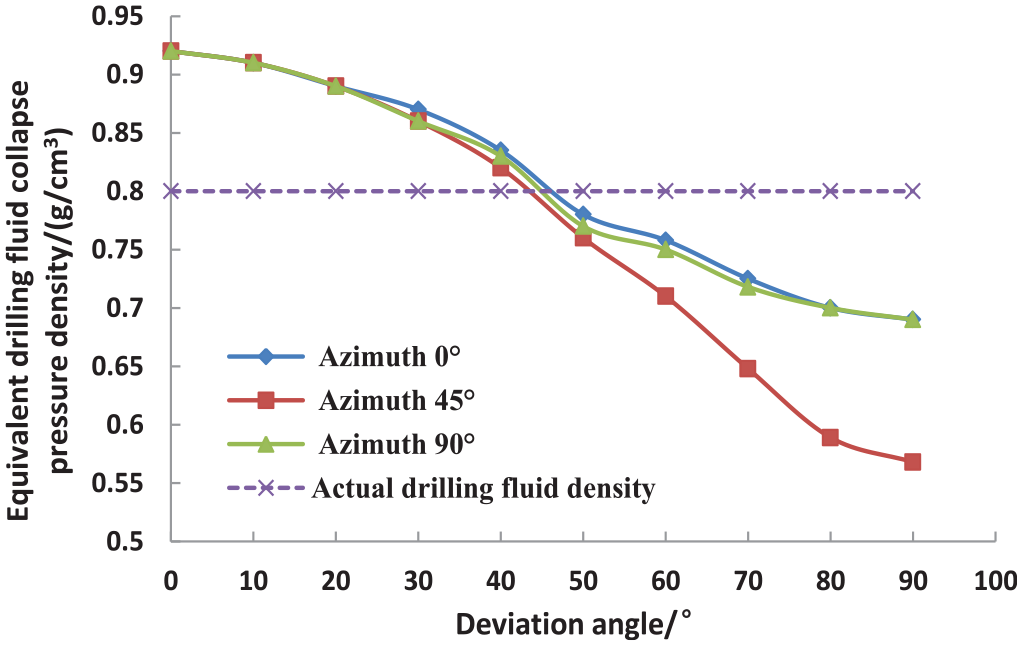
Collapse pressure prediction.
It can be seen from Figure 9 that the general trend of this formation condition is that the equivalent drilling fluid density decreases with the increase of well inclination angle. In this formation, the critical value of the well inclination angle is ∼45°. When the well inclination angle is <45°, the equivalent drilling fluid density is higher than the actual drilling fluid density. When the well inclination angle is >45°, the equivalent drilling fluid density is lower than the actual drilling fluid density. The actual drilling fluid density of this well is 0.8 g/cm3, and the inclination angle and azimuth angle of the well are both 90°. At this time, the predicted equivalent drilling fluid density value was 0.69 g/cm3, indicating that the well would not collapse and become unstable. This indicates that a horizontal well is more conducive to maintaining borehole wall stability than a vertical well in this formation condition.
The cohesion C = 27.61 MPa and internal friction angle φ = 23.28° obtained based on the continuous tangent envelope and the cohesion C = 8.23 MPa and internal friction angle φ = 46.71° obtained from the linear envelope based on the uniaxial rock mechanics test were, respectively, put into MathCAD to analyze wellbore stability. The results are shown in Figure 10.
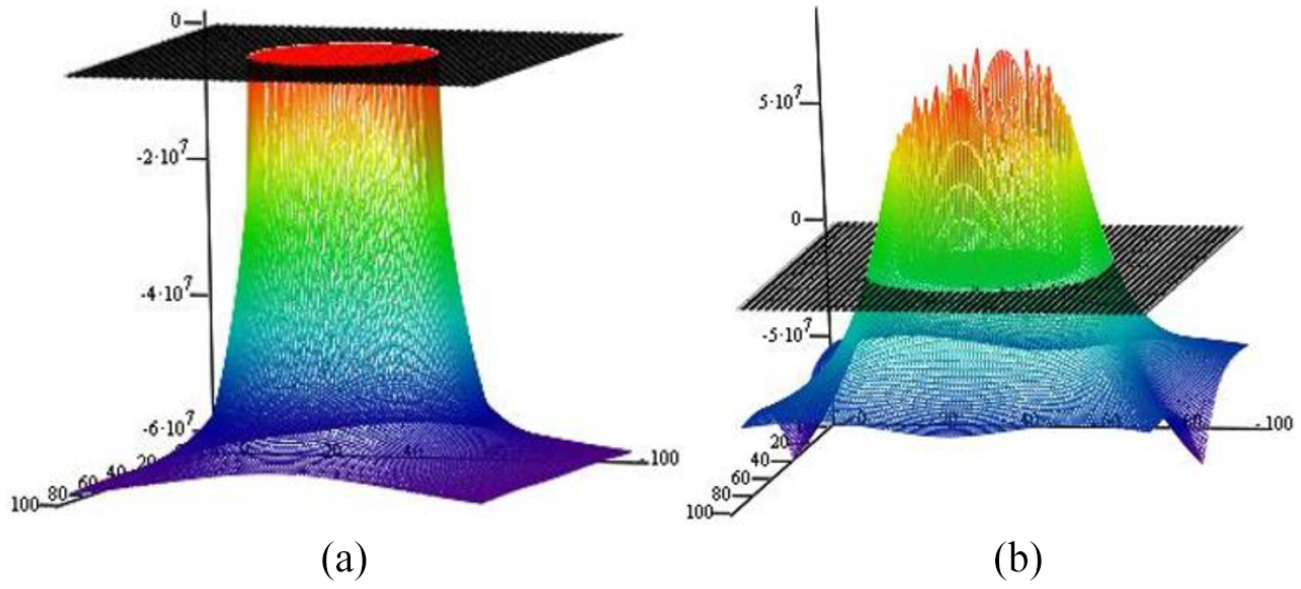
Wellbore stability judgment diagram: (a) envelope of continuous tangent and (b) linear envelope.
Figure 10(a) was constructed using the rock mechanics parameters obtained by means of the continuous tangent envelope method and substituting these into equation (10); the figure obtained was located below the zero interface, indicating that shear failure did not occur in this formation and that the borehole wall remained stable. The figure obtained by substituting the rock mechanics parameters obtained by the uniaxial rock mechanics experiment into equation (10) has partially exceeded the zero interface, as shown in Figure 10(b), indicating that shear failure and borehole wall instability have occurred in this formation. These results demonstrate that the continuous tangent envelope method can obtain real rock mechanical parameters more accurately and improve the accuracy of collapse pressure so as to maintain the stability of the borehole wall.
The influence of different stress circle envelope on the critical stable density
The cohesion and internal friction angle were obtained by using the linear envelope (equation (2)), parabolic envelope (equation (5)), and continuous tangent envelope (equation (8)) of the tight sandstone of the XuJiahe formation, respectively. Values of σ3 were substituted into the critical density calculation formula to calculate the critical density. The formula for calculating the critical equivalent drilling fluid density 25 is as follows
Where σH is the maximum horizontal principal stress (in MPa), σh is the minimum horizontal principal stress (in MPa), C is the cohesion (in MPa), φ is the internal friction angle (in degrees), Pp is the pore pressure (in MPa), H is the well depth (in meters), η is the nonlinear correction coefficient of stress (dimensionless), and α is the Biot coefficient (dimensionless).
According to the triaxial test data of the XuJiahe sandstone formation in this study, the functional relationship between cohesion C and internal friction angle φ with confining pressure σ3 was obtained; this was substituted into the calculation formula (11) of critical density, and the critical density calculation formula for the continuous tangent envelope was obtained as follows
Let us consider a specific well in the XuJiahe formation as an example, the basic parameters of the well are given in Table 6. In this table, σH is the maximum horizontal principal stress (in MPa), σh is the minimum horizontal principal stress (in MPa), ρ is the drilling fluid density (in g/cm3), H is the well depth (in meters), α is the effective stress coefficient (dimensionless), and η is the nonlinear correction coefficient of stress (dimensionless).
The formation parameters of a well in the XuJiahe formation.
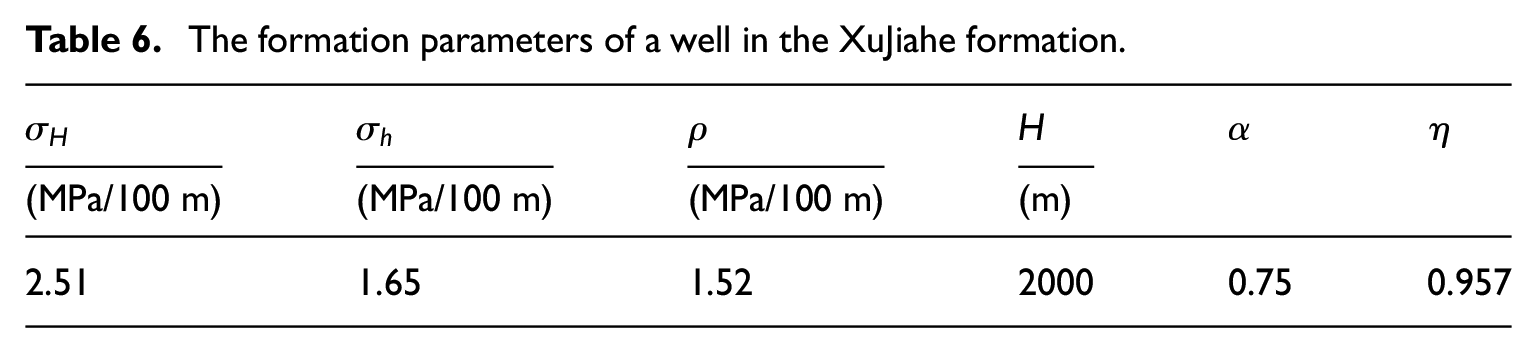
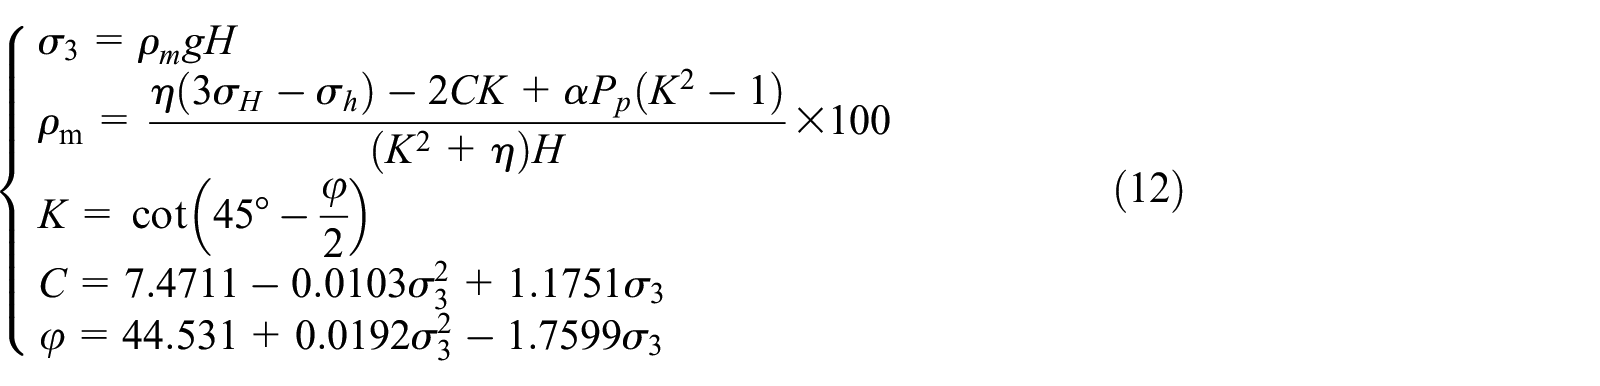
The critical density algorithm for the continuous tangent envelope is as follows: If the confining pressure is equal to the liquid column pressure, the confining pressure is proportional to the density. By using the MathCAD program, the data in Table 6 were substituted into equation (12), and the critical density obtained by the iterative algorithm was 1.01 g/cm3. The critical densities obtained for the linear envelope and parabolic envelope (Fairhurst criterion) were obtained by using the critical density formula (11), and the results were 1.32 and 1.21 g/cm3, respectively. It is not difficult to see that the critical density obtained by using the continuous tangent envelope is the minimum. Therefore, the critical collapse density calculated by using the continuous tangent envelope method under the same conditions is significantly lower than that calculated by using traditional methods, which is beneficial to increase drilling speed under the condition of maintaining wellbore stability.
Conclusion
In this study, the tight sandstone of the XuJiahe formation is taken as an example to conduct a series of rock mechanics experiments. By making a common tangent to two adjacent circles, the mathematical expression for the continuous tangent envelope based on the triaxial experimental results is obtained, and a new collapse pressure calculation method is proposed. The main conclusions are as follows:
Based on uniaxial rock mechanics test data, a function expression for the parabolic criterion (Fairhurst criterion) was determined, and the σ1–σ3 curve of the Fairhurst criterion and the triaxial confining pressure test results of the XuJiahe formation sandstone were compared and analyzed. The results show that the degree of coincidence is not high, especially in high-confining-pressure region. This is because the triaxial rock mechanics test confining pressure is relatively low, whereas that in the field of oil and gas well engineering is relatively high.
Based on the triaxial test data of large scale and high density, a mathematical expression for the continuous tangent envelope of a nonlinear Mohr circle envelope based on a series of triaxial tests was determined, and the variation of cohesion force and internal friction angle with confining pressure was clarified.
Based on the rock mechanics parameters obtained by the two methods of continuous tangent envelope and linear envelope and the mathematical model established, the stress distribution was obtained by using the MathCAD program, and the wellbore stability judgment results were compared and analyzed. The results show that the rock mechanics parameters determined by the continuous tangent envelope can reflect the formation situation more truly and obtain the formation collapse pressure more accurately, thereby ensuring wellbore stability.
The critical stable density of a well in the XuJiahe formation was calculated by using linear, parabolic, and continuous tangent envelopes, respectively. The comparative analysis shows that the method using the continuous tangent envelope has some advantages in determining the critical density.
Because of experimental conditions and time constraints, it was not possible to analyze common rocks one by one, so conducting research on different lithologies is suggested. Given that the variation of drilling fluid density in actual drilling operations can be divided into three zones according to different drilling techniques, it is suggested to divide the confining pressure variation range into three zones: a low-pressure zone, an equilibrium zone, and a weighting zone. Moreover, test points should be encrypted in three blocks, with relatively few test points in other areas, to improve experimental quality and accuracy.
Footnotes
Declaration of conflicting interests
The author(s) declared no potential conflicts of interest with respect to the research, authorship, and/or publication of this article.
Funding
The author(s) disclosed receipt of the following financial support for the research, authorship, and/or publication of this article: The authors are grateful to the support from the Open Fund of State Key Laboratory of Oil and Gas Reservoir Geology and Exploitation (Southwest Petroleum University) (No. PLN201812), and supported by 111 Project (No. D18016).