
Abstract
Conventional microbiological water monitoring uses culture-dependent techniques to screen indicator microbial species such as Escherichia coli and fecal coliforms. With high-throughput, second-generation sequencing technologies becoming less expensive, water quality monitoring programs can now leverage the massively parallel nature of second-generation sequencing technologies for batch sample processing to simultaneously obtain compositional and functional information of culturable and as yet uncultured microbial organisms. This review provides an introduction to the technical capabilities and considerations necessary for the use of second-generation sequencing technologies, specifically 16S rDNA amplicon and whole-metagenome sequencing, to investigate the composition and functional potential of microbiomes found in water and wastewater systems.
Keywords
Introduction
Routine water and wastewater testing is critical for many public health and industrial monitoring programs. While traditional tests for microbiological contamination, such as fecal coliform counts, provide indirect abundance measurements of culturable microbes, the advent of inexpensive new DNA sequencing technologies offers the potential to dramatically increase the scope of monitoring through direct and comprehensive identification. For environmental surveillance, DNA sequencing can be used to detect microbes (bacteria and archaea) that are not currently routinely tested for, including difficult-to-culture organisms such as Clostridium spp. 1 and Methanobrevibacter spp. 2 This information can be used for microbial source tracking to identify point sources of contamination 3 and evaluate the effectiveness of remedial and control measures. Many industrial waste treatment processes including those applied to wastewater depend on complex microbial fermentation. 4 High-throughput DNA sequencing can be used to monitor the efficacy of such processes, provide ancillary information to optimize wastewater treatment technology (particularly those that have a proprietary component) and provide biological information regarding process failure. 5
The challenges in employing DNA sequencing technology for characterizing microbial communities are manifold and include the development of robust sampling methodologies and the application of informative statistical analyses. Furthermore, between sampling and statistics lies the daunting task of selecting the correct sequencing technologies to accomplish water and wastewater monitoring goals. The plethora of options available for sequence data processing can be overwhelming for those unfamiliar with bioinformatics. In this review, we discuss accepted practices in implementing DNA sequencing technologies and describe the bioinformatic tools available for sequence data processing. We also outline the benefits of DNA sequencing technologies over culture-based microbiological methods in water and wastewater quality monitoring and provide recommendations for designing monitoring programs.
Culture-based microbiological methods in water and wastewater analysis
In North America, public health authorities use plate culturing methods to assess water microbial quality.6,7 In these methods, standardized volumes of water are initially passed through 0.45 μm filters. Filters are then placed on selective agar media that facilitate exclusive growth of the bacteria of interest. The degree of microbial contamination is quantified in colony-forming units (CFUs) per unit volume by counting the number of colonies on a plate. 8 Routine testing comprises quantification of Escherichia coli and total coliforms. Unfortunately, waterborne illnesses are caused by a multitude of bacterial genera including the following: Shigella, Leptospira, Legionella, Vibrio, Salmonella, Campylobacter, and Arcobacter. 9 Genera-specific plate culturing methods exist for many pathogens. However, these methods require specialized facilities and expertise.7,8 Culture-based tests can only detect the presence a few microbial groups at a time with limited taxonomic resolution. Standard water quality monitoring methods that simultaneously test for all microbial pathogens would greatly benefit water quality monitoring in the interest of public health.
Methods to simultaneously characterize all microbes in a system could similarly benefit wastewater treatment system design and monitoring. In wastewater treatment, organic waste is metabolized into gases such as methane and hydrogen in a process called anaerobic digestion (AD; Figure 1). 4 AD is sustained by a diverse, core population of microbes which syntrophically metabolize complex molecules. In syntrophic metabolism, metabolites of certain taxa become the substrate for others (Figure 1).10,11 Therefore, the species present in wastewater treatment systems are directly responsible for desired treatment outcomes.12,13 Characterization of microbial community composition and metabolic capacity can facilitate the improvement of wastewater treatment systems through bioaugmentation or system modifications that promote the growth of effective waste-degrading microbes.14,15 Culture-based assays have been used to test the metabolic activity of microbes in the effluent of onsite wastewater treatment system (OWTS). 16 However, like plate-culture water quality assays, these fail to fully characterize wastewater treatment systems as many relevant microbes are difficult to culture. This has given rise to a quest for culture-independent methods through second-generation sequencing (SGS).
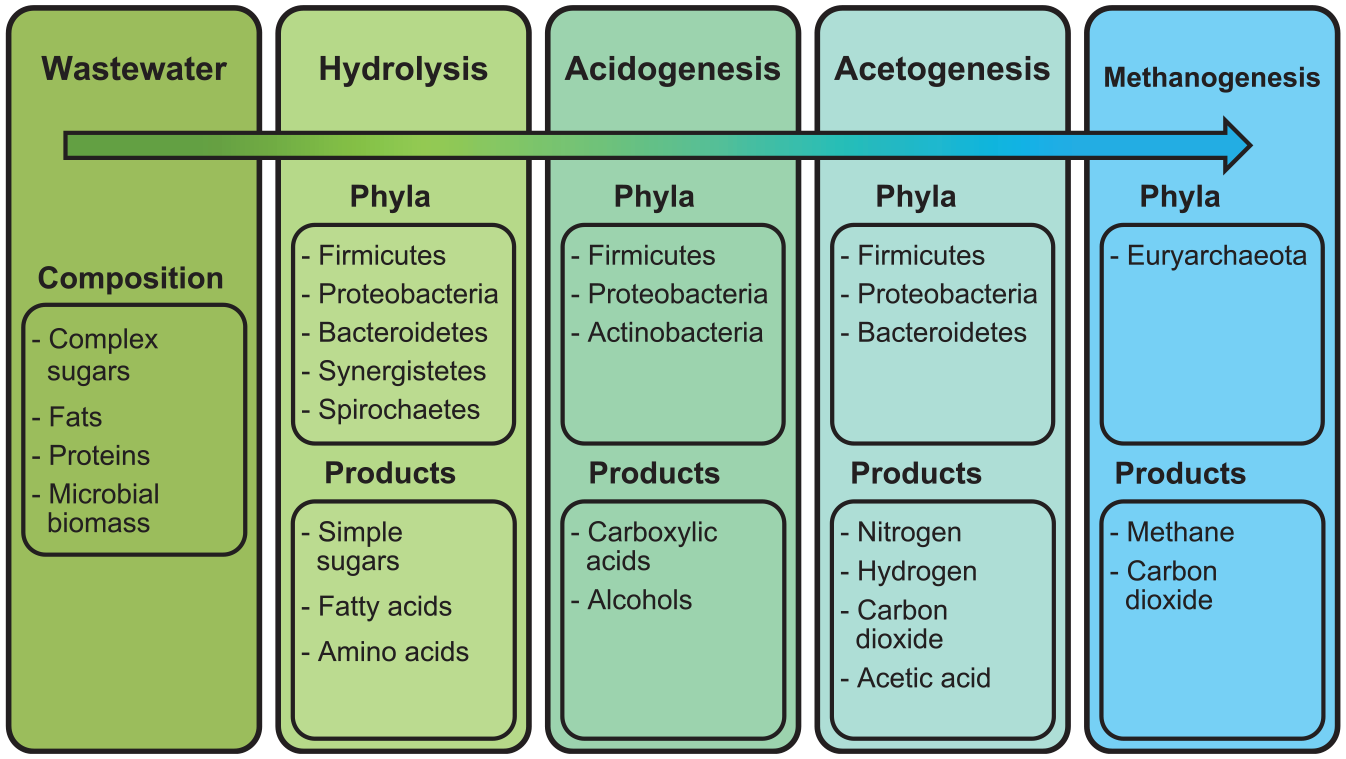
Microbial phyla responsible for anaerobic wastewater treatment processes—hydrolysis, acidogenesis, acetogenesis, and methanogenesis.
SGS
SGS technologies are characterized by the sequencing of millions of short (<1000 bp) DNA fragments which are attributed to their sample of origin by appended index sequences. 17 Sequence information from each DNA fragment, or reads, are assigned taxonomy through alignment with sequences in microbial genome databases. 18 Therefore, SGS offers massively parallel methods for simultaneous and comprehensive identification of microbes in complex communities across several samples using DNA sequencing. 19 By removing the need for culturing, SGS allows for the identification of unculturable taxa that may play key roles in pathogenicity or wastewater treatment.4,20 Furthermore, the relative abundance of microbes in a sample can be quantified using the number of reads assigned to each taxonomic group.21,22 In addition to taxonomic assignment, reads can be aligned to gene databases to elucidate the functional gene pathways or utilized in de novo methods to construct genomes of novel microbial species.23,24
Illumina sequencing platforms have been widely adopted as the sequence platforms of choice 25 for SGS due to lower per-base costs and error rates and greater data output in comparison with other platforms. 26 Illumina utilizes sequencing by synthesis (SBS) technology in which DNA fragments are bound to a solid-phase flow cell, amplified and sequenced using fluorescently labeled nucleotides. 27 The maximum read length of any Illumina SGS platform is currently 300 bp. 28 Molecules can be sequenced from one end (single-end reads) or from both ends toward the middle (paired-end reads). 28 Paired-end reads can potentially be merged to create a longer contiguous sequence if there is overlap between the reads. 28 Many studies have also employed pyrosequencing,29–31 a discontinued sequencing technology pioneered by 454 Life Sciences. Although this technology is no longer being advanced, studies employing pyrosequencing remain a valuable source of information as pyrosequencing results have been shown to be comparable to those obtained with SBS. 32
The next frontier in DNA sequencing is long-read sequencing, also known as third-generation sequencing (TGS). TGS platforms can sequence hundreds of kilobases of a single DNA molecule. 33 Long reads have many applications including high-resolution taxonomic assignment, characterization of genome regions with repetitive sequences, and identification of epigenetic markers. 34 Unfortunately, TGS currently has relatively greater sequencing costs, 35 higher error rates, and lower sample throughput compared to SGS. 36 These shortcomings make TGS a poor alternative to SGS for metagenomic sequencing 37 of complex microbial communities at this time.
Most published SGS microbiome studies utilize variants of Illumina’s MiSeq and HiSeq platforms. The maximum output of the most recent MiSeq and HiSeq models are 2.5 × 10⁷ and 5×10⁹ reads, respectively. 28 Illumina also recently released the NovaSeq platform which has a maximum output of 2 × 10¹⁰ reads. 28 Illumina platform purchasing and service costs increase with data generation capacity. 28 For example, excluding library preparation and quality control costs, a paired-end, 150 bp read-length (2 × 150 bp) sequencing run on one flow cell lane can cost approximately US$1500 (2019 prices) on a MiSeq platform. 38 In contrast, for the benefit of more reads, the same run costs approximately US$3000 on the HiSeq38,39 and US$9000 on the NovaSeq.39,40 Platform choice is informed by study design and number of required reads per sample, also referred to as sequencing depth. To maintain sequencing depth, the total number of reads required increases with the number of samples to be analyzed. Sequencing depth requirements are dependent on the project goals and SGS technique. Currently, the two primary SGS techniques for the determination of microbial community composition and function are 16S ribosomal DNA (16S rDNA) sequencing and whole-metagenome sequencing (WMS), respectively.
Although government and industry have recently begun to explore the use of SGS for biomonitoring of aquatic environments,6,41 high-throughput sequencing has yet to be widely adopted for monitoring of water and wastewater treatment systems. The primary barriers to wide-scale adoption of SGS are cost and expertise. 42 Culture-based methods, though limited in scope, require considerably less resources, training, and time. However, decreasing sequencing costs, 43 curation of bioinformatic protocols,44,45 and development of user-friendly sequence analysis tools46,47 continue to improve the feasibility of SGS for routine monitoring. The following sections provide recommendations and guidelines for the application of 16S rDNA and WMS analysis in water and wastewater analysis.
16S rDNA sequencing applications in wastewater treatment and water quality monitoring
16S rDNA amplicon sequencing is the de facto molecular method for microbial identification in complex environmental samples. 48 In a recent study, 16S rDNA sequencing was used to characterize and contrast microbial communities of anaerobic digesters in biogas plants (BPs) and sewage treatment plants (STPs). 49 Microbial diversity was greater in STPs than in BPs, while BP core community members were more metabolically linked than those of STPs. Differences in microbial interactions and community members between the two plant types were attributed to the greater variability in STP influent composition. 49 The simultaneous digestion of sewage and agricultural waste has been suggested as a process to increase biogas production and cost efficiency. 49 However, the results of this study indicate that the communities that degrade each substrate type are distinct and that co-digestion may not be optimal.
El-Chakhtoura et al. 50 employed SGS to assess the stability of microbial community structure from water treatment plant to a distribution endpoint. Plant and endpoint communities were significantly different which indicated that microbial populations underwent substantial changes within the water distribution network. 50 Specifically, the abundance of rare taxa (e.g. Nitrospirae, Acidobacteria, and Gemmatimonadetes) was greater at the endpoint in than at the water treatment plant. 50 Although the observed microbial community changes did not constitute a public health risk, 50 these 16S rDNA sequencing results support the need for water quality assessments throughout distribution networks.
16S rDNA sequencing principles
16S rDNA encodes for the ubiquitous and highly conserved 16S RNA subunit of bacterial and archaeal ribosomes. 51 Bacterial and archaeal phylogeny is based on levels of similarity between full-length (~1540 bp) 16S rDNA sequences. 52 Within 16S rDNA, there are nine (V1–V9) hypervariable regions (HVRs, Figure 2). Gene fragments with relatively diverse nucleotide compositions are used to distinguish microbial taxa. 53 HVRs are flanked by conserved sequences that allow them to be targeted and amplified through polymerase chain reaction (PCR) using universal primers that capture a broad range of taxa. 54 PCR amplification isolates 16S rDNA from complex mixtures of DNA by increasing their concentration. In addition, PCR can be used to attach adapter sequences that facilitate binding to sequencing machines and index sequences that identify the sample of origin for each amplicon. By convention, 16S rDNA primers are named according to their corresponding nucleotide positions (NP) in E. coli 16S rDNA 54 and their replication direction with respect to the 5′ to 3′ direction of the sense strand denoted by “f” and “r” for forward and reverse, respectively. For example, 341f/785r is a primer pair that spans the V3–V4 regions 55 (Figure 2).
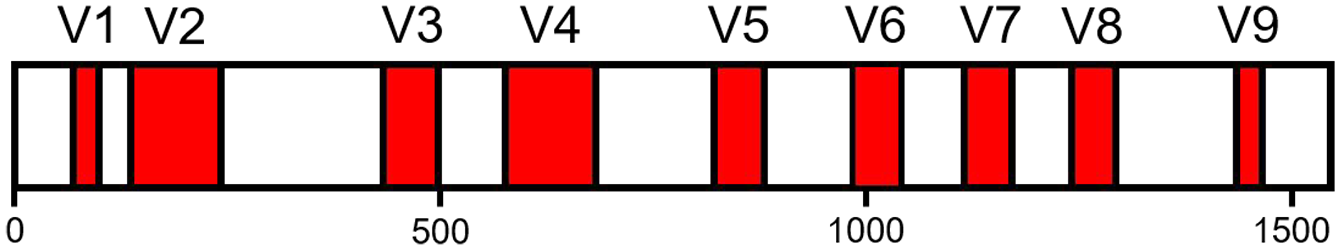
Distribution of V1–V9 hypervariable regions (HVRs) along a linear representation of the Escherichia coli 16S rDNA sense strand.
Taxonomic profiles consisting of the bacterial and archaeal taxa within a sample and their relative abundances are constructed from the analysis of HVRs. Microbial groups are identified based on HVR composition, and the number of reads attributed to each group is used to calculate the relative abundance of those organisms in a sample. HVR-based taxonomic assignment is reliable down to the genus level. 56 However, taxonomic assignment accuracy substantially decreases at the species level. 56 Species assignment is only recommended for HVR sequences that match exactly with reference database sequences. 57 The presence of species of interest can also be confirmed with species-specific PCR as a follow-up to 16S rDNA sequencing. Conserved gene markers such as conserved signature protein and indel sequences provide effective PCR targets for species-level microbial detection. 58
SGS platforms are currently unable to sequence the entire length of 16S rDNA in a single read. As a result, researchers must amplify and analyze segments of the 16S rRNA gene 48 that may include up to three HVRs. Furthermore, microbial community profiles can significantly differ depending on the HVR(s) sequenced 59 because the taxa present may be difficult to resolve due to a lack of nucleotide differences in the chosen HVRs. Therefore, the choice of HVR(s) can have significant impacts on sequencing results and may lead to erroneous conclusions regarding the systems being studied.
HVR and primer choice
Unfortunately, there is a lack of consensus as to which HVRs are the most reliable for taxonomic profiling. 60 Ideally, studies should employ 16S rDNA regions that capture the greatest degree of diversity and obtain accurate estimates of relative abundance of individual taxonomic group members. In silico comparisons of taxonomic assignment with 16S rDNA regions and full-length 16S rDNA sequences found that the V1–V3 (NP 27–519) and V1–V4 (NP 63–685) regions produced the most similar bacterial species assignments and richness estimates. 52 Tremblay et al. 61 found that, in vitro, a primer pair (515f/806r) targeting the V4 HVR yielded results that were in better agreement with WMS results than V6–V8 (926f/1392r) and V7–V8 (1114f/1392r) pairs.
In addition to the HVR regions targeted, primers can differ based on sequence composition. 16S rDNA sequencing results obtained with different primers targeting the same HVR can significantly differ due to primer bias; greater primer binding affinity for sequences that have fewer base mismatches. Allowing for one primer mismatch greatly increases primer taxonomic coverage in silico. 62 However, experimental primer testing has shown that even a single primer mismatch can significantly bias results. 63 Substituting primer mismatches with degenerate bases significantly reduces primer bias. 63
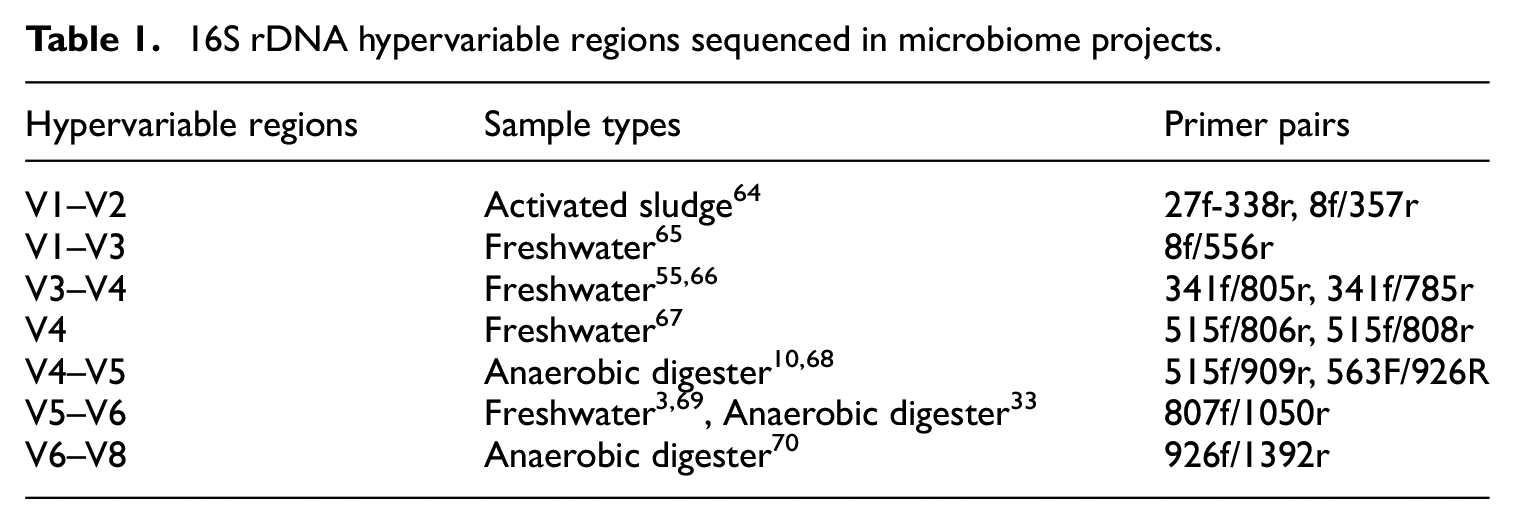
Despite the lack of consensus regarding HVR and primer choice for microbial taxonomic profiling, researchers can make informed decisions based on in silico and empirical testing of primer pairs. Consistency should be prioritized in ongoing microbiome studies to increase the likelihood that observed community differences are a result of system environment and biological activity opposed to changes in the HVRs targeted.60,61 Table 1 shows the examples of HVRs used in literature studies of water and wastewater systems.
16S rDNA hypervariable regions sequenced in microbiome projects.
16S rDNA sequence data processing methods
16S rDNA amplicon sequence data are outputted in text format with quality scores which indicate the probability of error for each base call. 71 Reads are grouped into files according to their sample of origin based on index sequences in a process called demultiplexing. Before taxonomic assignment, sample sequence reads are trimmed to remove adapter sequences and low-quality bases to prevent spurious taxonomic assignment. Adapter-trimming programs include Cutadapt 72 and Trimmomatic. 73 Examples of quality-filtering programs are Sickle 74 and BBDuk. 75 Paired-end reads can be merged if they meet a threshold for sequence overlap using programs such as PANDAseq 76 and BBMerge. 75 In addition, reads should be processed to identify and remove chimeric sequences that can be mistakenly attributed to unique taxa. 77 Available 16S rDNA chimera removal programs include ChimeraSlayer and UCHIME. 78 Sequences are then taxonomically classified using tools such as RDP Classifier, UCLUST, VSEARCH, and BLAST 56 which align sample sequences with those found in 16S rDNA reference databases. The primary reference databases used in 16S rDNA microbiome studies are Greengenes, RDP, SILVA, and NCBI. 79
A common method for grouping sequences for taxonomic classification is to cluster them into operational taxonomic units (OTUs) at a level of 97% similarity. 80 Read counts for each sequence in a group are summed and attributed to an OTU. Taxonomy is assigned to these OTUs by aligning sequences representative of each OTU with those found in reference databases. 71 Whelan and Surette 81 compared multiple clustering programs and found that some algorithms produced substantially erroneous results when characterizing human-sourced mock microbial communities. Most notably, for certain mock communities, DNACLUST overestimated diversity by nearly 4000% and UPARSE underestimated diversity by greater than 300%. 81 Although no single program outperformed all others for every mock community, AbundantOTU+ coupled with RDP Classifier and the Greengenes 2011 database provided the best overall performance. 81
Errors associated with clustering algorithms can be circumvented with DADA2, an alternative amplicon processing program that uses Illumina error-modeling to resolve sequence reads. 44 Rather than OTUs, DADA2 produces assigned sequence variants (ASVs). Whereas OTUs may change with the sequences included in an analysis, 82 ASVs are characterized on a sequence-to-sequence basis using sequencing error profiles and are thus more stable. 83 Therefore, between-study comparisons of ASVs are more robust than those of OTUs because they are less dependent on study-specific data processing parameters. In a benchmarking study, DADA2 outperformed established OTU sequence clustering programs when characterizing mock, mouse fecal and human vaginal communities. DADA2 was able to identify sequence variants and had lower output residual error rates, fewer false positives, and more correct taxonomic assignments than UPARSE, MED, UCLUST, and Mothur. 44 ASV stability and greater taxonomic assignment accuracy make DADA2 a strong candidate for the sequence processing program of choice for future 16S rDNA microbiome studies.
Determining the optimal set of bioinformatics programs for all SGS applications is beyond the scope of this review. Prospective microbiome researchers are encouraged to compare the benefits and shortcomings of the programs available. A useful starting point for software selection is the suite of default programs utilized by the 16S rDNA data analysis platform, QIIME2 (quantitative insights into microbial ecology “2”). 46 QIIME2 provides a framework in which to trim, quality-filter, resolve, and annotate 16S rDNA sequences and is the successor to the extensively utilized bioinformatics platform, QIIME. 84 In addition, protocols established by microbiome sequencing consortia, such as the Human Microbiome Project 85 and the Earth Microbiome Project, 86 can be valuable resources for designing a 16S rDNA sequence processing pipeline.
16S rDNA sequencing depth
Sequencing depth can differ by several orders of magnitude between samples because of poor mixing or improper DNA input standardization prior to sequencing. The number of taxa, particularly rare species, detected increases with sequencing depth. 86 This complicates community analyses because variation in read counts can lead to significantly different estimates of diversity between samples 87 that may be the result of differences in sequencing depth rather than biology. 88
For 16S rDNA studies, a common practice to account for sequencing depth differences is to rarefy sample counts 88 by randomly removing sequence reads without replacement until all samples reach a chosen sequencing depth. 89 Sequencing depths should be chosen to balance the number of samples kept with the level of diversity captured. Examples of sequencing depth utilized in water and wastewater studies is shown in Table 2. In some cases, it is advisable to discard samples with lower read counts because these samples may contain higher proportions of contaminating sequences from DNA extraction kits, PCR reagents, and the lab environment. 90 However, lower read counts may be unavoidable in drinking water samples with low biomass. Measures to mitigate the contribution of contamination to sample reads include processing blank samples to identify contaminating sequences for in silico removal and concentration of sample biomass prior to DNA extraction. 90
Second-generation sequencing study designs for water and wastewater monitoring projects.
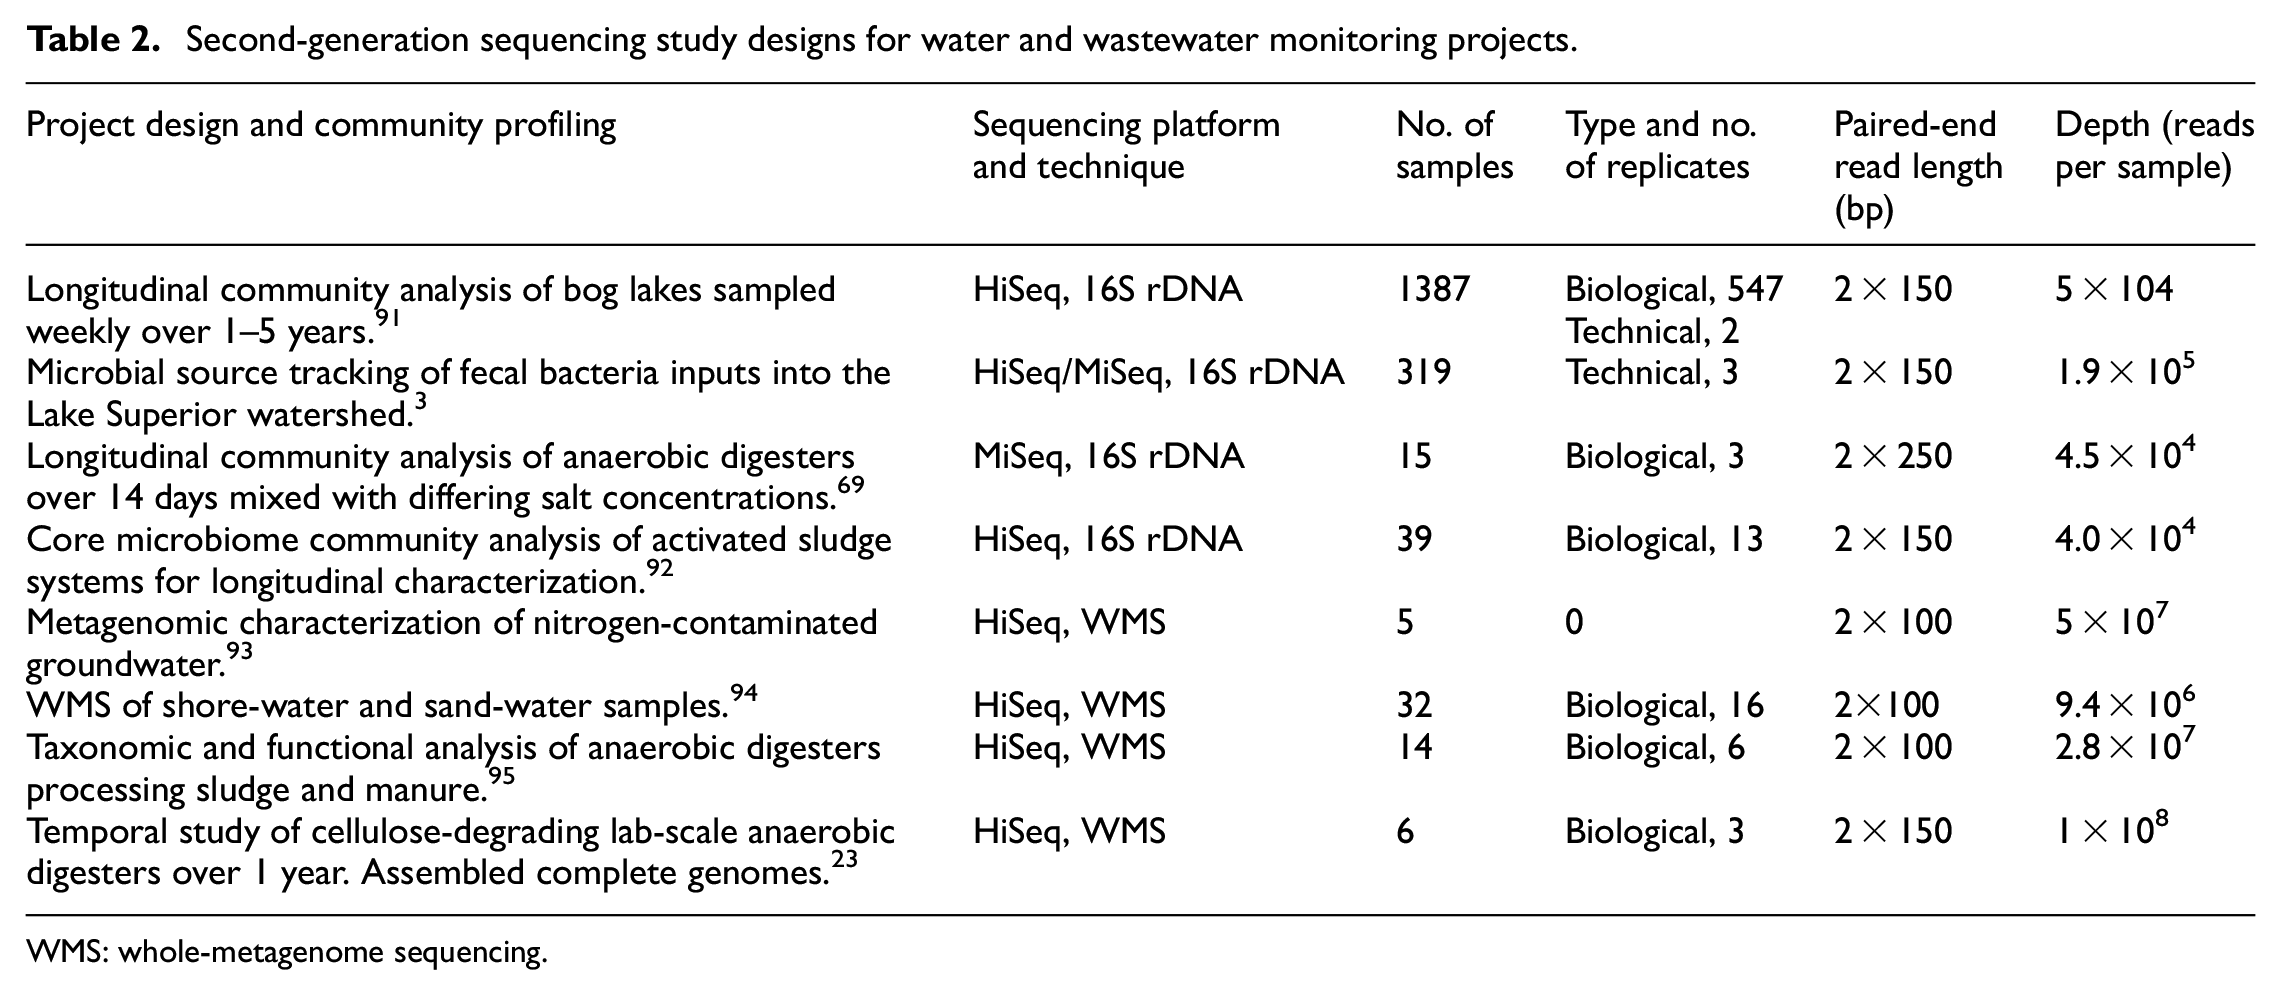
WMS: whole-metagenome sequencing.
An alternative method to rarefying read counts for the normalization of sequencing depth is to apply a variance stabilizing transformation (VST) to count data. 87 Generally, rarefied sample communities have been reported to cluster more accurately according to sample origin, while VST has been reported to have more statistical power when differentiating sample groups.88,87 Proponents of VST argue that rarefying data discards statistically relevant data, whereas practitioners of rarefying argue that VST fails to address library size effects and leads to higher false discovery rates.88,87
WMS applications in wastewater and water monitoring
An alternative to SGS analysis with 16S rDNA amplicon sequencing for taxonomic profiling is WMS. In contrast with single-gene sequencing techniques such as 16S rDNA, WMS is the analysis of all DNA sequences from a population of micro-organisms in a given environment. WMS sequences are obtained from randomly fragmented genomes within a sample and are therefore not limited to taxonomic marker genes. This technique does not require primers and thus avoids issues with primer bias. WMS profiles have been shown to more accurately reflect expected community compositions. 96 Furthermore, diversity estimates obtained with WMS are often comparable or even greater than those obtained with 16S rDNA sequencing due to greater taxonomic resolution based on multiple gene markers.97–99
The greater breadth of sequencing information obtained by WMS also allows for more applications than 16S rDNA. For example, whereas 16S rDNA analysis cannot be used to identify species not present in sequence databases, DNA sequences obtained by WMS can be used to assemble previously uncharacterized genomes. 100 In addition to taxonomic profiling, WMS can identify metabolic gene pathways in a community that may be of functional significance for a given system.4,101 Taxonomic and functional profiles of metagenomes can be compared, and chemical metadata enables insight into multiple elements of the microbiome. These include the variability of functional potentials across samples, the effect environmental parameters have on metagenome composition and functional potential, and the presence of microbial communities and genes (i.e. biomarkers) characteristic to the study environment.4,102 Profiling metabolic functions in environmental microbiomes is important as microbial communities drive biogeochemical processes. 103 However, these additional applications require greater sequencing depths than those typically analyzed by required for 16S rDNA amplicon sequencing and thus incur greater costs than 16S rDNA amplicon sequencing.67,104
WMS has been used to study community growth patterns of cyanobacterial harmful algal blooms (cHABs). 105 Global proliferation of cyanobacteria in water environments has been linked to eutrophication by phosphorous and nitrogen species from residential and agricultural sources. 106 The use of WMS to profile metabolic genes in microbial communities reveals how cyanobacterial bloom communities utilize these nutrients and adapt to changing environmental conditions.105,107 By sequencing cyanobacterial blooms over time, predictive growth models describing changes in community composition and function can be made to forecast water quality impairment due to increased nutrient loading. 108
In anaerobic digesters, fluctuations in physiochemical parameters such as pH, temperature, total solids, and organic and inorganic chemical substances can inhibit the activity of some microbes, leading to a shift in community proportions and the accumulation of metabolites at inhibitory levels.109–111 WMS analysis of anaerobic sludge digester by Li et al. 112 demonstrated a decrease in abundance of the hydrogenotrophic methanogen Methanosaeta, which produces methane from the reduction of carbon dioxide using hydrogen, and stable growth of the acetoclastic methanogen Methanosarcina, which produces methane from acetate, at elevated levels of ammonium. 112 This community shift was also reflected at the functional gene level, where gene abundances encoding for enzymes responsible for the acetoclastic pathway increased during ammonium stress. 112 As a result of ammonium stress, methane production decreased due to the inhibition of hydrogenotrophic methanogens and their genes. 112 Therefore, the ability for WMS to obtain species-level taxonomic abundances as well as gene abundances coding for enzymes and cellular mechanisms governing syntrophic interactions in the AD process is useful for evaluating the biological basis of digester performance.
Since WMS is not subjected to amplification bias, low-abundance organisms such as pathogens and viruses can be accurately detected, quantified, and sourced to determine their presence and persistence in environments. 94,113–115 Culture-based and molecular-based (PCR) assays for pathogen detection require selective media and specific primers to detect pathogens. However, such methods are limited in sensitivity and breadth of detection due to primer mismatches, inability to culture rare and novel pathogens, and simply because such analyses screen pre-selected targets.116,117 The high-throughput, sequence-independent nature of WMS enables the characterization of all offers comprehensive insight into the abundance, diversity, and composition of known and unknown pathogens in a given environment.
WMS has been used to source and quantify antibiotic resistance genes (ARGs) and virulence factors in waterbodies118,119 and wastewater processing systems.113,115 Effluent waste runoff from residential areas, pharmaceutical and agricultural industries, and wastewater treatment plants (WWTP) is discharged into lakes, resulting in the accumulation of ARG and pathogens in waterbodies.120,119 By sequencing the total DNA within a sample, WMS provides abundance estimates of ARG types, virulence genes coding for bacterial motility, cell adherence and secretion, and mobile genetic elements (MGE) such as transposons, plasmids, and bacteriophages.113,121,122 By analyzing the abundance of these genes, the potential of ARG and virulence factor propagation by horizontal gene transfer across environments can be determined.113,121 In addition, novel pathogenic species and strains can be profiled by WMS for pre-emptive treatment of outbreaks in water and wastewater environments.123–125
WMS principles
In WMS, the genomic DNA is extracted, randomly sheared into fragments, and subsequently sequenced. DNA sequencing libraries are prepared by fragmentation, size-selection, labeling, and enrichment of DNA. Library preparation protocols used with Illumina sequencers include the TruSeq DNA series of library kits and the transposon-based Nextera XT Library Kit protocols. 28 DNA is first fragmented by nebulization, sonication, or enzymatic digestion.126,25 After fragmentation, ends of DNA fragments are repaired and adapters are ligated to facilitate sample DNA binding to Illumina flow cells. 25 The fragments are then size-selected by either gel-electrophoresis or using solid-phase reversible immobilization (SPRI) beads. 127 After size-selection, DNA sequences can be enriched in concentration and purity by PCR using proprietary Illumina primers. 25 Selecting a fragmentation method depends on the type of library preparation kit used. Fragmentation by nebulization and sonication is compatible with Illumina’s TruSeq Nano and PCR-free sample preparation kits with a recommended input DNA mass of approximately 1–2 µg of DNA. 25 Alternatively, the Illumina Nextera XT library preparation kit is more cost-effective and utilizes tagmentation, a process in which DNA is fragmented and simultaneously tagged using transposase enzymes while requiring only 50 ng of input DNA. 25 However, since transposases target sequence motifs, transposome-based sequence fragmentation and tagging cause biased read coverage against sequences with higher G and C nucleotide content compared to TruSeq PCR and PCR-free library preparation methods due to the random and therefore unbiased nature of DNA fragmentation by sonication or nebulization.25,128 After optional PCR enrichment, the adapter-ligated sequences are then applied onto flow cells for sequence cluster generation and fluorescent-based nucleotide detection.
Taxonomic profiling using WMS
Before taxonomic and functional analysis, WMS reads are quality-trimmed and -filtered for adapters and low-quality base calls based on the phred scoring system. This process is similar to the filtering and trimming applied to 16S rDNA sequencing datasets with tools such as Trimmomatic 73 and BBDuk. 75 Taxonomic assignment based on whole-genomes requires different software tools than 16S rDNA sequencing. NCBI’s BLAST+ (Basic Local Alignment Search Tool) and the accelerated BLAST tool, DIAMOND, 129 align sequenced reads to translated-nucleotide protein sequences stored in NCBI’s non-redundant (nr) protein database. The aligned reads can then be binned and counted into taxonomic ranks using programs such as MEGAN6 130 and DUDes. 131 Marker-gene-based tools such as MetaPhlAn2, 132 PhyloSift, 133 and mOTU 134 in conjunction with alignment tools such as Bowtie2 135 and HMMER 136 assign sequenced reads to a database containing clade-specific marker genes from >7500 bacterial and archaeal species to estimate bacterial and archaeal relative abundances. Alternatively, programs such as Kraken 137 and CLARK 138 assign entire sequenced reads to genomes, often employing unique k-mer (sequences of user-defined length k) abundances for taxonomic classification. Read-based assignment tools generate slightly greater numbers of false positives in taxonomic assignment at greater read depths than marker-based assignment tools because reads that are initially falsely identified are further miscalled as more reads are sequenced. 139 The taxonomic false-positive rates produced using marker-based and read-based taxonomic assignment tools for WMS can be mitigated by classifying aligned reads using a lowest common ancestor (LCA) algorithm as provided by MEGAN. 130
Whole-metagenome sequence assembly
Fragmented DNA sequences produced by WMS can also be aligned and assembled into contiguous sequences to form complete genomes in metagenomic samples. Assembly-based WMS analysis aligns raw reads at areas of overlap together de novo into contiguous sequences called contigs to assemble draft genomes of microbes in metagenomic samples using tools such as metaSPAdes and Megahit.140,141 After assembly, contigs can either be binned into complete genomes for novel species discovery100,142 or be directly mapped based on sequence homology using alignment algorithms such as BLAST and profile hidden Markov models (HMMs) 136 against nucleotide sequence databases such as NCBI’s non-redundant (“nr”) protein database or MetaPhlAn’s clade-specific marker gene sequences 143 to quantify taxonomic and functional gene abundances. Metagenomic novel genome construction requires at least two sets of metagenomes from the same system that are differentiated by a treatment such as time of sampling or DNA extraction method. 100 The scaffolds are binned based on concerted changes in the frequency of k-mer sequences between treatments. 100 This binning method is called compositional-based binning, which enables the discovery of novel genomes and microbial species not by referencing known genes in existing databases, but instead by de novo assembly and binning.100,23 Longer sequences are required for greater taxonomic and functional resolution during alignment to reference genomes. 144 However, like the misalignment of short DNA fragments, erroneous chimeric contigs can be constructed from fragments that have overlapping regions, such as sequence repeats, that do not originate from the same gene or species. 145
The accuracy and quality of contig assemblies and the genomes produced varies substantially between available programs. 146 The quality of these genomes is evaluated by determining the presence of putative single-copy genes essential to the survival of microbes by tools such as CheckM.142,147 The presence of the genes without duplication indicates high-quality metagenomic assembled genomes (MAGs).142,146 Megahit and metaSPAdes are among the best performing metagenome assembly programs based on accuracy in mock community analyses, percentage of reads mapped to assemblies, computing power requirements, contig length, captured diversity, and assembly error rates.146,148–150 Both programs capture greater than 75% of the expected diversity in mock microbial communities.150,146,149 Megahit is recommended for studies where characterizing low-abundance diversity and microbial strain resolution are priorities.149,150 metaSPAdes assembles longer contigs than Megahit and performs better when reconstructing expected open reading frames (ORF) of low-abundance species in mock communities with uneven species distributions.148,149 The number of ORFs detected is indicative of the number of genes in a sample. 148 High sequencing depth for each sample is necessary to achieve complete construction and coverage of the diverse genomes present in metagenomes (Table 2).96,104,151 High sequencing depth achieves a greater diversity of species profiles by covering low-abundance genomes and genes and mitigates the effect of sequencing errors and false-positive discovery rates generated during sequence analysis.18,104 High sequencing depth is achieved by reducing the number of samples sequenced in flow cell lanes (Table 2). 152
Microbiome functional profiling
WMS also provides insight into the physiological processes and abilities of microbial communities. To obtain functional profiles of metagenomic sequences, genes are first identified as coding DNA sequences, noncoding RNA genes, or other sequence motifs such as clustered regularly interspaced short palindromic repeats (CRISPRs) in a process called gene prediction. 153 Coding DNA sequences can be identified and distinguished from noncoding RNA genes using tools such as MetaGeneMark, 154 Prodigal, 155 and Prokka 156 by detecting transcription initiation sequences or ORF. 155 Metagenomic sequences are functionally annotated based on the protein and protein families categorized into protein sequence clusters of orthologous groups (COGs) they encode using software such as MG-RAST, 157 MEGAN, 130 IMG/M, 153 HUMAnN for human microbiomes, 158 and the package for the R statistical language ShotgunFunctionalizeR. 159 These tools map reads that are homologous to protein sequences previously curated and recorded into databases such as KEGG, 160 UniProt, 161 MetaCyc, 162 and SEED. 163 The number of reads that map to functional sequences can be used to quantify the abundances of genes coding for cellular and metabolic mechanisms relative to the entire metagenome, providing insight into the potential biological functions in a metagenomic sample. 101
Determinations of microbial activity
A major limitation of 16S rDNA sequencing and WMS is that they cannot assess microbial activity because they cannot differentiate between DNA from live cells and DNA from lysed dead cells.69,164 Methods for assessing the overall microbial activity that can accompany 16S rDNA sequencing and WMS include measurement of ATP concentrations 165 and differential staining assays that target live cells. 166 Meta-transcriptomic sequencing (MTS), also referred to as RNA-seq, is an SGS method that can assess microbial activity through determination of microbial expression levels. In MTS, the complementary DNA (cDNA) of RNA transcripts is sequenced, quantified, and annotated according to function and taxonomy.69,167 RNA extraction and sequence processing methods for MTS have been reviewed elsewhere.168,169
Combining 16S rDNA and WMS approaches
WMS is a versatile tool for identifying the microbes present in water and wastewater systems, characterizing their metabolic capacity and determining their potential pathogenicity. The utility of WMS outstrips that of 16S rDNA, and researchers should consider investing in WMS if they have the resources and require a thorough understanding of microbial community structure and function. 96 However, application of 16S rDNA and WMS does not need to be mutually exclusive. 16S rDNA surveys can be used to identify unique samples for more in-depth investigation at greater sequencing depths with WMS. 152 Samples of interest are identified based on microbial community characteristics such as ecological diversity, dissimilarity between communities, or abundance of specific taxa. The combination of 16S rDNA and WMS offers a potential for greater return of investment on sequencing. The need to identify samples of interest can arise from the inherent heterogeneity of water and wastewater systems.
Heterogeneity of freshwater and wastewater systems
Microbial communities differ significantly across spatial and temporal scales in freshwater watersheds 170 and wastewater treatment systems. 69 Even within a mixed wastewater treatment system, biomass communities can differ from granule to granule. 68 Spatial heterogeneity requires researchers to consider which sampling points are of highest priority and the significance of the microbial community at each potential sampling point. For example, in drinking water monitoring programs, sampling plans may need to prioritize points closer to the consumer as microbial communities have been found to significantly vary in composition throughout distribution systems. 50 Longitudinal studies are required to obtain results that are an accurate representation of fluctuating microbial populations within a system. 69 Longitudinal studies should be designed to capture periods of environmental change or system perturbation which may have significant impacts on microbial community and system function. Furthermore, system heterogeneity necessitates biological replication to determine variability within system types and technical replication to assess the efficacy of sample homogenization measures (Table 2). 171 Finally, efforts to address system heterogeneity must be balanced with the sequencing depth and sequencing costs.
Conclusion
This review introduces SGS and provides guidelines for monitoring water and wastewater environments using SGS. Despite the complexity of implementing DNA sequencing strategies for water and wastewater quality monitoring, 16S rDNA and WMS offer comprehensive methods for the characterization of microbial communities. Using SGS, water quality professionals can explore the potential of new wastewater treatment technologies, inform drinking water quality surveys, and track the spread of pathogenic genes throughout aquatic environments. In the future, climate change and growing populations are likely to increase the frequency of water shortages and waterborne disease outbreaks around the world.172,173 It is the responsibility of water quality professionals to utilize all the tools at their disposal for improving wastewater treatment and water resource stewardship.
Footnotes
Acknowledgements
We also acknowledge support from the Southern Ontario Water Consortium (SOWC) Advancing Water Technologies program. We thank Craig Jowett and Chris Jowett of Waterloo Biofilter Systems (Rockwood, Ontario) and members of the Schellhorn laboratory for helpful discussions.
Author contributions
A.C. and J.N. take co-authorship of this article. H.E.S. is the corresponding author and conceived of the topic and aided in the proof-reading and organization of the article. All authors have read and approved the final manuscript.
Declaration of conflicting interests
The author(s) declared no potential conflicts of interest with respect to the research, authorship, and/or publication of this article.
Funding
The author(s) disclosed receipt of the following financial support for the research, authorship, and/or publication of this article: This work was supported with funding from the Natural Sciences and Engineering Research Council of Canada (NSERC) Discovery and Engage programs to HES.