
Abstract
Compound freeform surfaces are widely used in bionic and optical applications. The manufacturing and measurement of such surfaces are challenging due to the complex geometry with multi-scale features in a high precision level with sub-micrometer form accuracy and nanometer surface finish. This article presents a study of ultra-precision machining and characterization of compound freeform surfaces. A hybrid machining process by combining slow slide servo and fast tool servo is proposed to machine compound freeform surfaces. The machining process for this hybrid tool servo is explained, and tool path generation is presented. Then, a normal template-based matching and characterization method is proposed to evaluate such compound freeform surfaces. Experimental studies are undertaken to machine a compound freeform surface using the proposed method based on a four-axis ultra-precision machine tool. The machined compound freeform surface is also measured and characterized by the proposed analysis and characterization method. The experimental results are presented, and the machining errors for compound freeform surfaces are also discussed.
Keywords
Introduction
Ultra-precision patterned microstructures, including freeform surfaces by superimposing microstructures, are widely adopted in optical applications, such as three-dimensional (3D) imaging, micro-optical telescopes, confocal microscopy, endoscope systems, and machine vision,1–5 to realize the specified optical performance and a compact system. Such kind of compound surfaces can be fabricated through various approaches. For example, microlens array on a curved surface was fabricated by transferring the pattern to another polymeric template which was then deformed by negative pressure. 6 Other methods are found to fabricate microlens arrays such as quartz wet etching. 7 However, these methods are either of complex process, lack of feasibility of form control, or in a low precision which is not applicable for optical applications.
Ultra-precision diamond machining with tool servo is an enabling technology to generate complex optical surfaces such as microstructure array (MSA), including slow slide servo (S3) and fast tool servo (FTS). The S3 is generally used to machine surface components in low frequency and high amplitude such as continuous freeform in high precision, but for surface components in high frequency such as microlens array, the machining efficiency of S3 is very low due to the low spindle speed employed during the cutting process which is generally within 10–100 r/min. For example, in a research work by Zhang et al., 8 the mold insert for microlens array on a curved surface for 3D artificial compound eye was machined by S3 machining. The FTS is generally used for such high-frequency surface components with a much higher spindle speed usually within 50–300 r/min. However, the machining distance is usually limited by the stroke of FTS. Some researchers were found to machine brittle materials using FTS process, for example, Li et al. 9 undertook the research work on FTS-assisted ultra-precision turning of near-rotational freeform surface made of brittle materials.
Combination of S3 and FTS will take advantages of the both and can process a wide range of surface topography. Some research works have been undertaken on the integration of FTS and S3 in the past 10 years. Brecher et al. 10 generated structured freeform surfaces using a hybrid process of FTS and dynamic slide motion. Scheiding et al. 11 fabricated microlens array on a rotational curved surface by using voice coil FTS. Neo et al. 12 machined compound-eye workpiece with smaller spherical surfaces on a larger spherical base surface by the technology of hybrid FTS and S3 diamond turning. However, there is still not much research work available on the fabrication of compound freeform surface using hybrid tool servo (HTS) process especially in a general ultra-precision machining center.
Besides the manufacturing technology for generating structured surface on freeform surface, it is very difficult to characterize the compound freeform surfaces due to the geometrical complexity and also high precision. Compound freeform surfaces commonly possess tessellated pattern, for instance, microlens arrays, micro-pyramids, and micro-grooves. Hence, the target of the characterization of these surfaces not only needs to characterize the form error of the substrate surface but also each single feature and their distribution.13,14 Currently, optical microstructured surfaces are usually characterized by their surface quality, such as surface roughness, as well as by their optical properties such as their modulation transfer function. 15 Surface matching-based methods have also been used to characterize the microstructured surfaces, but instead of quantitative pattern analysis of the lens arrays, only conventional surface height parameters, such as peak-to-valley-height and root-mean-square, are used in the characterization.16,17 A pattern and feature parametric analysis method was proposed by the authors in their early research work for characterizing optical microstructures. However, the research is still limited for microstructures on a planar base surface. 18 There is a need for developing a new method for analyzing and characterizing such compound freeform surface.
As a result, this article presents a hybrid machining process by combining FTS and S3 to generate compound freeform surface. The surface generation for this HTS machining process is explained first, and then the analysis and characterization method proposed for evaluating such compound freeform surface is proposed and explained step by step. Experimental studies are undertaken on a four-axis ultra-precision machine tool to machine; a compound freeform surface is successfully produced; and the machined compound freeform surface is characterized and analyzed using the proposed methods.
Compound freeform surface generation by HTS process
The HTS process involves both the FTS and the S3 processes. Therefore, the surface generation by FTS, S3, and the hybrid processes will be explained in detail in the following sections.
FTS machining process
During FTS machining process, the workpiece rotates with spindle and feeds along the X-axis, while the diamond tool is actuated back and forth along the Z-axis according to the profile of the workpiece surface, 19 as shown in Figure 1. The angular position of the main spindle is fed to the FTS together with the linear position of the workpiece in the X-axis. The FTS generates the stroke distance, and the diamond tool is controlled by a piezoelectric activator. Hence, the relative motion between the cutting tool and the workpiece in the X- and Z-axis generates the surface topography of the MSA.
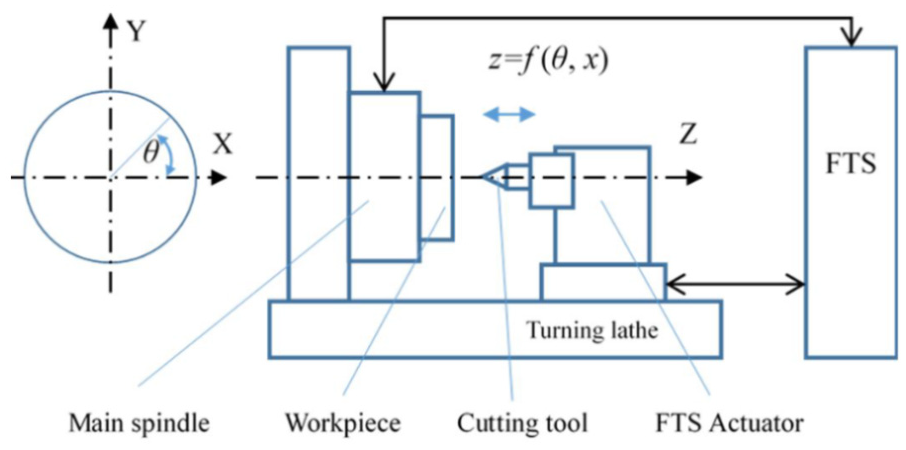
Illustrative map for FTS machining process.
Since both FTS and S3 are turning-based process, the projection of the tool path into the X-Y plane should be a spiral locus. It is well known that two specific parameters are defined for locating the position of a diamond tool in a rotational coordinate system.20,21 These parameters are radius

Relationship between location parameter

where f is the feed rate in mm/min, V is the spindle speed in r/min, and t is time in seconds; mod(a, b) is a modulo operation which finds a remainder after a division of
The coordinate in z-direction contributed by FTS

The stroke of FTS is then determined by equation (3). Therefore, the tool path for FTS
S3 machining process
In S3 machining process, a diamond tool is mounted along the Z-axis slide of a lathe and the workpiece with the freeform surface or non-symmetric surface is mounted on the work spindle (C-axis), 22 as shown in Figure 2. As the part rotates, the Z-axis slide carrying the diamond tool oscillates in and out to generate the surface. The Z-axis slide is driven in the translation by a linear motor which is optimized to drive the Z-axis slide and the diamond tool in a sine wave type of motion with variation of amplitude and frequency. The C-axis is an additional axis in the machine coordinate system, which rotates the workpiece about the Z-axis, and is position-controlled to very high accuracy.

Machining mechanism of S3 machining process.
The S3 machining is conducted in polar or cylindrical coordinates. The surface data in Cartesian coordinates

The tool path generation (TPG) for S3 machining process includes the creation of 2D points

HTS machining process
The HTS process is developed based on an S3 process with an additional FTS process, which is quite suitable for machining compound freeform surfaces such as compound-eye structures. Figure 3 illustrates the machine configuration for the HTS machining process. The workpiece is mounted on the C-axis, while the cutting tool is carried by FTS actuator, which is equipped on Z-axis. In the proposed HTS process, the base surface (non-rotational or freeform) is machined by the S3 process, while microstructures or microlens array are machined by the FTS process. The two processes are controlled separately, with appropriate feedback through angular and X-axis position from S3 process to FTS process. The two systems are linked by azimuthal position and distance from the rotational center, or the time. There exits some following errors or synchronization deviations. For this reason, the spindle speed used in HTS process cannot be very high and limited by the frequency bandwidth of the tool servo. Figure 4 graphically illustrates the machining of compound freeform surfaces by the HTS machining process.
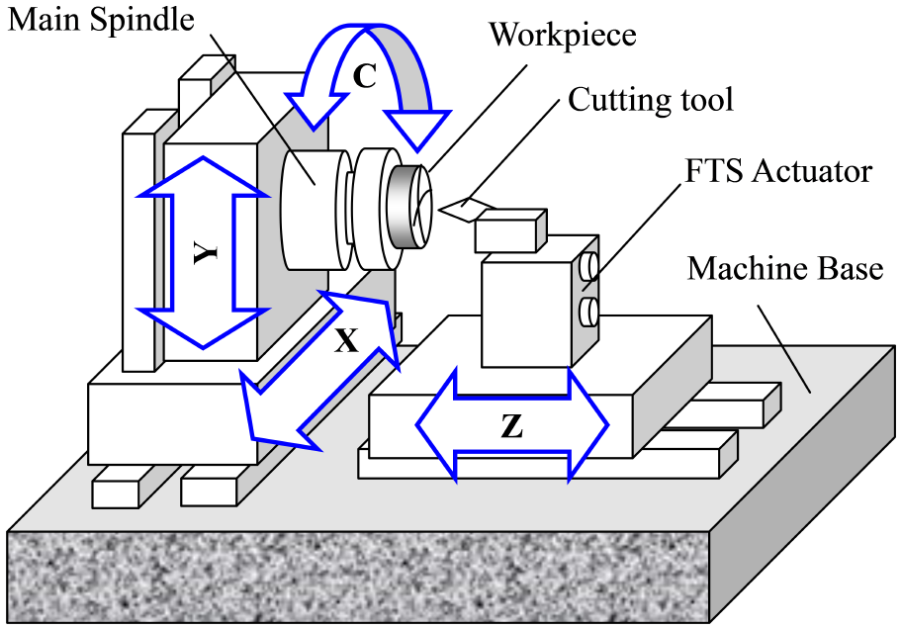
Illustration of the machine configuration for the hybrid tool servo (HTS) machining process.

Graphical illustration of machining of compound freeform surfaces by the hybrid tool servo (HTS) machining process (S3+FTS).
Figure 5 shows the flowchart for the generation of a compound freeform surface by the HTS machining process, provided that the computer-aided design (CAD) model is available for such compound freeform. Generally, there are two synchronous modes for S3 and FTS: position synchronization and time synchronization. Therefore, S3 can transmit position of the radius (r) and theta (θ) to FTS to realize position synchronization or transmit the machining time (t) to FTS to realize time synchronization. The designed compound freeform surface is first divided into a freeform base surface (FBS) and MSA. The tool path (C, X, Z) is generated for the former, and then FBS is machined by S3 process. For the latter MSA, FTS stroke is calculated based on the position information (r, θ) or time (t), and hence the FTS process is implemented during S3 process to machine the MSA. The combined process with S3 and FTS therefore generates the compound freeform surface based on equations (1)–(5).

Flowchart for compound freeform surface generation by hybrid tool servo machining process.
Characterization of compound freeform surfaces
In order to evaluate the produced compound freeform surface, a normal template-based matching and characterization method has been proposed in this article. Figure 6 illustrates the flowchart of the characterization method for compound freeform surface. As explained previously, compound freeform surfaces refer to those that consist of MSA on an FBS. As shown in Figure 6, noise in the measured data is first processed, and a normal surface template is generated by the discretization of the designed model such as the defined equations in a high density to ensure the matching and evaluation precision. The discretization density or data resolution is usually at least 10 times more than the measured dataset. Then, data for surface matching are selected and data matching process is implemented according to the least-squares criteria. After the data matching process, the measured data are aligned to the exact position in the normal template, and the data are processed with base surface form removal. Then, the measured data are separated into FBS data and MSA data. After the data separation process, the two sets of data are evaluated. The form error of FBS data is obtained directly by comparing the measured data and the normal template. For the error evaluation of MSA data, the measured data are processed by fitting and matching the data to the normal template (MSA normal template), and then the form error and dislocation of MSA are obtained. In the following sections, noise processing, data matching, data separation, and the error analysis of compound freeform surface are explained in detail.

Flowchart of the characterization method for compound freeform surface.
Noise processing
In this study, the change ratio of the slope of the data points is employed to determine the noise points. The change ratio of the slope is calculated by the second derivative. According to Fourier transformation, the following equations can be obtained for the discrete dataset


Equations (6) and (7) can be used to determine the slope and its change ratio of the data points, so as to find out the outliers in the measured data. In the proposed study, the data points with the change ratio exceeding three times of the standard deviation of all the second derivative of the dataset are taken as the outliers. The data taken as the outliers will be replaced by the averaged value of the measured data points around it before the matching process. The main purpose to determine such outliers is to exclude these data for data matching; in other words, only the data points with confident accuracy are used for matching. If there are some points taken as outliers by accident, they will not affect the data matching accuracy.
Data matching
The purpose of data matching is to find the corresponding position of the measured data in the design model. In the past few years, a series of methods has been proposed to carry out the surface matching for freeform characterization. 23 In the current study, least-squares method is used to optimize the six parameters of the rigid body transformation matrix to determine the matching position, which is expressed as

where

where a, b, and c are the translational amount along the X, Y, and Z axes;
Since the compound freeform surface consists of MSA and freeform surface as the base, the data matching is implemented by two steps: corresponding data searching and matching between the designed and the measured FBS are undertaken first, and then the data matching between the designed and the measured MSA is carried out. Each step generates a rigid body transformation matrix which is applied to both the base surface and the MSA. This ensures there is no misalignment of the base surface and MSA, and hence the complete measured compound freeform data are aligned to the design model. Since the normal data are designed as two parts, base surface and microstructure, there is no need for separating them during the matching process. After the two steps of data matching, the measured compound freeform surface is aligned to the designed model, or the data registration is completed.
Data separation
Since the form errors of base surface and MSA need to be characterized, the data in base surface and MSA will be recognized and separated. After the surface data matching, the measured data are directly processed by form removal of theoretical base surface. Then, the data will be separated. As shown in Figure 7(a), the MSA is defined with periodic pitch p in directions, aperture

Illustration for data separation of compound freeform surface: (a) Grid generation to determine the bottom point of each microstructure; (b) Inner and outer diameters set to identify different data in MSA.
Error analysis of compound freeform surface
The errors of the compound freeform surface including the microstructures and FBS are a mixture of FTS and STS (slow tool servo) processes. In this study, the compound freeform surface will be evaluated as a whole, instead of analyzing the corresponding error effects from the two processes which will be very complicated and out of the scope of the article.
After data matching and data separation, the form error of base surface is then evaluated by directly comparing the measured data and the normal template. Form error of each microstructure can also be obtained by the same approach. Besides the form error, the location errors of each microstructure are also evaluated. In this study, the MSA is a spherical surface array; therefore, the centers of each spherical surface are chosen to represent the location of the MSA. Dislocations of MSA are evaluated by finding out the deviation vectors formed by the measured location and the designed location, as shown in Figure 8. From the deviation vectors, both the dislocation amplitudes and the directions are obtained.

Illustration of dislocation of MSA in compound freeform surface.
Experimental studies and discussions
To implement the HTS machining process and characterization method, a compound structured surface is designed and machined by an ultra-precision machining system named Nanotech 350FG (Moore Inc., USA). The cutting tool is a round diamond tool with a tool nose radius of 0.025 mm and a clearance angle of 15°. Spindle speed used in the experimental cutting test is 100 r/min, while the feed rate is 1 mm/min. The machining parameters used in the study are based on the designed compound freeform surface and the tool servo characteristics. For example, the tool nose radius is selected to ensure the designed microstructures to be produced without any tool interference. The spindle speed is controlled to avoid some following errors or synchronization deviations between the two processes. The workpiece material is aluminum alloy AL6061. Table 1 summarizes the parameters and conditions for the experimental cutting test.
Summary of experimental cutting test.

FTS: fast tool servo; S3: slow slide servo.
In this study, a compound freeform surface is designed as a set of spherical microstructures on a toric base shape, since a toric surface is a simple non-rotational symmetrical surface different from aspherical and spherical surfaces. Besides, a set of spherical surfaces as the microstructures are most commonly used microstructures such as compound-eye imaging system. This ensures the experiments to be verified more accurately.
The toric base surface is expressed as follows

where R1 = 500 mm and R2 = 250 mm are the two radii. The microstructures are a 7 × 7 spherical surface array, which is defined with a radius of 10 mm, aperture of 1 mm, and pitch in two directions of 2 mm, as shown in Figure 9(a). The workpiece is a cylinder with a diameter of 15 mm and length 20 mm, as shown in Figure 9(b).

Workpiece blank and microstructures to be machined: (a) structure pattern and (b) blank dimension.
Figure 10 shows the tool path for generating the designed compound freeform surface based on the HTS process as presented in section “Compound freeform surface generation by HTS process.” The cutting locus of the diamond tool is based on the turning process; therefore, the trajectory of the cutting point is a spiral projection on the X-Y plane, as shown in Figure 10(a). The feed rate is set to be a large value so as to show clearly the cutting trajectory. Figure 10(b) shows the tool path for S3 to generate the base surface, while Figure 10(c) shows the tool path for MSA. Figure 10(d) shows the overall cutting tool path for machining the designed compound freeform surface.
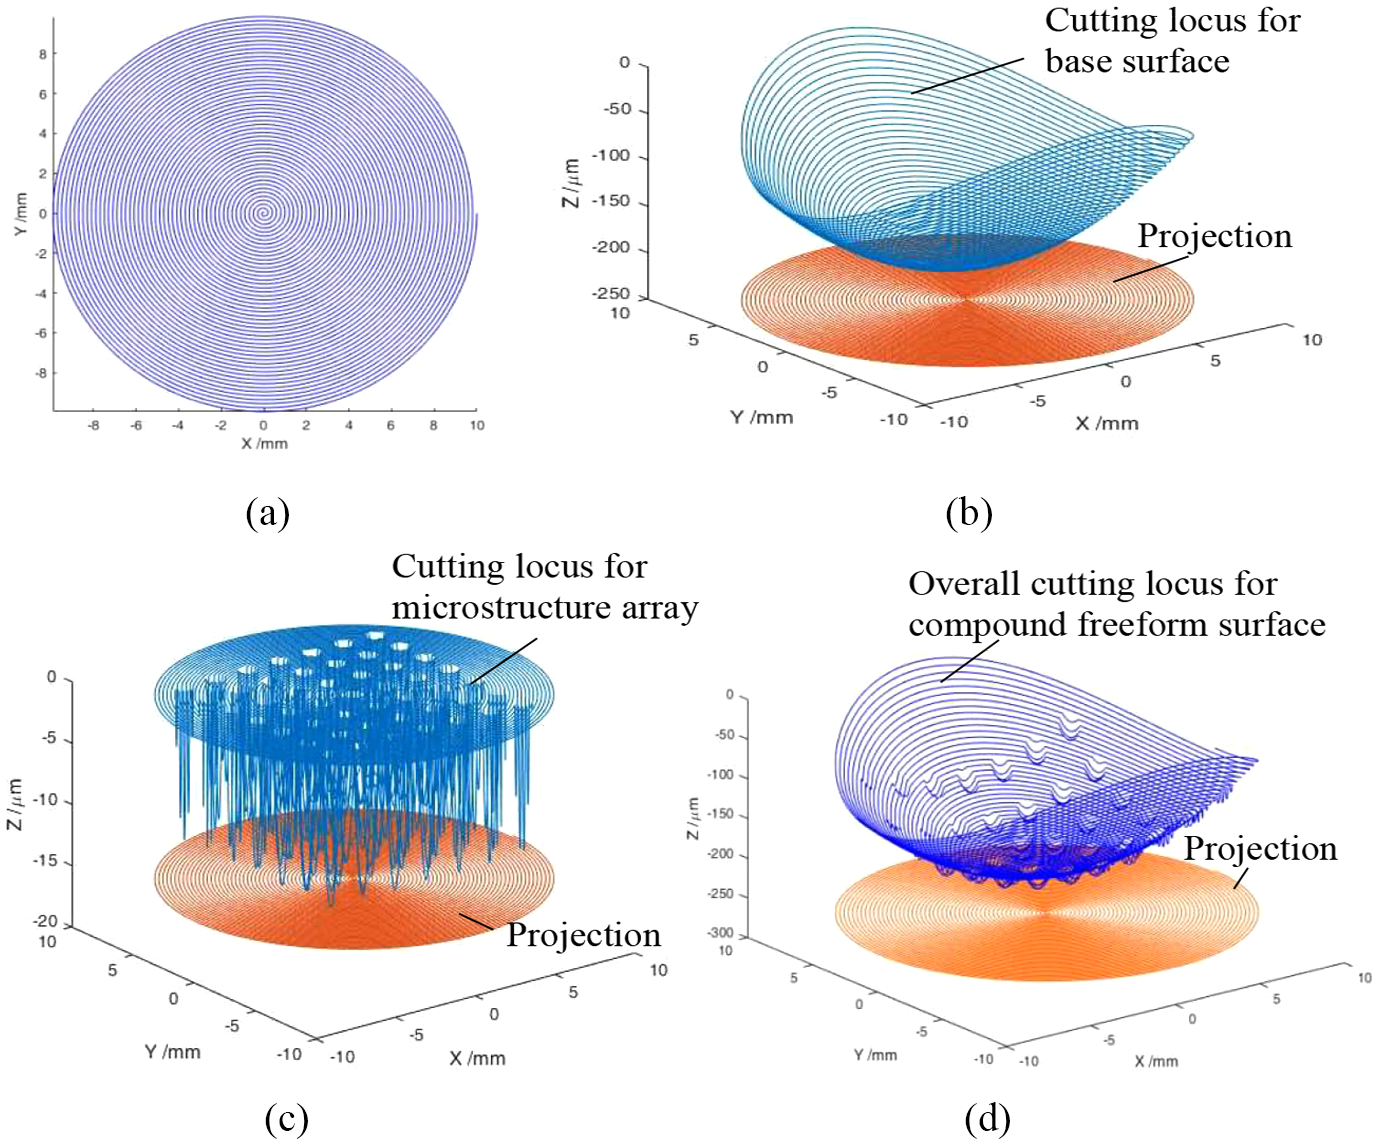
Illustration of tool path generation for the designed compound freeform surface: (a) spiral cutting locus projected in X-Y plane; (b) cutting locus for base freeform surface; (c) cutting locus for microstructure array; and (d) overall cutting locus for the compound freeform surface.
Figure 11 shows the machined surface measured by a non-contact measuring system named Nexview (Zygo Corporation, USA) using a stitching method. There might be stitching errors for the measuring instrument. However, the proposed characterization method is focused on the data processing, and therefore, the influence of the metrology setup on the accuracy of the result will be out of the scope of the article. The produced compound freeform surface appears to have good surface features such as the patterns and sharp edges of the microstructures on the FBS.
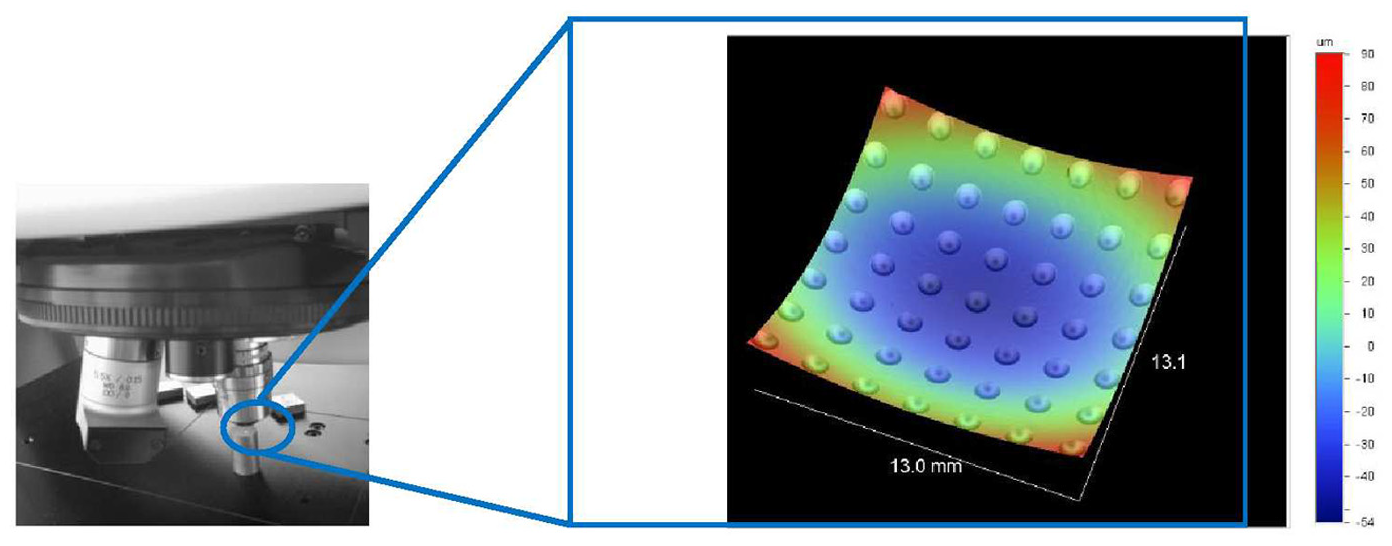
Measurement of the machined compound freeform surface.
The generated compound freeform surface was then characterized using the proposed normal template-based matching and characterization method in terms of the form error of base surface and MSA, as well as the dislocation of the MSA. Figure 12 shows the measured data and designed data in the same coordinate system. Before the data matching process, the noise in measured data is processed first. Figure 13 shows the determination of points taken out based on the second-order derivative of the measured data. Outliers, points in surface boundary, and points in the conjunction areas between MSA and FBS are all identified based on the same criteria as presented previously and then taken out; in other words, these data points will not be used for surface matching so as to enhance the matching accuracy. After these data are processed, the measured data are matched to the normal template, as shown in Figure 14.

Imported designed model and measured data in one coordinate system.

Determination of points to be eliminated from surface matching.

Measured data after surface matching.
Figure 15 shows the form error evaluation process for the compound freeform surface, including the FBS and MSA. The form errors of FBS are found to be Sa = 2.608 µm (arithmatic mean) and Sq = 0.582 µm (root mean square). This unusual error topography of FBS might be due to the asymmetrical camping force release of the workpiece fixture and other unknown reasons. For the MSA in the compound freeform surface, the Sq values of the MSA are listed in Table 2, and the topography of each microstructure and the overall MSA are shown in Figure 15. The minimum and maximum Sq values for MSA are 0.112 and 0.836 µm, respectively. Table 3 summarizes the dislocation of the MSA regarding the distance between their corresponding centers, while Figure 16 shows the evaluation results for the dislocation of MSA, which indicates that dislocation (positioning errors) of MSA varies with the distance from the center of the compound freeform surface, that is, the farther the distance from the center, the larger the dislocation errors. The directions of the dislocation also demonstrate a regular pattern, that is, a clockwise spiral pattern. All these information is helpful for the diagnosis of machining errors, which will be investigated in the future study.

Form error evaluaiton for the compound freeform surface: (a) measured data after base surface form removal; (b) data seperation; (c) form error of FBS; (d) MSA after removal of form error of FBS; (e) topography of MSA form error; and (f) form errors of MSA.
Form error (Sq) of MSA in the compound freeform surface (unit: µm).

MSA: microstructure array.
Dislocation of MSA (distance between the centers; unit: µm).

MSA: microstructure array.
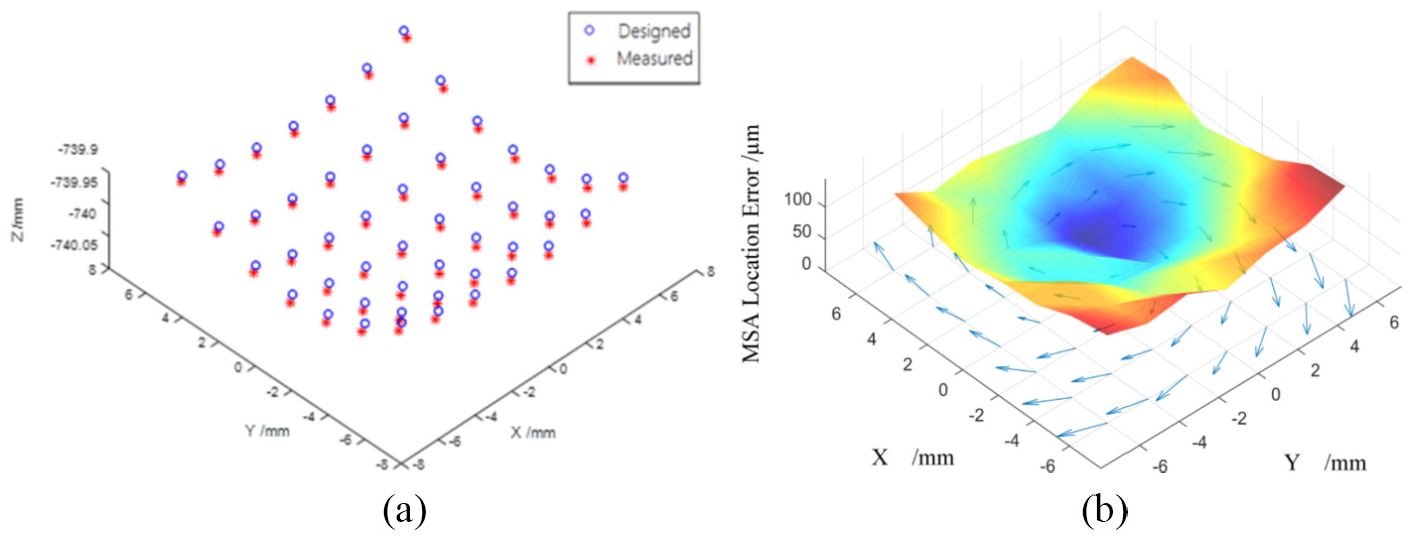
Analysis results of the dislocation of MSA: (a) positions of MSA and (b) topography of dislocations.
Conclusion
Ultra-precision machining with tool servo including S3 and FTS is an enabling process to fabricate various freeform surfaces and microstructures with optical finish. Combination of S3 and FTS provides a more efficient approach and an enhanced machining ability for manufacturing compound freeform surfaces. Besides, there is still a lack of analysis and characterization method for the error evaluation of compound freeform surface. This article presents a systematic study of ultra-precision machining and characterization of compound freeform surfaces. A hybrid machining process combining FTS and S3 is proposed, and TPG of the process is explained. A normal template-based characterization method has been proposed to evaluate compound freeform surface. Experimental studies are undertaken to successfully produce a compound freeform surface using the hybrid machining method based on a four-axis ultra-precision machine tool, and the machined surface was also characterized by the proposed evaluation method. The results verify the validity of the HTS process and the proposed characterization method for manufacturing and characterization of compound freeform surfaces. The present research work is helpful for extending the machining capability of the existing machine tools, and the characterization method also provides useful information for the diagnosis of machining errors.
Footnotes
Acknowledgements
The authors would like to express their sincere thanks to National Key R&D Program of China, Shanghai Science and Technology Committee Innovation Grand, and Science Challenging Program of CAEP for their support.
Declaration of conflicting interests
The author(s) declared no potential conflicts of interest with respect to the research, authorship, and/or publication of this article.
Funding
The author(s) disclosed receipt of the following financial support for the research, authorship, and/or publication of this article: This study was financially supported by the National Key R&D Program of China (Project Nos 2017YFA0701200 and 2016YFF0102003), Shanghai Science and Technology Committee Innovation Grand (Grant No. 17JC1400601), and Science Challenging Program of CAEP (Grant No. JCKY2016212A506-0106).