
Abstract
Three arrangement types of fibrous media have been established including “Mesh” (layered distribution), “Para” (unidirectional distribution), and “Nurbs” (random distribution), with fiber diameters ranging from 5 to 7 µm and solid volume fractions ranging from 14.58% to 21.95%. To describe the filtration performance, particles trajectories, and the influence of structural parameters of fibrous media, the computation fluid dynamics is adopted. The filtration efficiency and the pressure drop of fibrous media are calculated in computation fluid dynamics and semi-analytical model. It is found that the arrangement types have significant effects on the filtration efficiency and show the limitation of the semi-analytical model. With the Stokes number larger than 1, the numerical results and semi-analytical model have great consistency in the filtration efficiency for the “Mesh” and “Para” types than “Nurbs” type. Meanwhile, the pressure drop between the numerical results and the semi-analytical model is always consistent.
Keywords
Introduction
Respirable particulate matter, such as PM2.5, can cause harmful effects on the body’s respiratory system. The primary sources of particulate matter include combustion of fossil fuel, industrial sources, automobile emission, and biomass burning. 1 At present, fibrous media has been extensively used in industry and home, since it has excellent filtration efficiency to remove fine particulate matter from the gas stream. It is known that the filtration efficiency and the pressure drop are key parameters to characterize the quality of fibrous media. Therefore, it is essential to predict the performance of the fibrous media in the product development. 2
In the past, extensive works on the fibrous media had been conducted by scholars, who had contributed to the development of filtration theories.3–6 Owing to these works, the filtration efficiency and the pressure drop as a function of parameters relating to fiber diameter, thickness, flow characteristics, and so on have been empirically derived and verified under various experimental conditions. Meanwhile, the numerical simulation for predicting filtering quality is popular in recent 20 years.7–14 To simplify the model of fibrous media, some studies used single fiber or 2D geometry.7–9,12 However, the whole property of fibrous media is hard to be reflected by the single fiber accurately. So some scholars had developed 3D fibrous media to simulate the filtration process.10,13–18 Even though the improved 3D geometry have replaced the oversimplified 2D geometry, there are still many assumptions in modeling fibrous media. Generally, the 3D fibrous media can be classified into three categories: 19 unidirectional structures, 13 assuming all fibers are parallel with each other; random layered structure, 17 assuming all fibers lie randomly in parallel planes; and three-dimensional random structure,14,18 assuming all fibers lie randomly in any directions in a space. Xu et al. 13 used computation fluid dynamics (CFD) and semi-analytical model to illustrate the relationship between filtration performance and dust loading under two different particle deposit structures basing on the unidirectional structure. Yue et al. 14 and Qian et al. 17 simulated the gas-solid flow characteristics in fibrous media with CFD–discrete element method (DEM) basing on the random layered structure and three-dimensional random structure, respectively. It is worth noting that they all verified the simulation results with the same theoretical analysis model, which deduced by predecessors. However, the theoretical analysis model does not contain the correction parameters for the way the fibers are arranged in the space.
In this study, in order to study the effects of fibrous media parameters on filtration characteristics, the three-dimensional random fibrous filters, unidirectional fibrous filters, and the layered fibrous filters are established through a modeling procedure. Three key parameters (particle diameter, solid volume fractions and inlet velocity) are identified. The discrete phase model (DPM) is adopted to track the trajectories of particles.
Mathematical theory
Gas phase model
The Navier-Stokes equations are adopted in this study, and then both the continuity equation and momentum equation can be expressed as follows:
For the gas phase, the equation is expressed as follows


The equation on the stress tensor is given as follow

where ρ is the gas density,
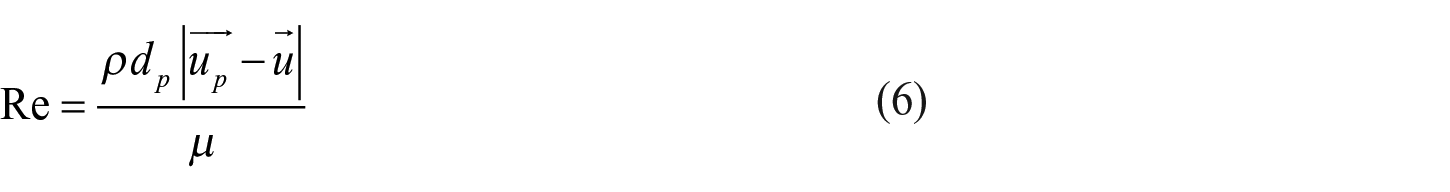
Owing to the low fluid velocity and small fiber diameter, the Reynolds number in this study is so small that the airflow through the fibrous media is considered to be laminar.
Discrete phase model
The Lagrange algorithm is used to predict the particles trajectories of discrete phase by equilibrating particle stresses. This force balance can be written as follows
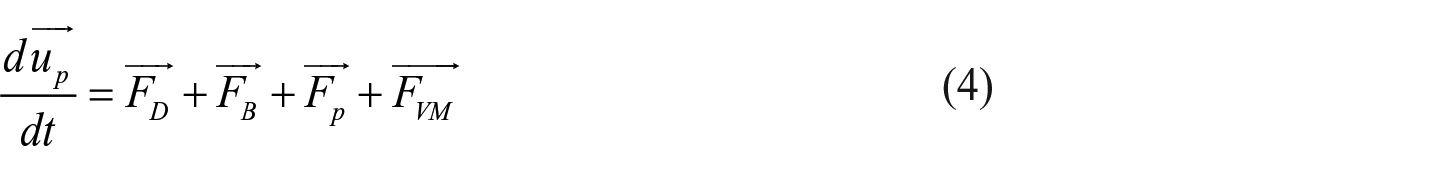


where
In the particle filtration, the Brownian diffusion predominately influences the particles smaller than 0.1 µm in diameter, while inertia collision and interception predominately influence the particles larger than 0.5 µm in diameter. As the diameter of the particles ranges from 1 to 3 µm in this study, the inertia collision and the interception are considered and the Brownian diffusion is ignored.7,20
The semi-analytical model
The semi-analytical model has been developed to estimate the filtration efficiency and the pressure drop as a function of fiber, particle, and airflow properties. In this study, two equations for filtration efficiency and pressure drop are adopted, which are frequently used in literatures. That is because simulating fibrous media and solving its flow field is complicated, which makes the semi-analytical model attractive to people. The expression of fibrous media’s pressure drop and total filtration efficiency are as follows21,22


where

The SFE can be obtained as the combination of interception (ER) and inertial impaction (EI) in this study 21

Filtration efficiency due to interception and inertial impaction are given as follows4,21,24
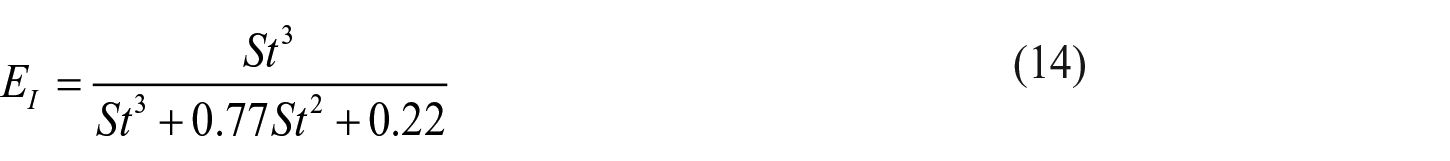

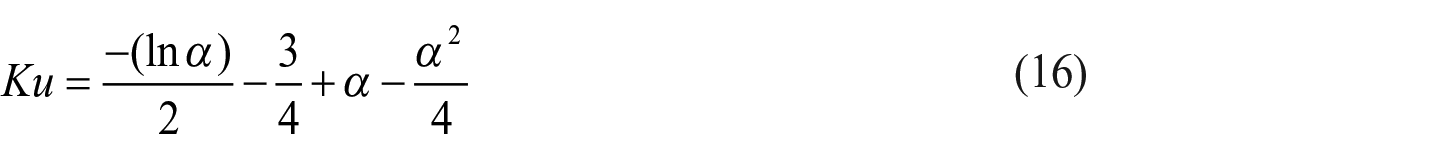

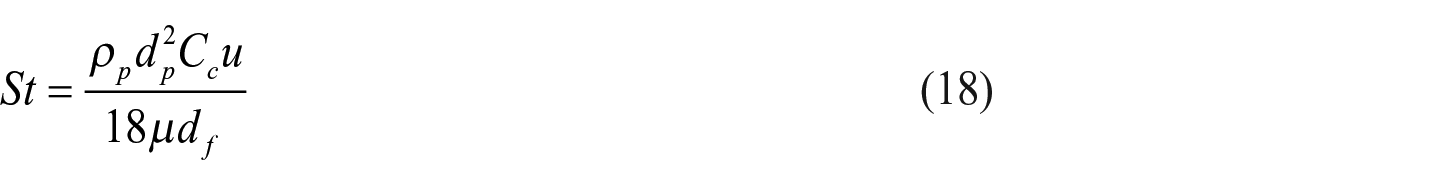

where R is the ratio of particle diameter to fiber diameter, Ku is the Kuwabara factor, St is the Stokes number, λ is the mean free path of the air molecules, and Cc is the Cunningham correction factor.
Simulation model
Set up fibrous media
This study developed three arrangement types of fibrous media including unidirectional structure, layered structure, and three-dimensional random structure; for convenience, hereinafter referred to as “Para,” “Mesh,” and “Nurbs.” In order to simplify the actual model of fibrous media, it is assumed that all fibers of the fibrous structure with the same diameter. For the unidirectional structure, all fibers parallel staggered without intersection. Hence, there is no contact between the fibers. For the layered structure, each layer is distributed uniformly and the adjacent layers parallel staggered. For the three-dimensional random structure, all the fibers are randomly arranged with random angles in setting space. Moreover, the non-uniform rational B-spline (NURBS) is adopted to form curve fibers. NURBS is a kind of widely used spline curve, which can not only describe free curve and surface but also provide a unified expression which can express curve and surface accurately. Using the numerical calculation, the uniform and continuous spline curve can be constructed by approximating polygon with smooth parametric curve. Hence, the characteristics of fiber can be accurately described.
With the assumptions and methods above, a set of modeling methods have been set up in this study. The first step, delimiting the spatial extent of the fibrous media, is shown in Figure 1(a). For the unidirectional structure, select any side of “A,” “B,” “C,” or “D” as the starting face. Next, the surface source is set up according to the staggered arrangement of adjacent fibers as shown in Figure 1(b). Then, the spatial line groups can be generated by combining the face opposite the surface source. For the layered structure, the difference is choosing two arbitrary adjacent faces as the starting faces and the other the same with the unidirectional structure. For three-dimensional random structure, first, randomly select two points on “A,” “B,” “C,” or “D” shown as “P1” and “P2” in Figure 1(a). Next, randomly generate a point (“P3”) in the computational domain and control the distance between “P1” and “P3” and the distance between “P2” and “P3.” In this way, the shape of the curve can be controlled. Moreover, the curve can be generated by the method of Non-uniform rational B-spline (NURBS). In the above methods, the generation of each fiber is accompanied by the calculation of the solid volume fractions (SVFs). In general, in order to control the SVFs within the predetermined ranges, the final fiber needs to be generated and deleted multiple times. Then, the visual model of fibrous media could be achieved by combining with the AutoLisp. In this study, the deviations of the SVFs can be controlled under 0.5%. Figure 1(c)–(e) shows the fibrous media in this study.
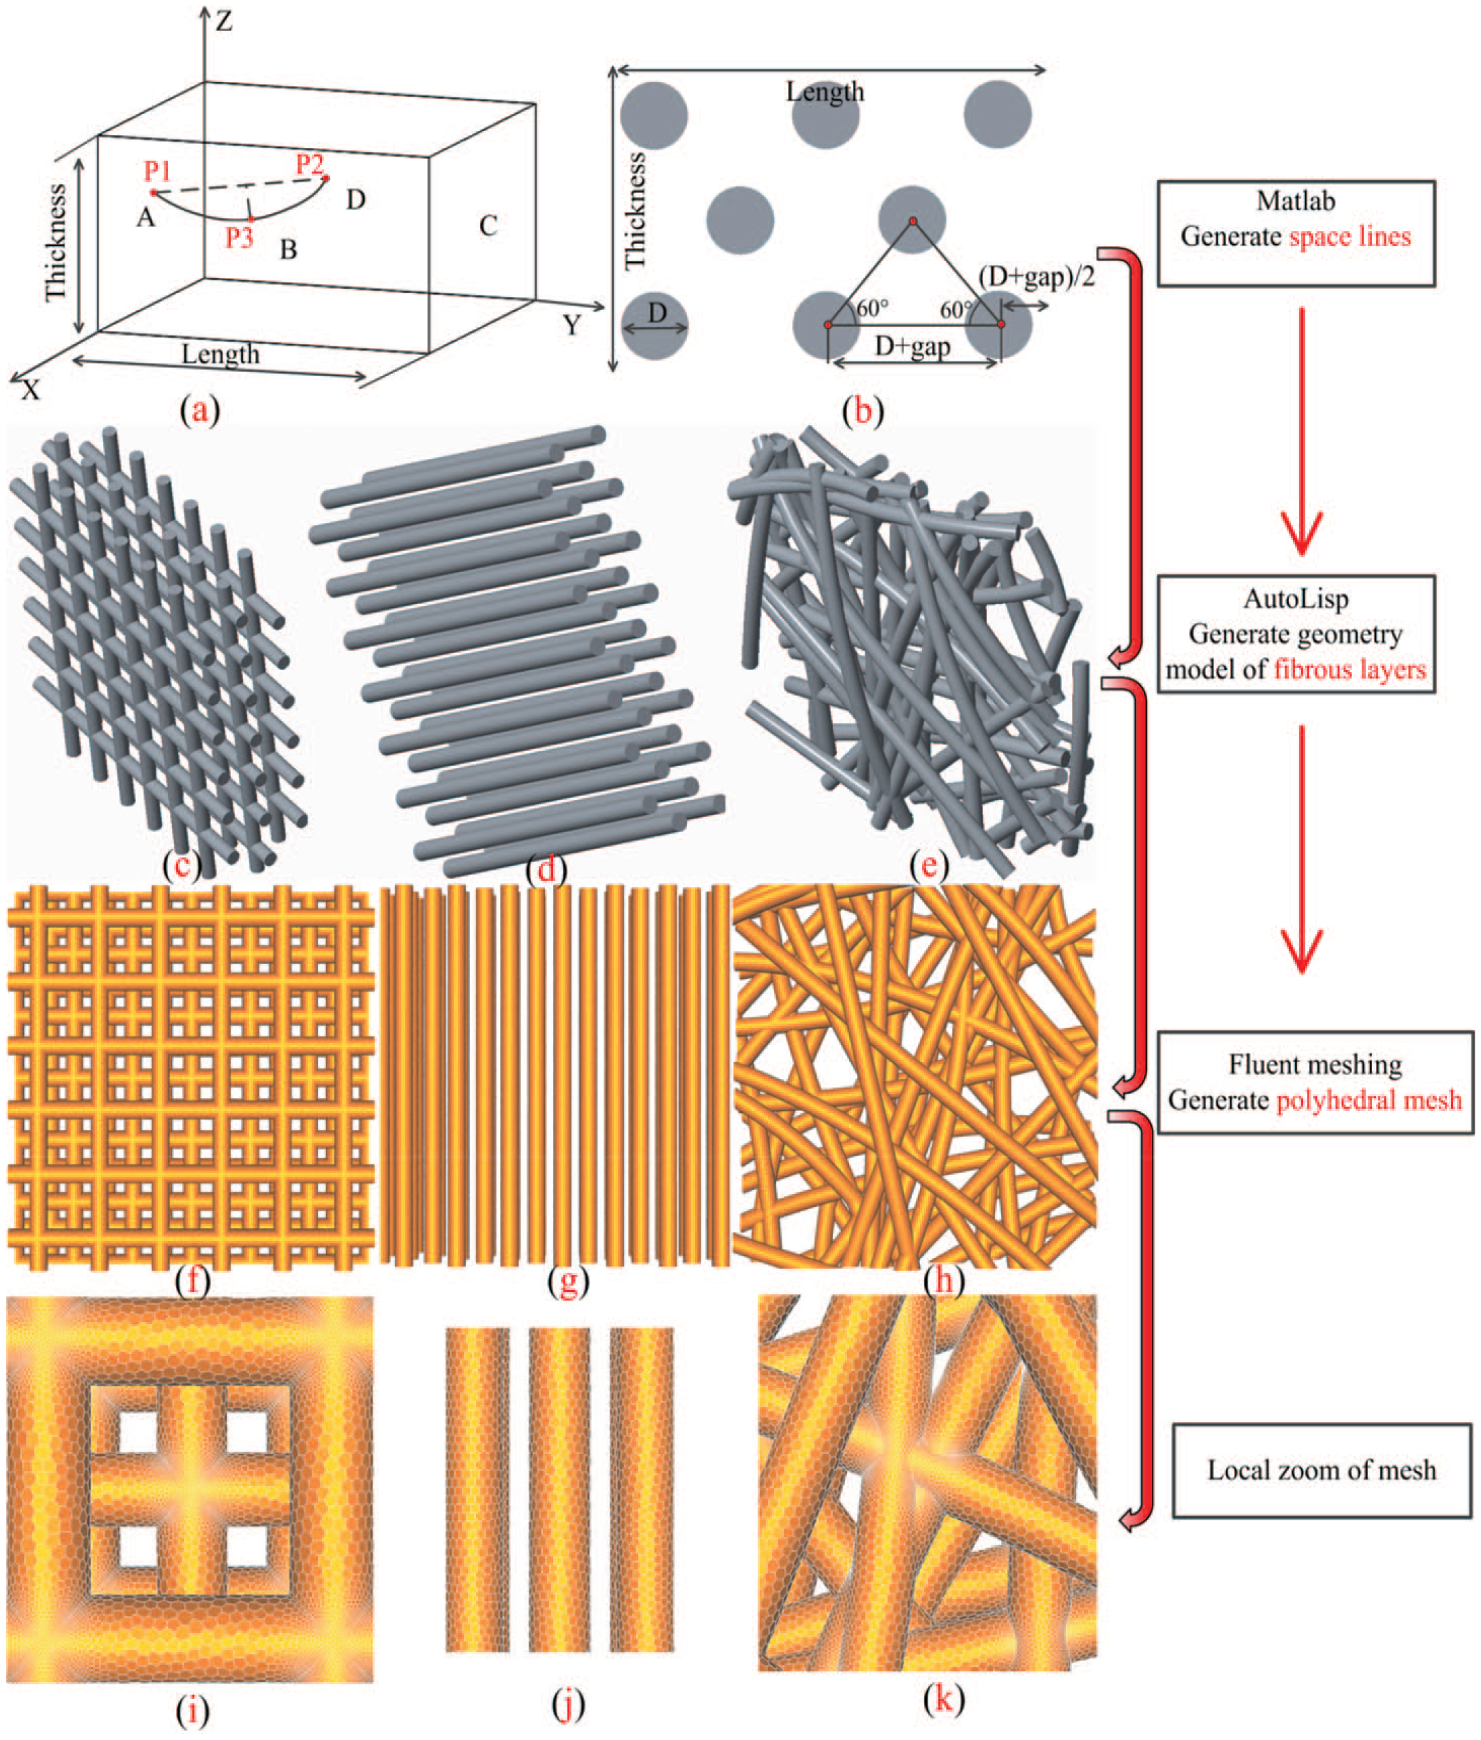
The concise description of the model generation process. (a) and (b). Generating space lines;(c)-(e). The 3D models of fibrous media; (f)-(h). The polyhedral mesh of fibrous media;(i)-(k). The local zoom of mesh.
During the numerical simulation, the number and the size of the grid will affect the simulation results, and the influence of the grid number on the flow characteristics is extremely important to ensure the accuracy of the simulation results. In order to ensure the quality of the calculation while saving the computing resources, the process of grid generation can be conducted through three steps. The process of grid generation can be conducted through three steps. The first step is to generate a surface grid. The second step is to refine surface grid. The last step is deemed as choosing the appropriate grid which can truly reflect the phenomenon of the flow with less time spent on simulation. The polyhedral mesh is used in this study, shown in Figure 1(f)–(h). Combining with the local zone of mesh, the polyhedral mesh shows a perfect fit with the geometry, shown in Figure 1(i)–(k).
Simulation condition
The solution type for the air phase is pressure based, and the velocity formulation is absolute. The inlet and outlet boundary conditions are set as “velocity inlet” and “pressure outlet,” respectively. Meanwhile, the boundaries of other faces of the computational domain are set as symmetry boundary conditions basing on the structural characteristics of the fibrous media. For airflow on the fibers’ surfaces, the no-slip boundary condition is set. The inlet boundary condition placed at a distance 20df upstream of the fibrous media to ensure the particles are not released in an area affected by the flow field about the fibers and the outlet placed at a distance 10df downstream of the fibrous media. The inlet and outlet boundary are “escape” and the surface of the fibers is “trap.” Take the “Nurbs” type as an example; the boundary conditions of fibrous media are shown in Figure 2.

Simulation geometry and boundary conditions.
In order to study the effect of fiber arrangement on the filtration performance, the arrangement types of fibrous media, SVFs, fiber diameter, particle diameter, and inlet velocity are set as variables. The inlet velocity ranges from 0.1 to 1 m/s and the particle diameter ranges from 1 to 3 µm. The detail simulation parameters are shown in Table 1.
CFD simulation cases.

Grid-independent testing
The efficiency of the fibrous media can be determined by the number of particles it can remove from the aerosol flow:

where Nin and Nout are the numbers of entering and exiting particles, respectively. In this study, a certain number of particles will be released from the inlet and tracked as they flow through the fibrous media. And then, the Nin and Nout are adapted to calculate the filtration efficiency.
In order to accurately simulate the aerosol flow through the fibrous media, it is critical to ensure that the results are not grid-dependent. Therefore, virtual fibrous media should be used to verify the effect of grid density on the filtration efficiency and the pressure drop. To do so, five different grid densities are used and the detail parameters are shown in Table 2. Figure 3 shows that the number of cells has certain effects on the filtration efficiency and the pressure drop. However, with increasing number of cells, the trend of the filtration efficiency and pressure drop toward a fixed value. When the number of cells is approximately 700,000 under the same conditions, the efficiency and the pressure drop no longer change obviously. Therefore, the fourth grid size is adopted in this study.
Parameters of different grid scale.

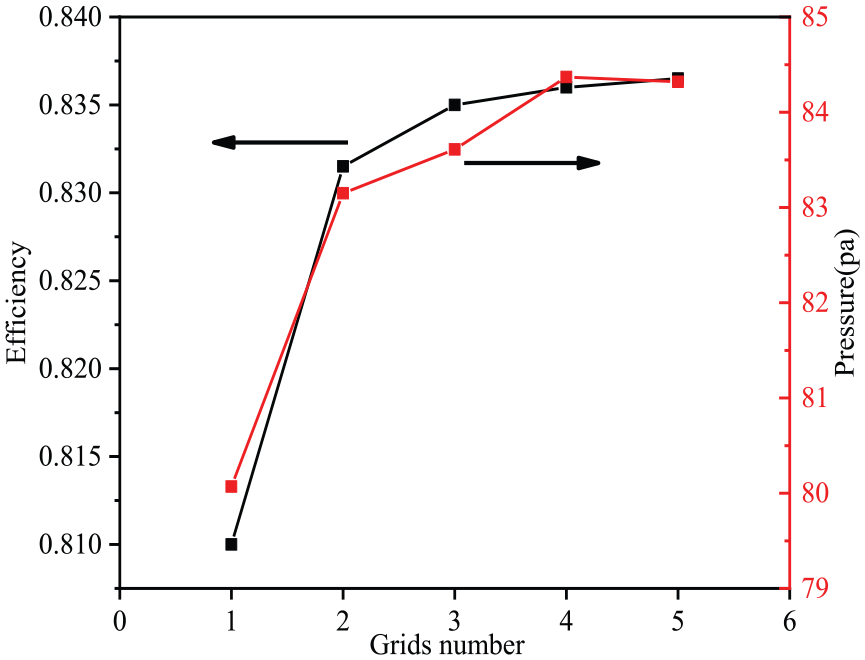
The filtration efficiency and the pressure drop with different number of cells.
Results and discussion
Influence of media structure
In this study, in order to better describe the trend of the analyzed parameters, it is assumed that the inlet velocity and particle diameter change simultaneously in the range of 0.1 to 1 m/s and 1 to 3 µm.
Figure 4 shows the filtration efficiency of fibrous media in different arrangements. The filtration efficiency of different types of fibrous media is different from the deviation presented by the semi-analytical model. As shown in Figure 4, for the “Mesh” and the “Para” types of fibrous media, the numerical distribution of filtration efficiency is on both sides of the semi-analytical model. For the “Nurbs” type, the numerical distribution of filtration efficiency is under the semi-analytical model. Figure 5 shows the comparison of filtration efficiency of different types of fibrous media. It is obvious that the arrangement types of fibrous media have a significant influence on the filtration efficiency, which is not considered by the semi-analytical model. There are mainly three collection mechanisms by which an aerosol flow may be captured by fibrous media including interception, impaction, and diffusion. The diffusion can be ignored because of the particle diameter set in this study (larger than 0.5 µm). As shown in Figures 4 and 5, overall, the filtration efficiency increases with the increase in inlet velocity and particle diameter, which can be explained by the Stokes number. The Stokes number, as a critical parameter to evaluate the impaction mechanism of particles, is proportionate to the inlet velocity and particle diameter.

Different arrangement types of fibrous media: (a) The “Mesh.” (b) The “Para.” (c) The “Nurbs.”

Comparing the efficiency of different arrangement types.
However, as inlet velocity and particle diameter increase, different fibrous media behave differently in some details. Filtration efficiency in Figure 5 can be approximately divided into three parts. The values “1,” “2,” and “3” in Figure 5 represent the initial, middle, and final stages while the Stokes number generally increases. Figures 6–8 show the particles trajectories at different stages, where (a)–(c) and (d)–(f) represent the particles trajectories of outlet and flank, respectively. In the initial stage, the filtration efficiency of “Nurbs” type is less than 0.1 and the filtration efficiency of “Mesh” and “Para” type approach zero for the low Stokes number. The initial stage, as shown in Figure 6, because of the contact radius of particles, is not considered in the CFD (DPM) model, so the numerical results are lower than the semi-analytical model in the initial stage, which the interception is dominant. After that, the filtration efficiency of “Mesh” and “Para” type fibrous media quickly exceeds the “Nurbs” type fibrous media along with the increase in inlet velocity and particle diameter. Increased inlet velocity and particle diameter lead to increased impaction, which promotes filtration efficiency. As shown in Figure 7, the “Mesh” and “Para” types of fibrous media have layered properties and it is obvious that most particles are filtered by layers. As for the “Nurbs” type fibrous media, the excessive overlap of fibers in some locations leads to direct exposure of other parts, which particles can pass directly through these places without capture. It is clearly shown in Figure 7(f) that only a small percentage of particles are captured by fibers. In the final stage, different types of fibrous media show distinct trends with the increase in inlet velocity and particle diameter. For the “Mesh” type fibrous media, the filtration efficiency is almost stable; for the “Para” type, the filtration efficiency is gradually decreasing, and for the “Nurbs” type, the trend is opposite. As shown in Figure 8, in the final stage, the phenomenon of particles flowing around the fibers is significantly less comparing with Figure 6 and Figure 7. For “Para” type fibrous media, as shown in Figure 7(e), part of particles are captured by the back fibers because of drag force. However, the impaction is enough to get rid of the drag force in the final stage, shown in Figure 8(e), which directly causes the back fibers fail to capture particles and ultimately lead to a drop in the filtration efficiency. Figure 9 shows the changes of flow form at different stages of “Para” type. For the “Mesh” type fibrous media, the staggered arrangement plays the role of each fiber as much as possible and the filtration efficiency of “Mesh” type reaches the limit in the final stage. However, the filtration efficiency of “Nurbs” type has not reached the limit due to the structural difference.

Flow field of initial stage. (a)-(c). The outlet view of fibrous media; (d)-(f). The side view of fibrous media.

Flow field of middle stage. (a)-(c). The outlet view of fibrous media; (d)-(f). The side view of fibrous media.

Flow field of final stage. (a)-(c) The outlet view of fibrous media; (d)-(f) The side view of fibrous media.
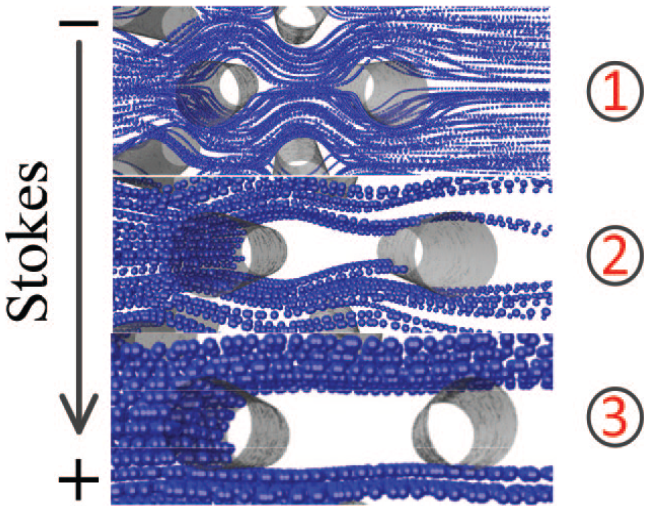
The change of flow field with increasing Stokes number. 1. Low Stokes number; 2. Middle Stokes number; 3. Large Stokes number.
Owing to the neglect of diffusion, the Stokes number can be used to characterize the state of particle flow with the increase in inlet velocity and particle diameter. Figure 10 shows the contour map of error and Stokes number with the change of inlet velocity and particle diameter in different types of fibrous media. As shown in Figure 10, owing to the fact that the DPM model does not include the interception, so the deviation is larger for the low Stokes number. However, the deviation is acceptable when the impaction is dominant for the Stokes number larger than 1. Within the range of inlet velocity and particle diameter set in this study, the area with an error less than 10% is the largest for the “Para” type of fibrous media among three types of fibrous media. For the “Mesh” type fibrous media, the error is smaller than 10% when the Stokes number is larger than 3, while for the “Para” type fibrous media, the Stokes number range from 1.2 to 4.1. Meanwhile, the error is larger than 10% for the “Nurbs” type of fibrous media in the whole Stokes numbers. Overall, the error gradually decreases with the increase in the Stokes number.

The deviation with increasing Stokes number: (a) The “Mesh.” (b) The “Para.” (c) The “Nurbs.”
Figure 11 shows that the pressure drop of fibrous media increases linearly with the increase in inlet velocity in different arrangement types. As can be seen from Figure 11, the deviations of different types of fibrous media are small and the maximum deviation of numerical results and semi-analytical model is about 5.3%. Moreover, it is obvious that the arrangements of fibrous media have no significant effect on the pressure drop.

The pressure drop with the increase in inlet velocity.
Influence of SVFs
Figures 12 and 13 show the filtration efficiency of “Mesh” of type fibrous media in different SVFs. The filtration efficiency of different SVFs is different from the deviation presented by the semi-analytical model. At first, the simulation results are lower than the semi-analytical model, and then gradually become higher than semi-analytical model with the increase in inlet velocity and particle diameter. Obviously, the filtration efficiency increases with increasing SVFs. The foremost reason is that the higher SVFs represents the smaller porosity and more fibers in space.

Different SVFs of fibrous media: (a)SVFs = 14.58%. (b)SVFs = 18.11%. (c) SVFs = 21.91%.

Comparing te efficiency of different SVFs.
Figure 14 shows the contour map of error and Stokes number with the change of inlet velocity and particle diameter in different SVFs. As shown by Figure 14, for the low Stokes number such as 0.64, the deviations of simulation and semi-analytical model are significant. As for the high Stokes number larger than 1.2, the deviations between numerical results and semi-analytical model are obviously reduced under 20%. Regarding the SVFs equal to 18.11% and 21.91%, the deviation between numerical results and semi-analytical model is decreased in the direction of the large Stokes number. However, the SVFs equal to 14.58% shows some difference. The deviation decreases first and then increases when the Stokes number increases. The reason may be that the low SVFs represents the large porosity. So more particles are difficult to be captured and escape directly from the pores. For the SVFs equal to 21.91%, the area is the largest with the deviation less than 10%.

The deviation with increasing Stokes number: (a) SVFs = 14.58%. (b) SVFs = 18.11%. (c) SVFs = 21.91%.
Figure 15 shows that the pressure drop of fibrous media increases linearly with the increase in inlet velocity in different SVFs. According to Darcy’s law, the pressure drop is proportional to the SVFs of fibrous media. Meanwhile, the simulation results have a good consistency with the semi-analytical model and the maximum deviation is about 5.13% for SVFs equal to 21.91%.

The pressure drop with the increase in inlet velocity.
Influence of fiber diameter
Figures 16 and 17 show the filtration efficiency of “Nurbs” type of fibrous media in different fiber diameter. The filtration efficiency of different fiber diameter is different from the deviation presented by the semi-analytical model. As have been discussed in 5.1, the semi-analytical model has the limitation on predicting the filtration efficiency for “Nurbs” type. The numerical distribution of filtration efficiency is under the semi-analytical model. It is obvious that the filtration efficiency decreases in response to the increase in fiber diameter. The reason is that the smaller fiber diameter results in smaller pores of fibrous media.
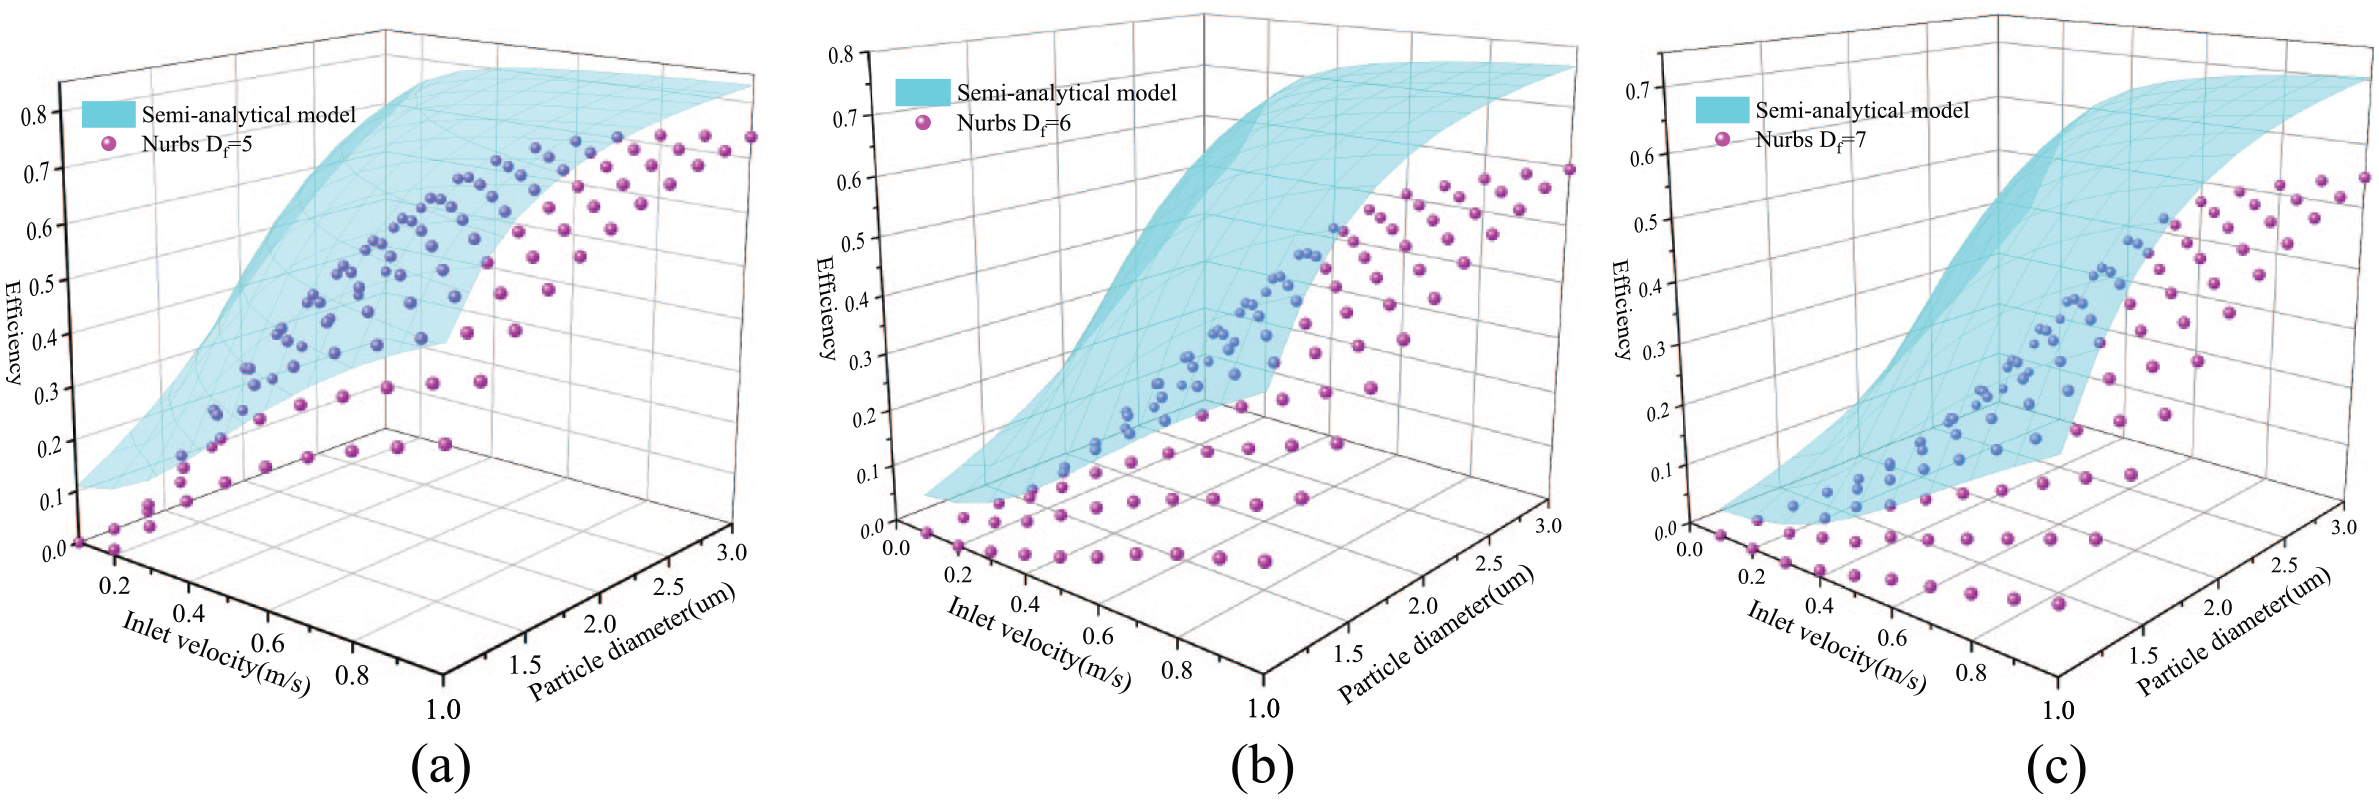
Different fiber diameters of fibrous media: (a) Df = 5 µm. (b) Df = 6 µm. (c) Df = 7 µm.

Comparing the efficiency of different fiber diameters.
Figure 18 shows the contour map of error and Stokes number with the change of inlet velocity and particle diameter in different fiber diameters. As shown by Figure 18, the deviations between numerical results and the semi-analytical model decrease in the direction of the large Stokes number. The deviations of numerical results and semi-analytical model are smaller for the fibrous media with fiber diameter of 5 µm. Moreover, the deviation is smaller than 20% when the Stokes number is larger than 3. However, for the other two situations, the deviation is always larger than 20%. The reason is that for the larger fiber diameter, more particles escape directly without capture.

The deviation with increasing Stokes number: (a) Df = 5 µm. (b) Df = 6 µm. (c) Df = 7 µm.
Figure 19 shows that the pressure drop of fibrous media linearly increases with the increase in inlet velocity in different fiber diameters. As mentioned above, the larger fiber diameter represents larger fiber pores of fibrous media. So the pressure drop decreases with increasing fiber diameter can also be explained by Darcy’s law. Moreover, the maximum deviation is about 5.9% for fiber diameter equal to 7 µm.
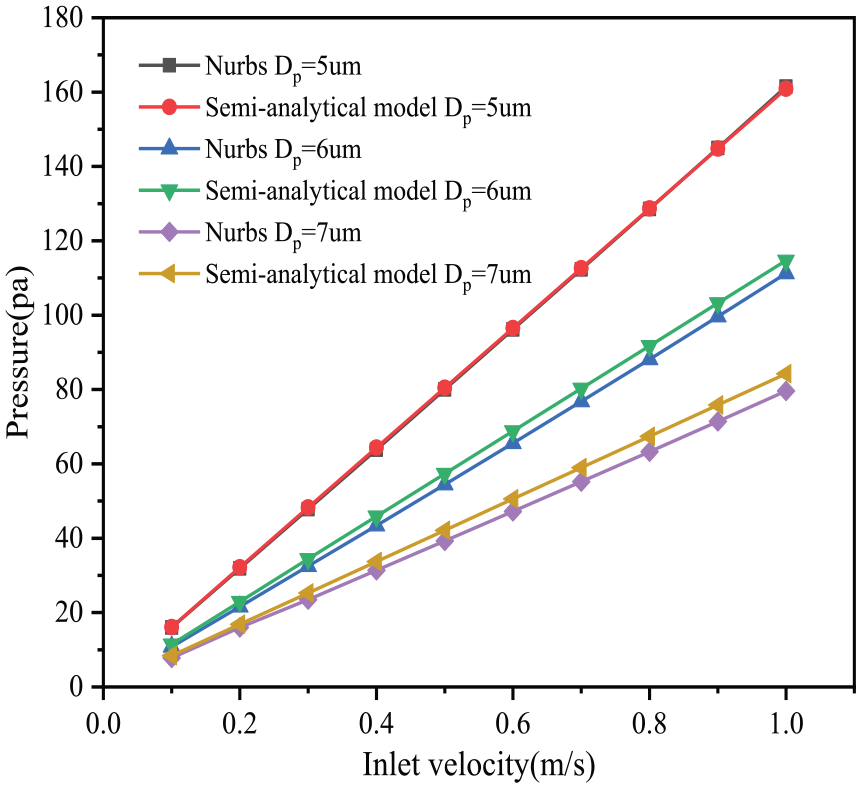
The pressure drop with the increase in inlet velocity.
The quality factor of the fibrous media
It is critical for the quality of the fibrous media to evaluate the filtration efficiency and the pressure drop simultaneously: high-quality fibrous media have high filtration efficiency and low pressure drop. In order to compare the effects of different parameters on the filtration performance, the quality factor is adopted to evaluate the filtration performance in this study. The expression is as follow

Figure 20 shows the quality factor under different structural parameters as the inlet velocity increases. As shown in Figure 20, it is clear that the quality increases first and then decreases with the increase in inlet velocity, apart from the “Nurbs” type fibrous media with fiber diameter of 7 µm. The main reason is that at first, the growth rate of the filtration efficiency is larger than the pressure drop and then, the pressure drop linearly increases with the increase in inlet velocity while the filtration efficiency gradually stabilizes. So there are utmost points in quality factor curve. For the “Mesh” type of fibrous media, an increase in SVFs causing the critical velocity moves from 0.4 to 0.2 m/s. Meanwhile, 0.4 m/s is the turning point of quality for “Mesh” type. When the inlet velocity is lower than 0.4, the higher the SVFs, the larger the quality factor; however, the situation is completely reversed for the inlet velocity larger than 0.4 m/s. Moreover, the arrangement types of fibrous media have little effects on the critical velocity. For the “Nurbs” type fibrous media with same SVFs, the increase in fiber diameter causes the utmost point to move backward. Meanwhile, the utmost quality factor of the fibrous media with fiber diameter of 5 µm is significantly higher than the fiber diameter larger than 5 µm.

The quality factor with the increase in inlet velocity.
Conclusion
Three arrangement types of fibrous media have been established to investigate the effects of structural parameters on the filtration performance. Meanwhile, the DPM model is adopted to track particles trajectories, and the Stokes number has been proposed to judge the error between semi-analytical model and numerical results.
Arrangement types of the fibrous media have significant effects on the filtration efficiency, which shows the limitation of the semi-analytical model. The filtration efficiency of fibrous media increases with increasing inlet velocity, particle diameter, and SVFs, while decreases with increasing fiber diameter. Except for the Stokes number less than 1, the numerical results show good consistency with the semi-analytical model for the “Mesh” and “Para” type fibrous media.
The pressure drop increases with increasing inlet velocity and SVFs, while decreases with increasing fiber diameter. However, arrangement types of fibrous media have little effects on the pressure drop. The simulation results for pressure drop are consistent with the semi-analytical model.
The quality factor shows different characteristic with the increase in inlet velocity. The quality factor increases first and then decreases because the growth rate of filtration efficiency will be exceeded by the pressure drop. Moreover, the arrangements of fibrous media have no effect on critical velocity.
Footnotes
Declaration of conflicting interests
The author(s) declared no potential conflicts of interest with respect to the research, authorship, and/or publication of this article.
Funding
The author(s) received no financial support for the research, authorship, and/or publication of this article.