
Abstract
Objectives:
Place-based disadvantage indices have been used to assess health disparities and allocate funding and health resources. We assessed excess mortality in California during the COVID-19 pandemic by Healthy Places Index (HPI) quartile, a disadvantage index used by the California Department of Public Health to structure COVID-19 response efforts.
Methods:
We estimated expected deaths from all causes during the COVID-19 pandemic by fitting a quasi-Poisson regression model to actual deaths that occurred from 2014 through 2019. We estimated ranges of excess deaths by calculating differences between actual deaths and (1) the average expected number of deaths and (2) the upper bound of the 95% prediction interval. The percentage of excess deaths equaled the number of excess deaths divided by the corresponding threshold. We reported estimates overall and across demographic groups, stratified by HPI quartile; quartile 4 indicated communities with the most advantaged social and environmental conditions.
Results:
From February 2020 through April 2022, the number of excess deaths in California ranged from 81 245 to 107 806, with 93 309 deaths attributed to COVID-19. The number of excess deaths decreased across quartiles, from 27 924 to 35 615 (20.5%-28.0%) in HPI quartile 1 to 7757 to 14 477 (4.6%-9.2%) in HPI quartile 4. The Hispanic or Latine population had a disproportionate percentage of excess deaths across all quartiles, whereas American Indian or Alaska Native, Asian, Black or African American, Native Hawaiian or Pacific Islander, and White (all non-Hispanic) populations had percentage excess death estimates in quartile 2 that were similar to or higher than in quartile 1.
Conclusions:
Health policies should supplement the use of place-based disparity measures with other measures that support groups at high risk for adverse health outcomes residing in more socially and environmentally advantaged communities.
COVID-19 has been a leading cause of death in the United States since 2020, with disproportionate effects among Black, Hispanic, and American Indian or Alaska Native populations and among populations experiencing socioeconomic disadvantages.1,2 To better understand and address the unequal effects of COVID-19, health jurisdictions across the United States have used indices of place-based disadvantage to structure the distribution of COVID-19 vaccine and response efforts. 3 The California Department of Public Health and local health jurisdictions have used the Healthy Places Index (HPI), developed by the Public Health Alliance of Southern California (Public Health Alliance), which considers area-level social determinants of health (eg, per-capita income, percentage of adults aged 18 to 64 years without health insurance) associated with life expectancy at birth. 4 When the COVID-19 vaccine supply was limited, California allocated 2 times more COVID-19 vaccines (40% vs 20%) to populations in zip codes assigned to HPI quartile 1 (less socially and environmentally advantaged communities) than to populations in the remaining 3 HPI quartiles. 5 As the vaccine supply became more readily available, HPI remained a tool used to track vaccination progress and prioritize COVID-19 funding and community outreach.3,5
Although HPI has guided California’s COVID-19 pandemic response, work on applying and validating HPI with respect to infectious diseases, including COVID-19, has been limited. Previous work demonstrated variation in disadvantage profiles across indices and geographic areas, further underscoring the need to evaluate HPI with respect to the disproportionate effects of COVID-19.6-11 Although COVID-19 deaths offer a standardized metric for assessing these effects, errors in cause-of-death reporting on death certificates have been found to not only be common but disproportionately likely in less advantaged (vs more advantaged) areas, contributing to underestimates of disparities.12-14 Excess mortality is a uniquely valuable measure for COVID-19 outcomes because excess mortality accounts for the underascertainment of direct COVID-19 deaths (eg, from misclassification) and indirect deaths (eg, from disruptions to care), as well as baseline risk for mortality. 15
In this study, we used California death records from January 2014 through April 2022 to assess COVID-19 deaths and excess deaths occurring during the COVID-19 pandemic. We then evaluated excess deaths by HPI quartile and at the intersection of HPI quartile and person-level demographic characteristics.
Methods
We obtained data on observed deaths from death registration data maintained by the California Department of Public Health Center for Health Statistics and Informatics. Data from 2014 (the first year all cause-of-death fields became available) through 2020 came from the annual California Comprehensive Master Death Files (static) 16 ; data from January 2021 through April 2022 came from the California Comprehensive Death Files (dynamic). 17 We selected this time frame to capture the excess deaths occurring in California related to COVID-19, from the first COVID-19 deaths in 2020 through the spring 2022 Omicron wave. We classified deaths as associated with COVID-19 if death certificates indicated (by U07.1 18 ) COVID-19 as a cause of death (immediate or underlying).
The Committee for the Protection of Human Subjects for the State of California reviewed the study protocol and materials (no. 2020-163) and determined the study to be not research/exempt under public health practice/surveillance. The California Health and Human Services Agency issued this decision under federal-wide assurance no. 00000681 with the Office of Human Research Protections.
Previous work by Public Health Alliance members has detailed the development of HPI.4,7 Briefly, HPI 3.0 includes 23 indicators sourced from publicly available data (eg, American Community Survey, Comprehensive Housing Assessment System, California Environmental Protection Agency). Indicators span 8 domains: economic, education, social environment, transportation, health care access, neighborhood conditions, housing, and clean environment. The Public Health Alliance extracted and standardized data at the census-tract level; domain weights were then estimated to maximize the association between HPI score and life expectancy at birth. To promote the usability of estimates by the California Department of Public Health, the Public Health Alliance then computed population-weighted allocation of census-tract HPI scores to intersecting zip code tabulation areas and grouped scores into quartiles according to percentile rank (eg, 0th-25th percentiles were assigned quartile 1), where the 100th percentile indicates the most advantaged community conditions. We linked resulting HPI quartile values to death registration data using the decedent’s zip code of residence. We selected zip code as the area level of interest and quartiles as the stratification level of interest, to be consistent with California’s COVID-19 response. Beyond the pandemic response, quartiles are the standard grouping approach for HPI because California departments will often allocate increased investments to the 25% most disadvantaged areas. 19
We ascertained demographic characteristics of age, sex, and race and ethnicity because these characteristics have been previously identified as associated with COVID-19 mortality, 1 are available on the California death certificate, and are not included in the HPI. California death certificates have 3 separate fields to report race, allowing individuals to identify with multiple racial groups (hereinafter, multiracial). Death certificates have a separate field to report Hispanic, Latino, and Spanish origin (hereinafter, Hispanic or Latine). We created a combined race and ethnicity measure by using a mutually exclusive and a nonmutually exclusive approach to categorization. For the mutually exclusive approach, we first categorized people who identified as Hispanic or Latine and then categorized people who identified as non-Hispanic or non-Latine into 1 of the following groups: American Indian or Alaska Native, Asian, Black or African American, Native Hawaiian or Pacific Islander, White, and multiracial. For the nonmutually exclusive approach, we included people who identified as each race, whether alone or in combination with any other race or ethnicity, for each of the following groups: American Indian or Alaska Native, Asian, Black or African American, Native Hawaiian or Pacific Islander, and White. We included nonmutually exclusive groups to acknowledge the general diversity of racial and ethnic groups in California and the unique diversity of American Indian or Alaska Native and Native Hawaiian or Pacific Islander groups, who have a large proportion of people who identify as multiracial and/or Hispanic or Latine.20,21
In accordance with the Centers for Disease Control and Prevention (CDC), we used the Noufaily method (from the “surveillance” R package; R Foundation for Statistical Computing) to estimate the weekly number of expected deaths from February 2020 through April 2022.15,22-24 This approach fit a quasi-Poisson regression model with overdispersion to weekly death counts during a 6-year baseline period (ie, starting in 2014 for 2020 estimates). The algorithm adjusts for trend and seasonality and down-weights the effect of baseline aberrations to fit a more robust excess threshold. In accordance with the CDC approach, we made modifications to the default Noufaily method: (1) we set the threshold for trend to P = .10, (2) we excluded COVID-19 pandemic years (ie, 2020 onward) from the baseline period, and (3) we used the “muan” method to calculate the upper bound of the 95% prediction interval. The muan method, an extension of the original Noufaily method, accounts for both estimation error and prediction error. We estimated a range of excess deaths by calculating the difference between observed deaths and (1) the average expected number of deaths (ie, a less conservative threshold) and (2) the upper bound of the 95% prediction interval (ie, a more conservative threshold), by week and HPI quartile. We set cases where the observed death count fell below the threshold, resulting in a negative value, to zero. We estimated the percentage of excess deaths by calculating the number of excess deaths divided by the corresponding threshold for excess deaths.24,25 Although the raw number of excess deaths provides a sense of absolute scale, percentage of excess deaths, akin to a relative risk or risk ratio, can better facilitate comparisons across groups because it implicitly considers varying population size and age and sex distributions. 25
We calculated weekly deaths, including and excluding deaths attributed to COVID-19, overall and by HPI quartile, and excess deaths (number and percentage), COVID-19 deaths, and the ratio of excess deaths to COVID-19 deaths overall and by selected demographic characteristics and COVID-19 transmission period. When >1, the ratio measure indicates more excess deaths than COVID-19 deaths, whereas when <1, the ratio measure indicates fewer excess deaths than COVID-19 deaths. We also assessed the ratio of excess natural-cause deaths (ie, excluding deaths from intentional or unintentional injury) to COVID-19 deaths and explored the robustness of findings to a shift in baseline period, with baseline years starting in 2015 versus in 2014. Transmission periods were as follows: December 1, 2020, through February 28, 2021 (winter 2020-2021 wave); July 15, 2021, through October 31, 2021 (Delta variant predominance); and December 19, 2021, through March 19, 2022 (Omicron BA.1 variant predominance). 26
Results
From February 1, 2020, through April 2, 2022, 708 911 deaths from all causes occurred in California. For most HPI indicators, the advantage according to HPI scores increased in a stepwise fashion from zip codes captured in quartile 1 (n = 291) to those captured in quartile 4 (n = 376; eTable 1 in the Supplement).
Deaths peaked during the winter 2020-2021 wave and were consistently elevated during periods of Delta and Omicron BA.1 predominance (Figure 1A). Across all HPI quartiles, deaths excluding those attributed to COVID-19 also occasionally exceeded each threshold for the expected number of deaths, in parallel with each COVID-19 transmission period (Figure 1B-E). However, the number of deaths in HPI quartile 4, particularly when deaths attributed to COVID-19 were included, was notably lower than in all other quartiles (and closer to the expected threshold) during each transmission period.
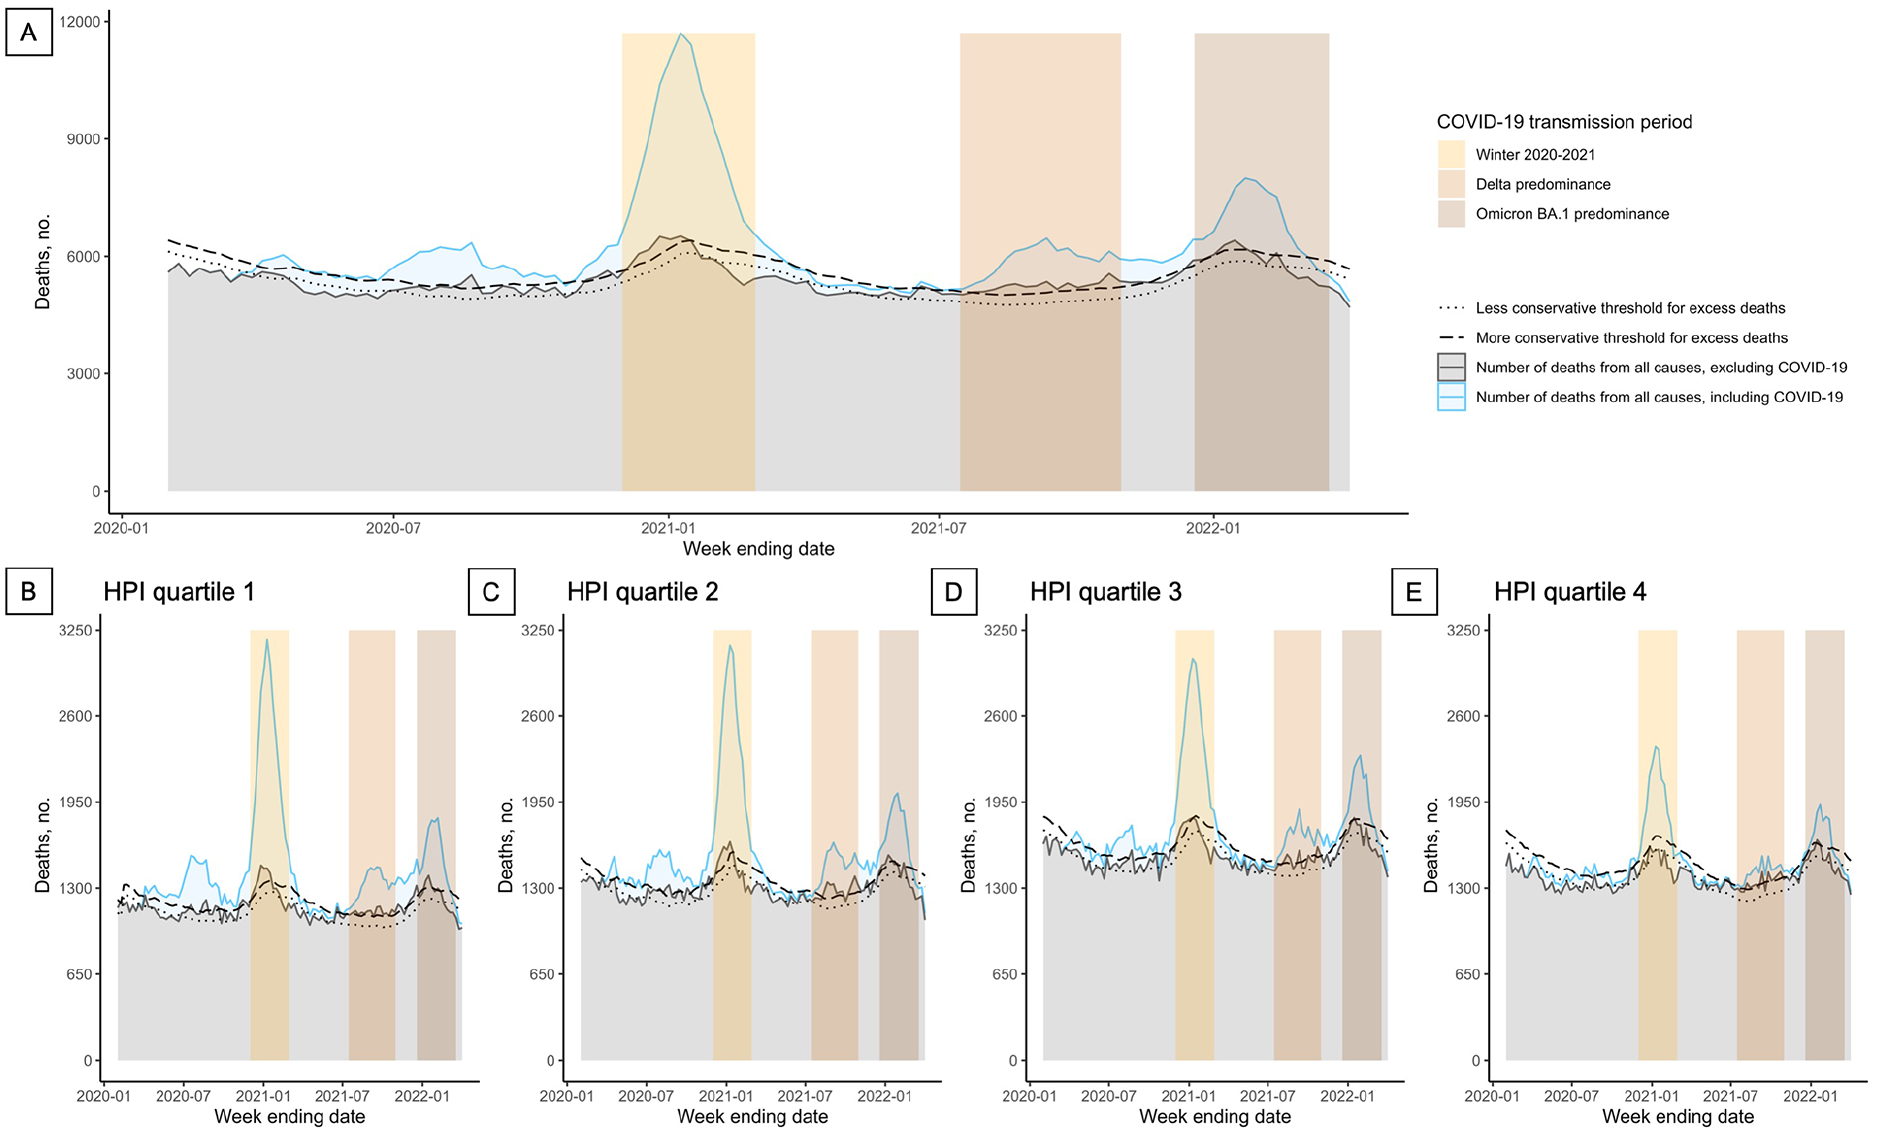
Observed deaths and excess death thresholds overall (A) and among Healthy Places Index (HPI) quartile 1 (B), quartile 2 (C), quartile 3 (D), and quartile 4 (E), California, February 1, 2020–April 2, 2022. The Public Health Alliance ranked scores for zip codes into HPI quartiles, from least advantaged social and environmental community conditions (quartile 1) to most advantaged (quartile 4). 4 Deaths were calculated by week ending date and labeled according to year and month. The winter 2020-2021 wave occurred from December 1, 2020, through February 28, 2021; the period of Delta variant predominance was from July 15, 2021, through October 31, 2021; the period of Omicron BA.1 variant predominance was from December 19, 2021, through March 19, 2022. Data source: Death registration data from the California Department of Public Health Center for Health Statistics and Informatics.16,17
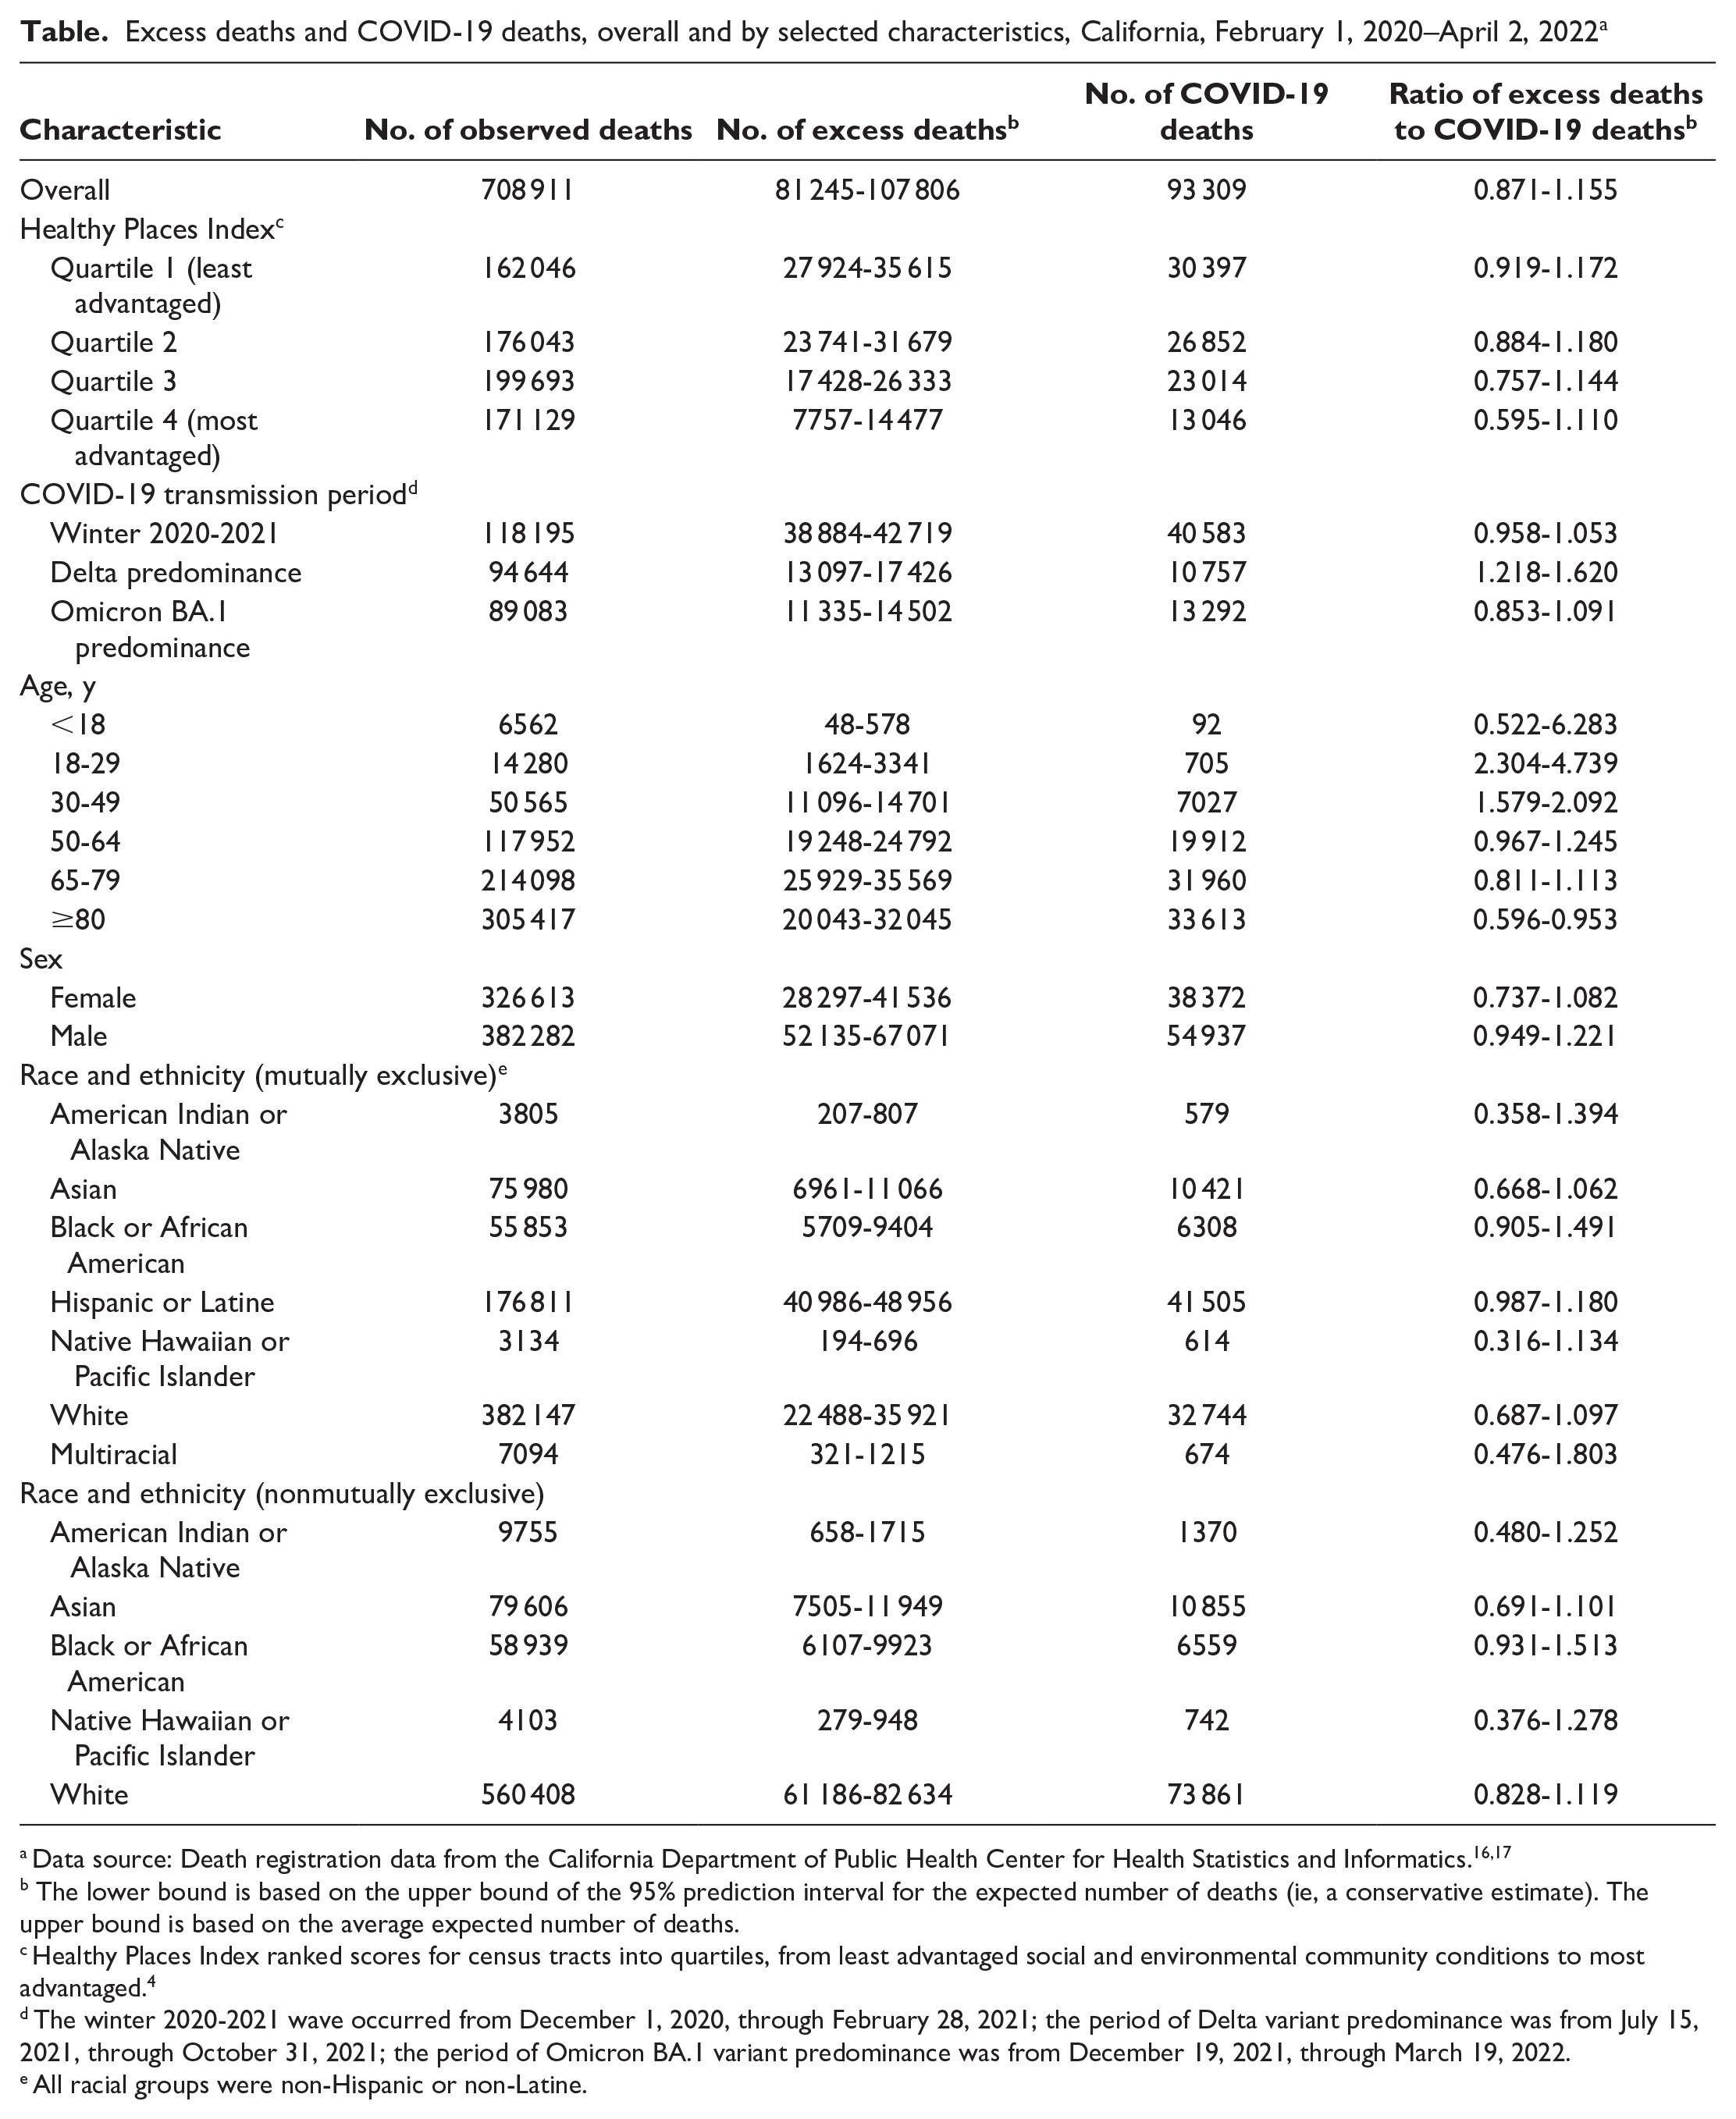
Overall, the 95% prediction interval for excess deaths was 81 245 to 107 806, and 93 309 deaths were directly attributed to COVID-19, indicating a ratio of excess deaths to every 100 COVID-19 deaths of 87.1 to 115.5 (Table). Estimates of the ratio of excess deaths to COVID-19 deaths revealed heterogeneity in the reporting of COVID-19 mortality over time and by HPI quartile, age, and race and ethnicity. The ratio peaked during the period of Delta predominance, when the ratio of excess deaths to every 100 COVID-19 deaths was 121.8 to 162.0. The ratio also decreased across HPI quartiles, although prediction intervals overlapped: 91.9 to 117.2 excess deaths for every 100 COVID-19 deaths were observed in HPI quartile 1, and 59.5 to 111.0 excess deaths for every 100 COVID-19 deaths were observed in HPI quartile 4. Residents aged 18 to 29 years and 30 to 39 years had fewer excess deaths but a higher ratio of excess deaths to COVID-19 deaths than residents aged 50 to 64 years, 65 to 79 years, and ≥80 years. Hispanic or Latine and Black or African American residents also had a higher ratio of excess deaths to COVID-19 deaths than Asian and White residents. Ratios were attenuated, but trends were consistent, when restricted to excess deaths from natural causes (eTable 2 in the Supplement). Omission of 2014 data from the baseline period resulted in a slight increase in estimates of excess deaths (eTable 3 in the Supplement).
Excess deaths and COVID-19 deaths, overall and by selected characteristics, California, February 1, 2020–April 2, 2022 a
Data source: Death registration data from the California Department of Public Health Center for Health Statistics and Informatics.16,17
The lower bound is based on the upper bound of the 95% prediction interval for the expected number of deaths (ie, a conservative estimate). The upper bound is based on the average expected number of deaths.
Healthy Places Index ranked scores for census tracts into quartiles, from least advantaged social and environmental community conditions to most advantaged. 4
The winter 2020-2021 wave occurred from December 1, 2020, through February 28, 2021; the period of Delta variant predominance was from July 15, 2021, through October 31, 2021; the period of Omicron BA.1 variant predominance was from December 19, 2021, through March 19, 2022.
All racial groups were non-Hispanic or non-Latine.
The percentage of excess deaths ranged from 20.5% to 28.0% in HPI quartile 1 to 4.6% to 9.2% in HPI quartile 4 (Figure 2; eFigure in the Supplement). Disparities by HPI quartile narrowed across COVID-19 transmission periods but endured despite vaccine availability (percentage of excess deaths in quartile 1 vs quartile 4: winter 2020-2021, 77.5%-89.5% vs 20.4%-27.5%; Delta, 21.9%-31.3% vs 7.1%-15.1%; and Omicron, 19.7%-27.4% vs 6.3%-11.6%). The percentage of excess deaths also varied by age, sex, and race and ethnicity across quartiles. For most demographic groups, the percentage of excess deaths decreased from HPI quartile 1 to quartile 4; however, we did not observe this trend for all racial and ethnic groups. For American Indian or Alaska Native, Asian, Black or African American, and White mutually exclusive groups, a greater or similar percentage of excess mortality occurred in HPI quartile 2 than in quartile 1; for the Native Hawaiian or Pacific Islander population, a similar percentage of excess mortality occurred across all quartiles. Trends across HPI quartiles for the Hispanic or Latine population mirrored overall trends, with the number of excess deaths and the percentage of excess deaths decreasing from quartile 1 to quartile 4. However, the number and percentage of excess deaths were also elevated across all quartiles; even in quartile 3, the number and percentage of excess deaths for the Hispanic or Latine population exceeded the number and percentage of excess deaths for most other groups in quartile 1 and quartile 2 (particularly when referencing the more conservative threshold; eFigure in the Supplement).
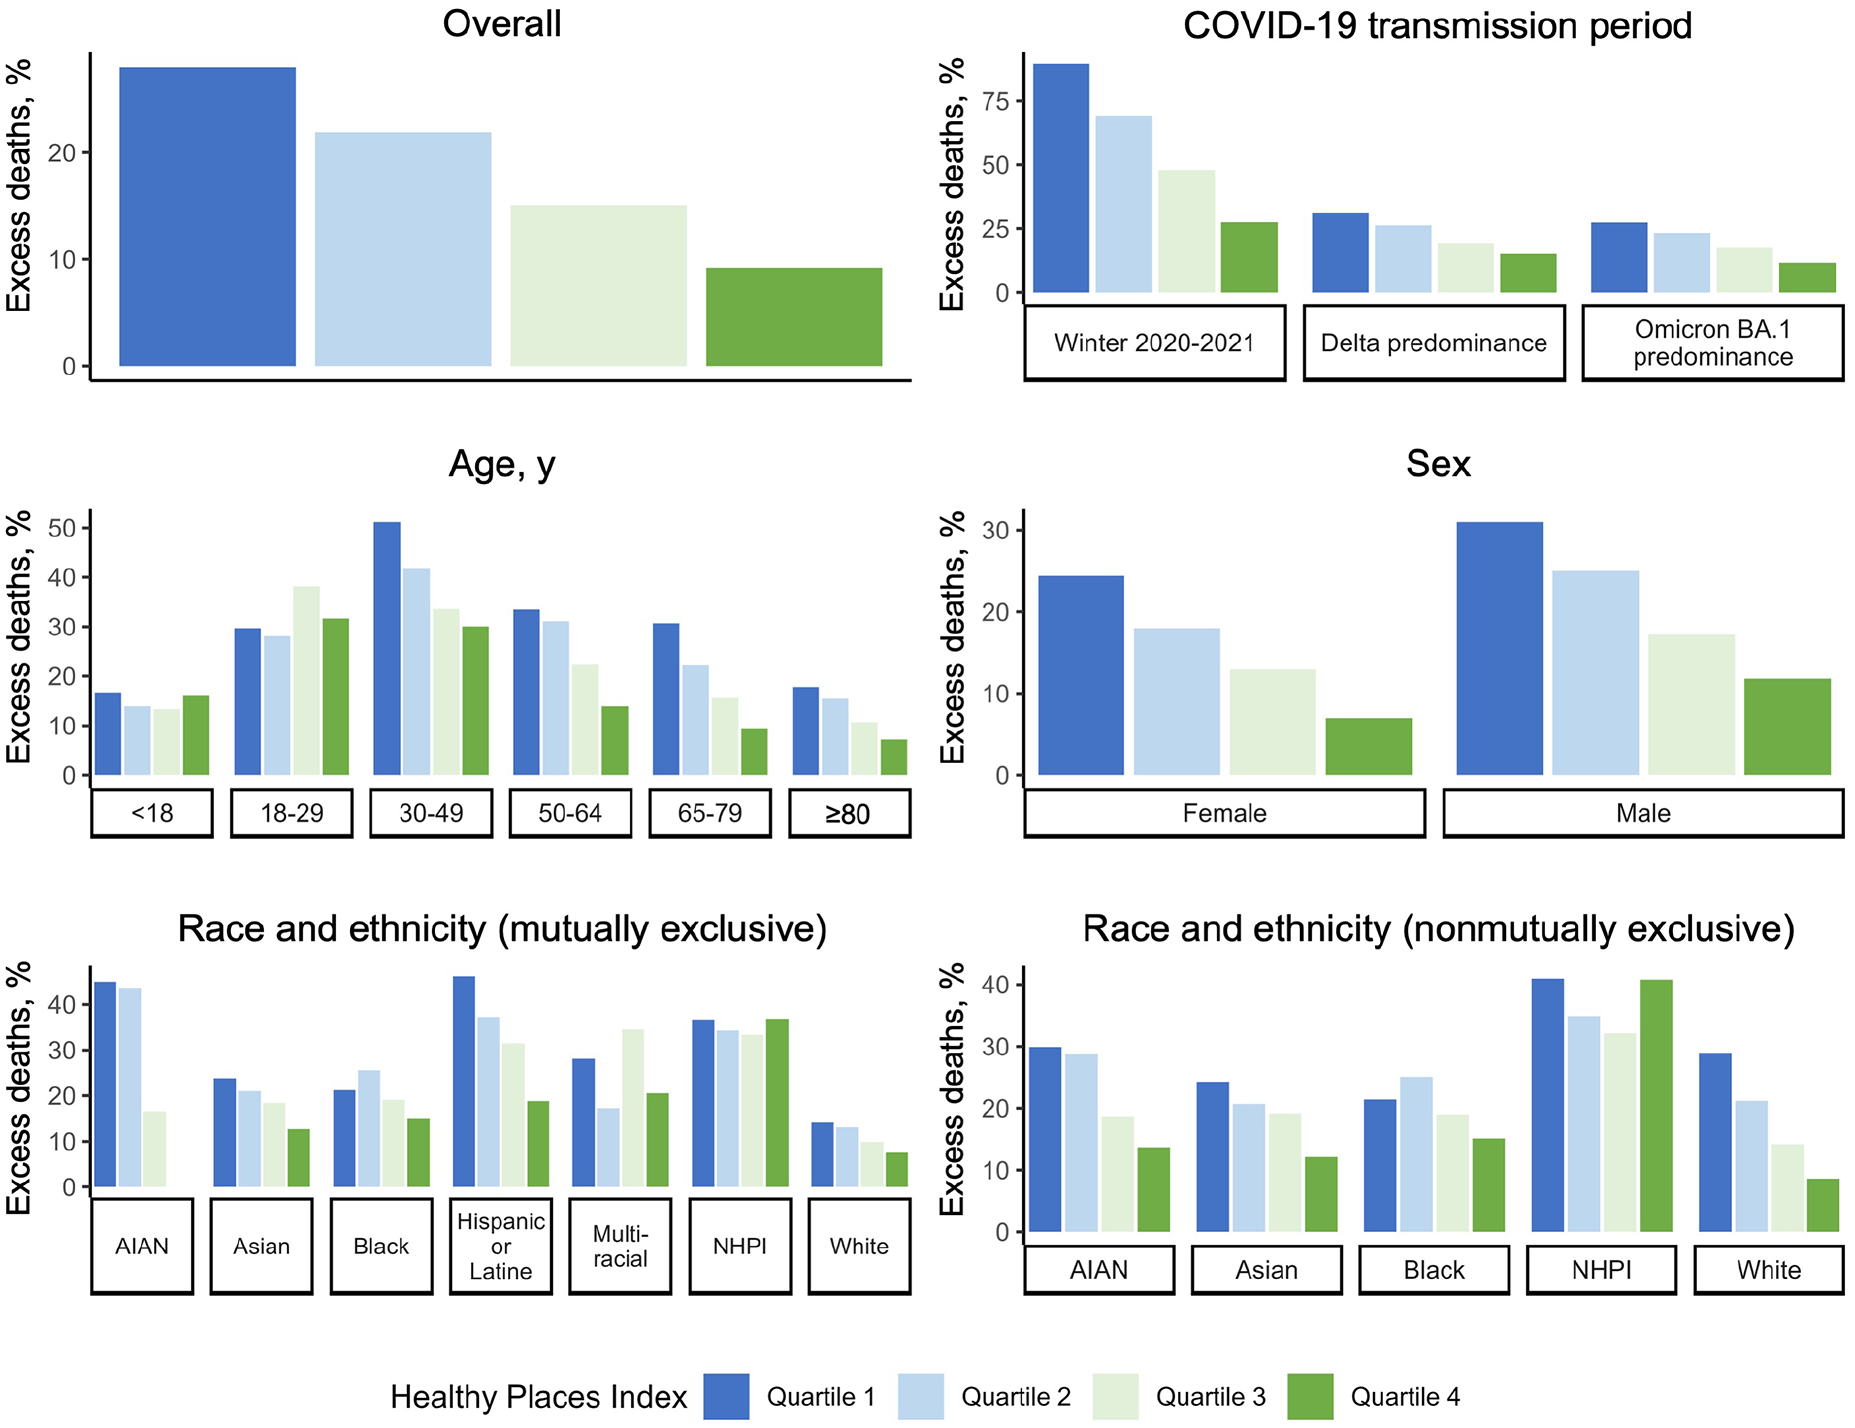
Percentage of excess deaths in California based on the average expected number of deaths (ie, a less conservative threshold), by subgroup and Healthy Places Index quartile, February 1, 2020–April 2, 2022. The Public Health Alliance ranked scores for zip codes into quartiles, from least advantaged social and environmental community conditions (quartile 1) to most advantaged (quartile 4). 4 The winter 2020-2021 wave occurred from December 1, 2020, through February 28, 2021; the period of Delta variant predominance was from July 15, 2021, through October 31, 2021; the period of Omicron BA.1 variant predominance was from December 19, 2021, through March 19, 2022.
Discussion
Estimates of excess mortality in California from February 2020 through April 2022 revealed persistent disparities in the effects of COVID-19 across HPI quartiles. Excess mortality among the Hispanic or Latine population appeared to drive overall trends by HPI, decreasing from quartile 1 to quartile 4; however, the Hispanic or Latine population had disproportionate excess mortality across all quartiles. For several other racial and ethnic groups, particularly for the Native Hawaiian or Pacific Islander population, zip code–based HPI quartiles did not appear to correspond as well with risk for excess mortality during the COVID-19 pandemic. These findings point to heterogeneous experiences for different groups within HPI quartiles.
Overall trends in excess deaths across HPI quartiles were consistent with previous work that showed that indices of population-level social disadvantage, including the Social Vulnerability Index, the Area Deprivation Index, the COVID-19 Community Vulnerability Index, and the Minority Health–Social Vulnerability Index, were associated with COVID-19 mortality.27,28 However, by applying an intersectional approach, we also elucidated the variation in risk that occurs within each HPI quartile, particularly at the intersection of place and race and ethnicity. This finding complements previous work that highlighted the underrepresentation of Native Hawaiian or Pacific Islander residents in HPI quartile 1 and the varying rates of hospitalization related to COVID-19 for Hispanic, non-Hispanic Black, and non-Hispanic White veterans across HPI quartiles.8,29 Together, this work and previous studies underscore the importance of considering communities with a high incidence or prevalence of adverse outcomes outside census tracts or zip codes designated as the least advantaged per HPI.
Several previous studies showed that a large proportion of excess deaths not attributed to COVID-19 were unrecognized COVID-19 deaths, corroborating the theory that excess deaths largely reflect underascertainment of direct COVID-19 deaths.30-32 Crude temporal trends in our study offered further support for this theory, with deaths excluding COVID-19 occurring in parallel with COVID-19 deaths rather than at a delay (as would be expected if deaths followed access-to-care issues related to a COVID-19 surge). Estimates of the ratio of excess deaths to COVID-19 deaths also suggested that underascertainment of COVID-19 deaths was more likely to occur in less advantaged areas and during the period of Delta predominance compared with the winter 2020-2021 wave, in parallel with recent work that demonstrated that reporting gaps were not limited to the early pandemic period.12,30 Because the medical death investigation system in California is not centralized but rather is county based, for which professionals as disparate as sheriffs, funeral home directors, and medical professionals serve as certified death investigators, disparities in county resources potentially contributed to variation in ascertainment. 13 The exploration of trends by individual demographic characteristics elucidated further heterogeneity: even when restricted to excess natural-cause deaths, unrecognized COVID-19 deaths appeared relatively more likely among residents aged 18 to 29 years and aged 30 to 49 years, and estimates by race and ethnicity suggested racial disparities in COVID-19 mortality were potentially greater than recognized. 12 Findings could be driven by differences in available medical history and COVID-19 testing by age and race and ethnicity.30,33,34 Our results ultimately provide grist for calculating excess deaths versus reporting only COVID-19 deaths.
This study benefited from more than 8 years of death certificate data to derive comprehensive estimates of direct and indirect mortality from COVID-19 across California. In addition, we used racial disaggregation methods that allowed excess deaths to be estimated among a representative population of single-race and multiracial American Indian or Alaska Native and Native Hawaiian or Pacific Islander residents in the state. Such methods align with direct calls for disaggregation from advocacy groups, who have identified widespread data erasure in the reporting of COVID-19 deaths among American Indian or Alaska Native people 35 as well as 2024 Office of Management and Budget standards for presenting data on race and ethnicity. 36 However, because of a lack of zip code–level population estimates for nonmutually exclusive racial and ethnic groups, we were precluded from estimating corresponding excess mortality rates.
Limitations
Our study had a few limitations. First, race and ethnicity reporting on the death certificate is subject to misclassification, particularly for the American Indian or Alaska Native population 37 ; therefore, estimates may still underestimate COVID-19 deaths. In addition, for smaller demographic groups, the ranges of excess mortality were quite wide, reflecting greater uncertainty. Finally, although calculation of the percentage of excess deaths does implicitly account for baseline differences in the population, this approach assumes that population characteristics would have followed the same trajectory throughout the pandemic.
While not an inherent study limitation, given that other indices of social disadvantage rely on different variables and weighting approaches,10,11 other indices may not replicate differences in risk for excess mortality at the intersection of place and race and ethnicity. HPI was uniquely designed to be associated with life expectancy at birth; in contrast, the Social Vulnerability Index includes variables such as population aged >65 years, disability, and racial and ethnic minority status, which might result in more consistent capture of risk by quartile. 4 Area-level occupational characteristics (eg, predominant industry, class of worker) are also relevant for spatial patterning of excess mortality and are not currently included in the HPI. Similarly, patterns might vary at different index stratification levels (eg, tertiles, quintiles) and area levels (eg, census tract).
Conclusions
California communities classified as socially and economically disadvantaged per the HPI experienced disproportionate excess mortality throughout the COVID-19 pandemic and a likely greater number of deaths attributed to COVID-19 than captured by official estimates. HPI and other indices of population-level disadvantage can be valuable tools for assisting public health officials in identifying geographic areas to provide additional resources.10,38,39 However, general measures of social advantage and disadvantage do not always capture specific political or ecological factors that affect community vulnerability. 10 Health policies should supplement the use of place-based disparity measures with other measures to support groups experiencing disproportionate adverse effects that may otherwise be overlooked because of residing in more advantaged communities.
Supplemental Material
sj-docx-1-phr-10.1177_00333549251314409 – Supplemental material for Excess Deaths in California During the COVID-19 Pandemic, by Healthy Places Index Quartile, February 2020–April 2022
Supplemental material, sj-docx-1-phr-10.1177_00333549251314409 for Excess Deaths in California During the COVID-19 Pandemic, by Healthy Places Index Quartile, February 2020–April 2022 by Celeste J. Romano, Tiffany N. Tsukuda, Rui Zhao, Joshua Quint, Seema Jain and Erin L. Murray in Public Health Reports
Footnotes
Declaration of Conflicting Interests
The authors declared no potential conflicts of interest with respect to the research, authorship, and/or publication of this article.
Funding
The authors received no financial support for the research, authorship, and/or publication of this article.
Supplemental Material
Supplemental material for this article is available online. The authors have provided these supplemental materials to give readers additional information about their work. These materials have not been edited or formatted by Public Health Reports’s scientific editors and, thus, may not conform to the guidelines of the AMA Manual of Style, 11th Edition.
References
Supplementary Material
Please find the following supplemental material available below.
For Open Access articles published under a Creative Commons License, all supplemental material carries the same license as the article it is associated with.
For non-Open Access articles published, all supplemental material carries a non-exclusive license, and permission requests for re-use of supplemental material or any part of supplemental material shall be sent directly to the copyright owner as specified in the copyright notice associated with the article.