
Abstract
Objectives:
Disaggregated data on Asian ethnic groups are needed to identify health disparities among Asian people. We examined COVID-19 incidence, deaths, and vaccinations among Asian ethnic groups in Santa Clara County, California.
Methods:
We extracted data on SARS-CoV-2 infections and COVID-19 vaccinations from December 15, 2020, through August 6, 2021, from the California Reportable Diseases Information Exchange and the California Immunization Registry. We assigned Asian ethnic group based on name for missing self-reported information. We calculated age-adjusted rates and rate ratios of infections and deaths and percentages of vaccinations by race and ethnicity and Asian ethnic group. We conducted multivariable logistic regression to examine factors associated with COVID-19 deaths.
Results:
Although Asian residents had the lowest rate of SARS-CoV-2 infections per 100 000 people (1801.9; 95% CI, 1771.5-1832.7) among all racial and ethnic groups, when disaggregated by Asian ethnicity, Filipino (3169.0; 95% CI, 3049.1-3292.4) and Vietnamese (3008.4; 95% CI, 2916.9-3102.1) residents had the highest age-adjusted rates. Asian (38.7; 95% CI, 33.7-44.3) and non-Hispanic White (42.3; 95% CI, 37.5-47.5) residents had the lowest rate of COVID-19 deaths compared with all other racial and ethnic groups; however, Filipino (67.6; 95% CI, 49.1-90.8) and Vietnamese (63.7; 97% CI, 48.9-81.6) residents had significantly higher rates than the aforementioned groups did. Among all racial and ethnic groups, Asian residents had the highest completion rate of primary COVID-19 vaccine series by August 6, 2021 (87.0%; 95% CI, 86.8%-87.3%). Within Asian ethnic groups, Filipino residents had the lowest vaccination rate (65.0%; 95% CI, 64.4%-65.6%).
Conclusions:
Differences in COVID-19 incidence, deaths, and vaccinations among Asian ethnic groups highlight the importance of data collection of ethnic groups as a standard practice.
Racial and ethnic minority groups in the United States have been disproportionately affected by the COVID-19 pandemic. Non-Hispanic Black or African American (hereinafter, Black), Hispanic or Latino, and non-Hispanic American Indian or Alaska Native people have had higher rates of COVID-19 hospitalization and deaths than non-Hispanic White (hereinafter, White) people did. Non-Hispanic Asian (hereinafter, Asian) people have health outcomes that are comparable with those of White people.1-3 In previous studies, COVID-19 test positivity, hospitalization, and mortality rates varied by Asian ethnic group; however, these studies were limited to health care systems and thus may not represent the general population.4,5 Another study showed that loss of life expectancy was higher among Asian people than among White people during the COVID-19 pandemic; the loss of life expectancy among Filipino men was the same rate as among Black and Hispanic or Latino men. 6 Racial and ethnic differences in COVID-19 vaccination also exist; Black and Hispanic or Latino people are less likely to start or complete vaccinations than White people are, whereas Asian people have the highest vaccination rate among all racial and ethnic groups. 7 To our knowledge, no studies have examined vaccine uptake among Asian ethnic groups, although differences in perceived vaccine risks and vaccine acceptance have been reported.8,9 Understanding the number of SARS-CoV-2 infections, number of COVID-19 deaths, and COVID-19 vaccination rates among Asian ethnic groups is crucial to the development of tailored prevention strategies and to ensure equitable health care access. Data on race and ethnicity are rarely disaggregated by ethnic subgroup in public health data systems, but disaggregating data by ethnic subgroup is critical given the differing social determinants of health (SDOH) driving health patterns and outcomes by Asian ethnicity.
Many COVID-19 outcomes have been associated with SDOH.1,10 For example, low levels of education, poverty, poor housing conditions, low household income, and multigenerational housing have been linked to increased COVID-19 diagnosis and death. 10 Disaggregated data by Asian ethnic group have revealed that SDOH vary widely within the Asian population. Of 1.9 million residents in Santa Clara County, California, more than one-third are Asian or Pacific Islander. 11 In Santa Clara County, Asian residents appear to have more SDOH-related advantages overall than residents from other racial and ethnic groups do; however, disaggregation by Asian ethnic groups has shown considerable disparities in SDOH in this population. For example, 62% of Asian residents and 48% of county residents have a bachelor’s degree or higher, whereas these percentages range from 30% among Vietnamese to 88% among Asian Indian residents. About one-quarter (27%) of all households and 22% of Asian households in Santa Clara County earn <$50 000 annually; however, such percentages range from 8% among Asian Indian to 18% among Filipino and 37% among Vietnamese households. Other SDOH, including housing conditions and employment, show similar patterns, with variability among Asian ethnic groups. 11
In this study, we retrospectively analyzed infectious disease surveillance, death, and immunization registry data on COVID-19 among Asian ethnic groups. We compared SARS-CoV-2 infections, COVID-19 deaths, and COVID-19 vaccination rates among the 6 largest Asian ethnic groups in Santa Clara County (Asian Indian, Chinese, Japanese, Korean, Filipino, and Vietnamese) with rates among other racial and ethnic groups.
Methods
We extracted data on laboratory-confirmed SARS-CoV-2 infection, COVID-19 vaccination, first and last names, age, sex, and race and ethnicity for residents of Santa Clara County from the California Reportable Diseases Information Exchange (CalREDIE) 12 and the California Immunization Registry (CAIR2). 13 We obtained information on Asian ethnic group from CalREDIE and collected no Asian ethnic group information from CAIR2. We extracted data from December 15, 2020, through August 6, 2021, the period from when the COVID-19 vaccine first became available to when the Omicron variant appeared. We ascertained data on COVID-19 deaths using the California Integrated Vital Records System. 14
We defined a COVID-19 case as a resident with laboratory-confirmed SARS-CoV-2 infection. For missing information on Asian ethnic group, we used the North American Association of Central Cancer Registries Asian Pacific Islander Identification Algorithm (NAPIIA) to refine Asian and Pacific Islander residents into specific ethnic groups based on first and last names.15,16 We classified Asian residents into 8 groups: Asian Indian, Chinese, Japanese, Korean, Filipino, Vietnamese, Asian other, and Asian group unknown. We assessed the performance of the algorithm (eSupplement). For analyses of COVID-19 cases and deaths, we included sex, age, long-term care facility (LTCF) residency, vaccination status, and census tract–level SDOH. Because of missing individual-level SDOH in surveillance datasets, we matched COVID-19 cases with Healthy Places Index 3.0 (HPI) to obtain census tract–level SDOH scores for cases. The HPI, a composite score that measures neighborhood health, includes 23 indicators of SDOH across economic, education, housing, health care access, neighborhood, clean environment, social environment, and transportation domains. 17 HPI ranks scores for census tracts into quartiles, from least healthy to most healthy.
We determined vaccination status of COVID-19 cases by matching CalREDIE and CAIR2 records using name, date of birth, and residential address. We defined a COVID-19 case as fully vaccinated if the resident had a positive nucleic acid amplification test on or 14 days after the resident received the 1-dose Janssen-Ad26.COV2-S vaccine or the second dose of the 2-dose Moderna-Spikevax or Pfizer–BioNTech-Comirnaty vaccine. We defined a COVID-19 case as partially vaccinated if the case had a positive test result within 14 days after the case completed the 1-dose vaccine or was between doses for the 2-dose vaccine. We defined COVID-19 death as a resident with COVID-19 or an equivalent term, such as coronavirus, listed as the cause of death on the death certificate, with exclusion of human coronavirus HKU1. We defined a resident with completion of COVID-19 vaccine primary series if the resident had received the 1-dose Janssen-Ad26.COV2-S vaccine or 2 doses of the 2-dose Moderna-Spikevax or Pfizer–BioNTech-Comirnaty vaccine.
We expressed demographic characteristics of COVID-19 cases as counts and percentages. We compared demographic characteristics among COVID-19 cases by using the Pearson χ2 test. We calculated age-adjusted rates (all ages) and age-specific rates (18-34, 35-64, and ≥65) of COVID-19 cases and COVID-19 deaths and the percentage of county residents who completed primary vaccination series by racial and ethnic group. We determined age-specific rates by using the 2017-2021 American Community Survey 5-year estimates and age-adjusted rates by using standard population data from US Census 2000.18,19 We estimated standardized and unstandardized rate ratios (RRs) for overall racial and ethnic groups and for Asian ethnic groups, with White as the reference group. We used bivariable and multivariable logistic regression models to estimate the association between COVID-19 death and sex, age, race and ethnicity (including Asian ethnic group), COVID-19 vaccination status, LTCF residency, and HPI quartile. We presented adjusted odds ratios (AORs) in the final model.
We used R version 4.0.5 (R Foundation for Statistical Computing) for statistical analyses. We considered P < .05 to be significant.
The institutional review board (IRB) for Santa Clara County Health Services determined the study as exempt from review because the study used existing public health surveillance datasets (IRB No. 23-4).
Results
During the study period, 72 392 county residents were determined to be COVID-19 cases and 840 died of COVID-19. More than 80% of deaths occurred before February 15, 2021. In addition, 1.3 million residents aged ≥18 (89.6%) received ≥1 dose of COVID-19 vaccine, and 1.2 million residents (84.2%) completed the primary series. Notably, <25% of county residents received a COVID-19 vaccine before February 15, 2021. Asian residents represented 18.7% of COVID-19 cases and 39.5% of county residents who were vaccinated.
Of COVID-19 cases among Asian residents who had missing information on ethnic group, 63.6% (3577 of 5625) were assigned ethnicity with NAPIIA. With NAPIIA, information on Asian ethnic group increased from 58% to 85% for COVID-19 cases and from 0% to 80% for having COVID-19 vaccination.
Of 72 392 COVID-19 cases, 46.2% (n = 33 415) were among Hispanic or Latino residents, 41.8% (n = 30 256) were among residents aged 35-64, and 39.6% (n = 28 674) were among residents of the least healthy neighborhood per HPI quartile (Table 1). Among Asian ethnic groups, most COVID-19 cases were among Asian Indian, Filipino, and Vietnamese residents. Most COVID-19 deaths were among residents aged ≥65 (vs. other age groups); White, Hispanic or Latino, and Asian residents (vs. other racial and ethnic groups); Vietnamese, Filipino, and Chinese residents (vs. other Asian ethnic groups); and unvaccinated residents (vs. vaccinated residents). Nearly 1 in 4 COVID-19 deaths (39.2%) occurred among LTCF residents, although LTCF residents represented only 2.3% of total COVID-19 cases.
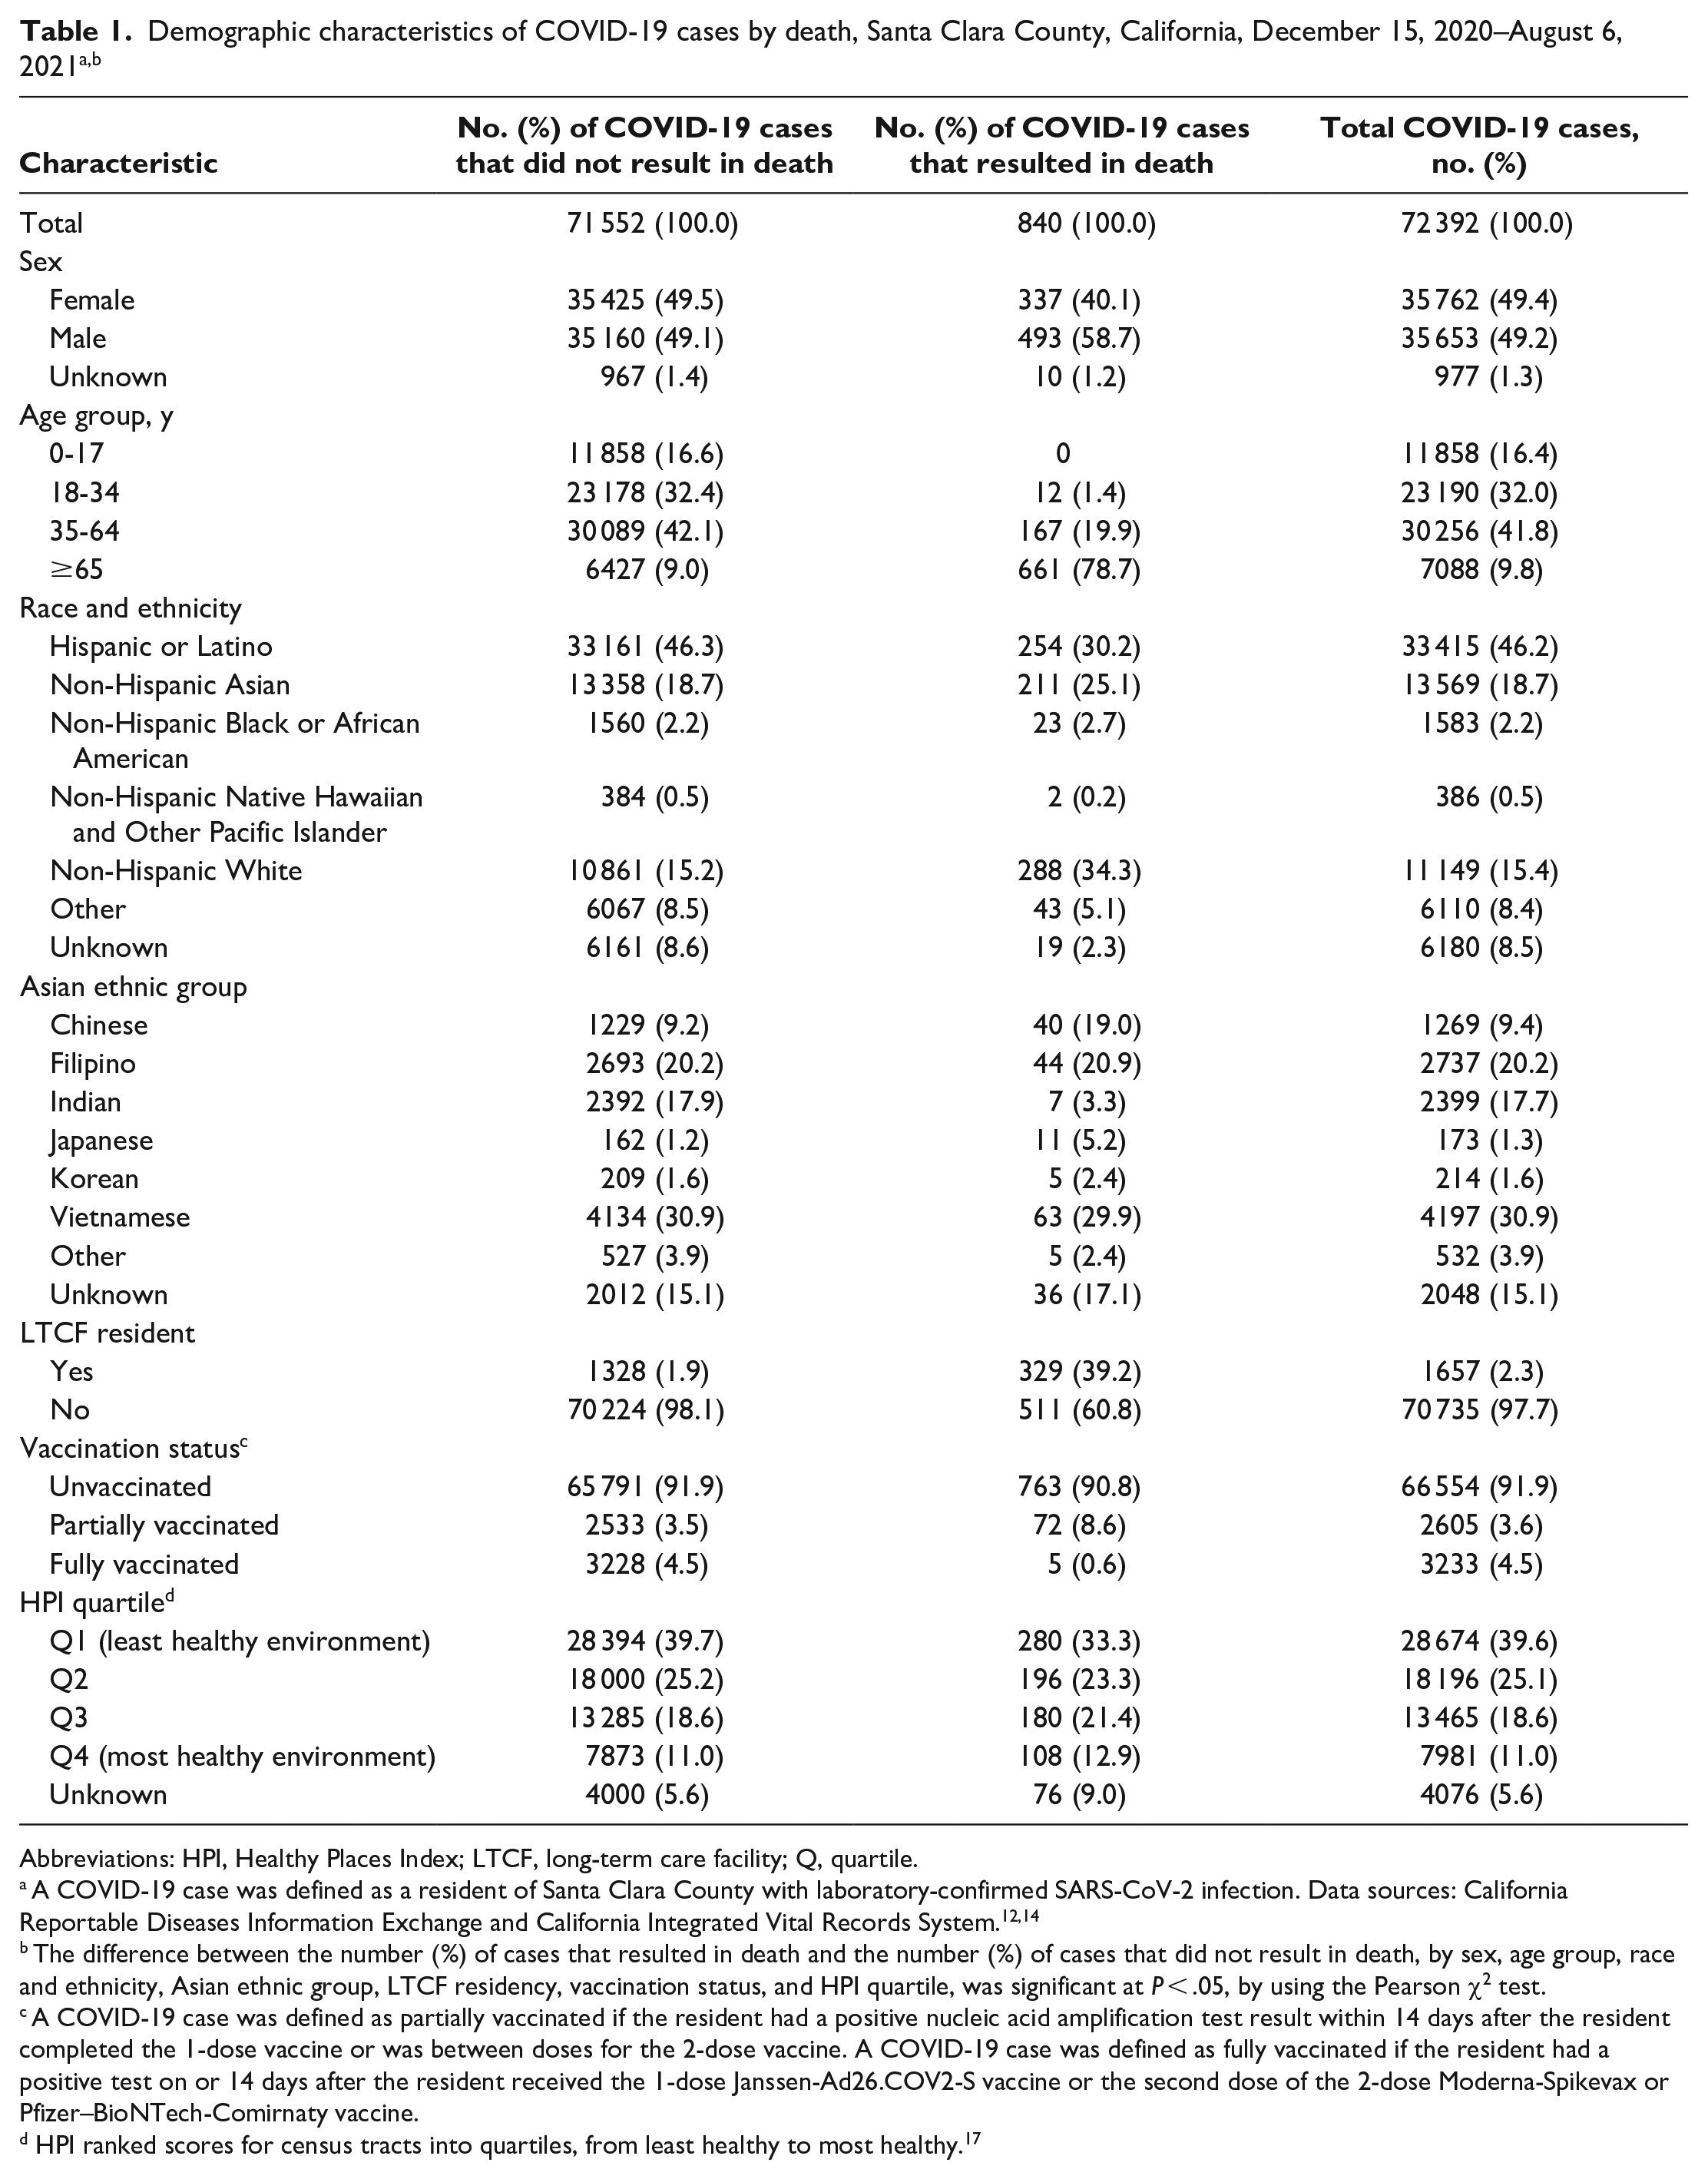
Abbreviations: HPI, Healthy Places Index; LTCF, long-term care facility; Q, quartile.
A COVID-19 case was defined as a resident of Santa Clara County with laboratory-confirmed SARS-CoV-2 infection. Data sources: California Reportable Diseases Information Exchange and California Integrated Vital Records System.12,14
The difference between the number (%) of cases that resulted in death and the number (%) of cases that did not result in death, by sex, age group, race and ethnicity, Asian ethnic group, LTCF residency, vaccination status, and HPI quartile, was significant at P < .05, by using the Pearson χ2 test.
A COVID-19 case was defined as partially vaccinated if the resident had a positive nucleic acid amplification test result within 14 days after the resident completed the 1-dose vaccine or was between doses for the 2-dose vaccine. A COVID-19 case was defined as fully vaccinated if the resident had a positive test on or 14 days after the resident received the 1-dose Janssen-Ad26.COV2-S vaccine or the second dose of the 2-dose Moderna-Spikevax or Pfizer–BioNTech-Comirnaty vaccine.
HPI ranked scores for census tracts into quartiles, from least healthy to most healthy. 17
Among all racial and ethnic groups, Hispanic or Latino residents had the highest age-adjusted rate of COVID-19 per 100 000 people (6832.0; 95% CI, 6757.6-6907.0), followed by Black residents (3380.1; 95% CI, 3213.5-3553.0). Asian residents had the lowest age-adjusted rate of COVID-19 (1801.9 [95% CI, 1771.5-1832.7] vs. 1932.8 [95% CI, 1895.4-1970.8] among White residents) (Table 2). However, when examined by Asian ethnic group, age-adjusted rates of COVID-19 were significantly higher among Filipino (3169.0; 95% CI, 3049.1-3292.4) and Vietnamese (3008.4; 95% CI, 2916.9-3102.1) residents than among White residents, whereas Japanese (693.1; 95% CI, 581.7-819.6), Korean (653.1; 95% CI, 567.1-748.5), and Chinese (604.6; 95% CI, 571.3-639.2) residents had significantly lower rates of COVID-19 than White residents did (P < .001).
Rates and rate ratios of COVID-19 cases, by age and race and ethnicity, Santa Clara County, California, December 15, 2020–August 6, 2021 a
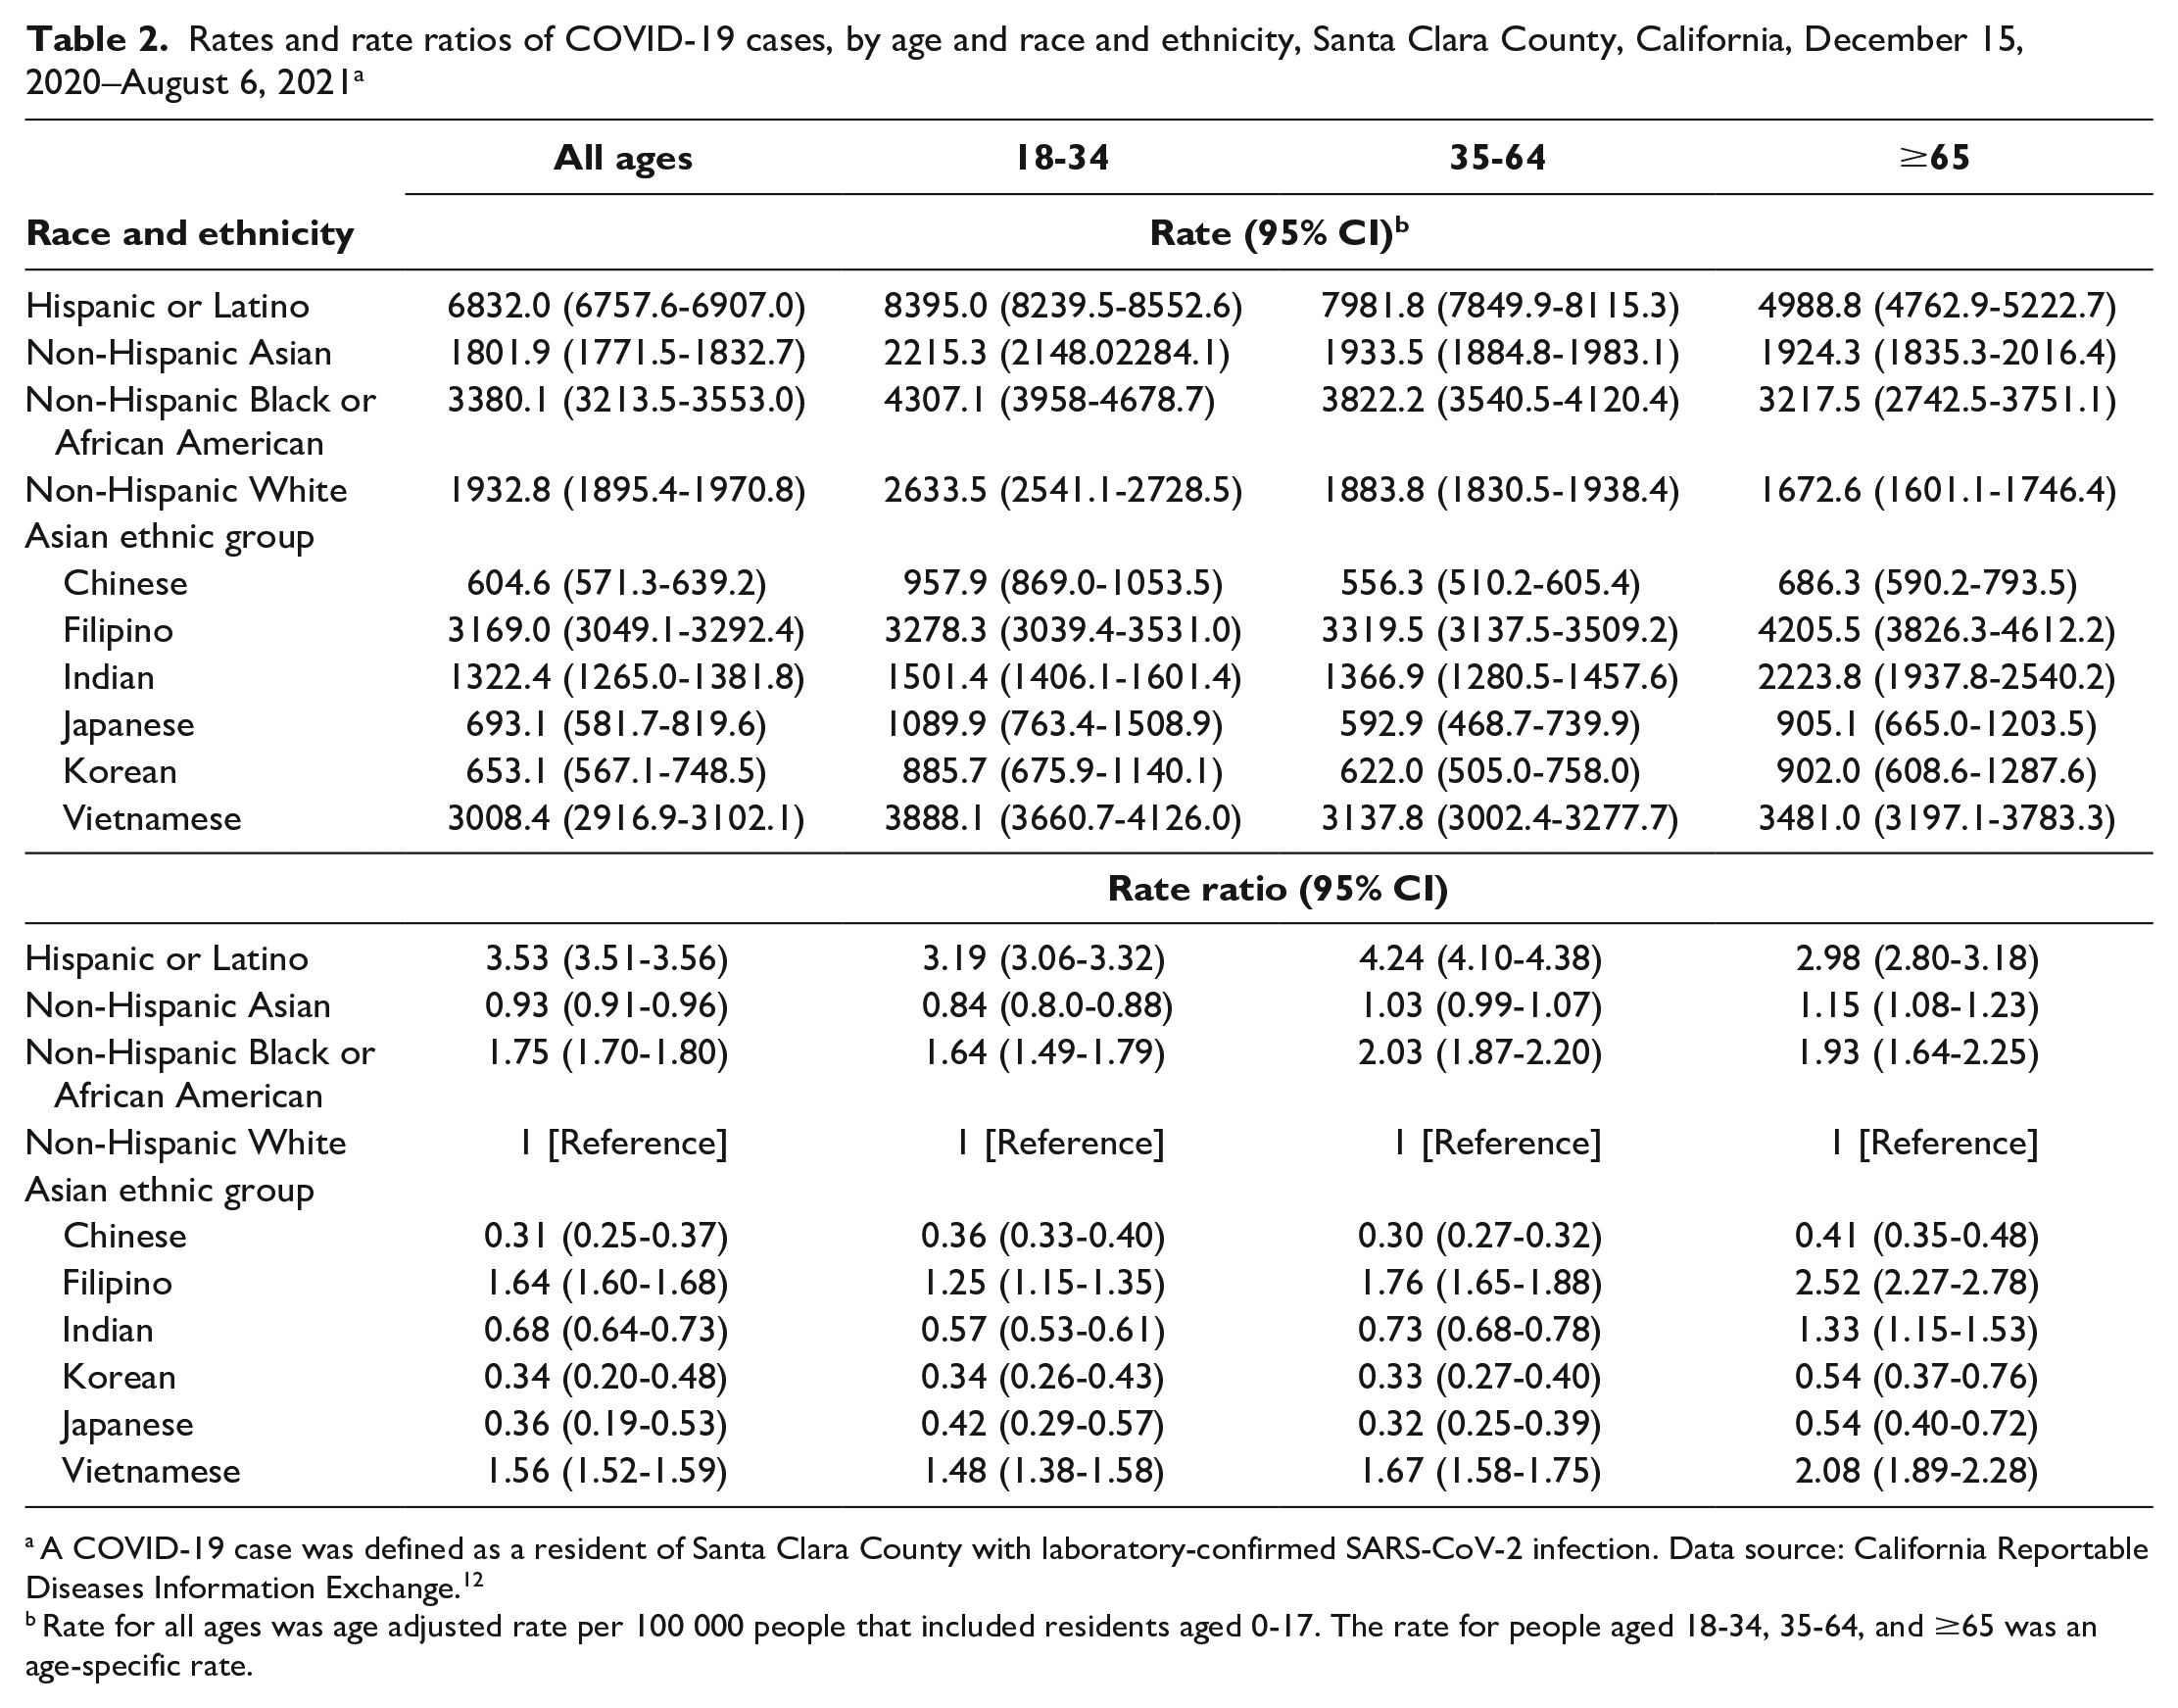
A COVID-19 case was defined as a resident of Santa Clara County with laboratory-confirmed SARS-CoV-2 infection. Data source: California Reportable Diseases Information Exchange. 12
Rate for all ages was age adjusted rate per 100 000 people that included residents aged 0-17. The rate for people aged 18-34, 35-64, and ≥65 was an age-specific rate.
Among all age groups, Hispanic or Latino residents had rates of COVID-19 that were 3 times higher than the rates among White residents. The rate of COVID-19 cases was also significantly higher among Black residents than among White residents across all age groups. Among residents aged ≥65, the rate of COVID-19 was significantly higher among Asian residents (RR = 1.15; 95% CI, 1.08-1.23) than among White residents. When Asian ethnic groups were compared with other racial and ethnic groups, the rate of COVID-19 among Vietnamese and Filipino residents was higher than among White residents across all age groups. Among residents aged ≥65, Vietnamese and Filipino residents had similar or significantly higher rates of COVID-19 than Black residents did, and Asian Indian residents had a higher rate of COVID-19 than White residents did (RR = 1.33; 95% CI, 1.15-1.53). Among Asian ethnic groups, Filipino, Vietnamese, and Asian Indian residents had the highest rate of COVID-19 across all age groups (Table 2).
When racial and ethnic groups were compared, Asian (38.7; 95% CI, 33.7-44.3) and White (42.3; 95% CI, 37.5-47.5) residents had the lowest age-adjusted rates of death from COVID-19 (Table 3); age-adjusted rates of death from COVID-19 were more than double among Hispanic or Latino (102.2; 95% CI, 89.7-115.8) and 77% higher among Black (75.0; 95% CI, 47.5-112.6) residents than among White residents. Among Asian ethnic groups, age-adjusted rates of death from COVID-19 were twice as high among Filipino (67.6; 95% CI, 49.1-90.8) and Vietnamese (63.7; 97% CI, 48.9-81.6) residents than among Chinese residents (25.5; 95% CI, 18.2-34.7) and similar to rates among Black residents. A similar pattern was observed among residents aged ≥65.
Rates and rate ratios of COVID-19 deaths among COVID-19 cases, by age and race and ethnicity, Santa Clara County, California, December 15, 2020–August 6, 2021 a
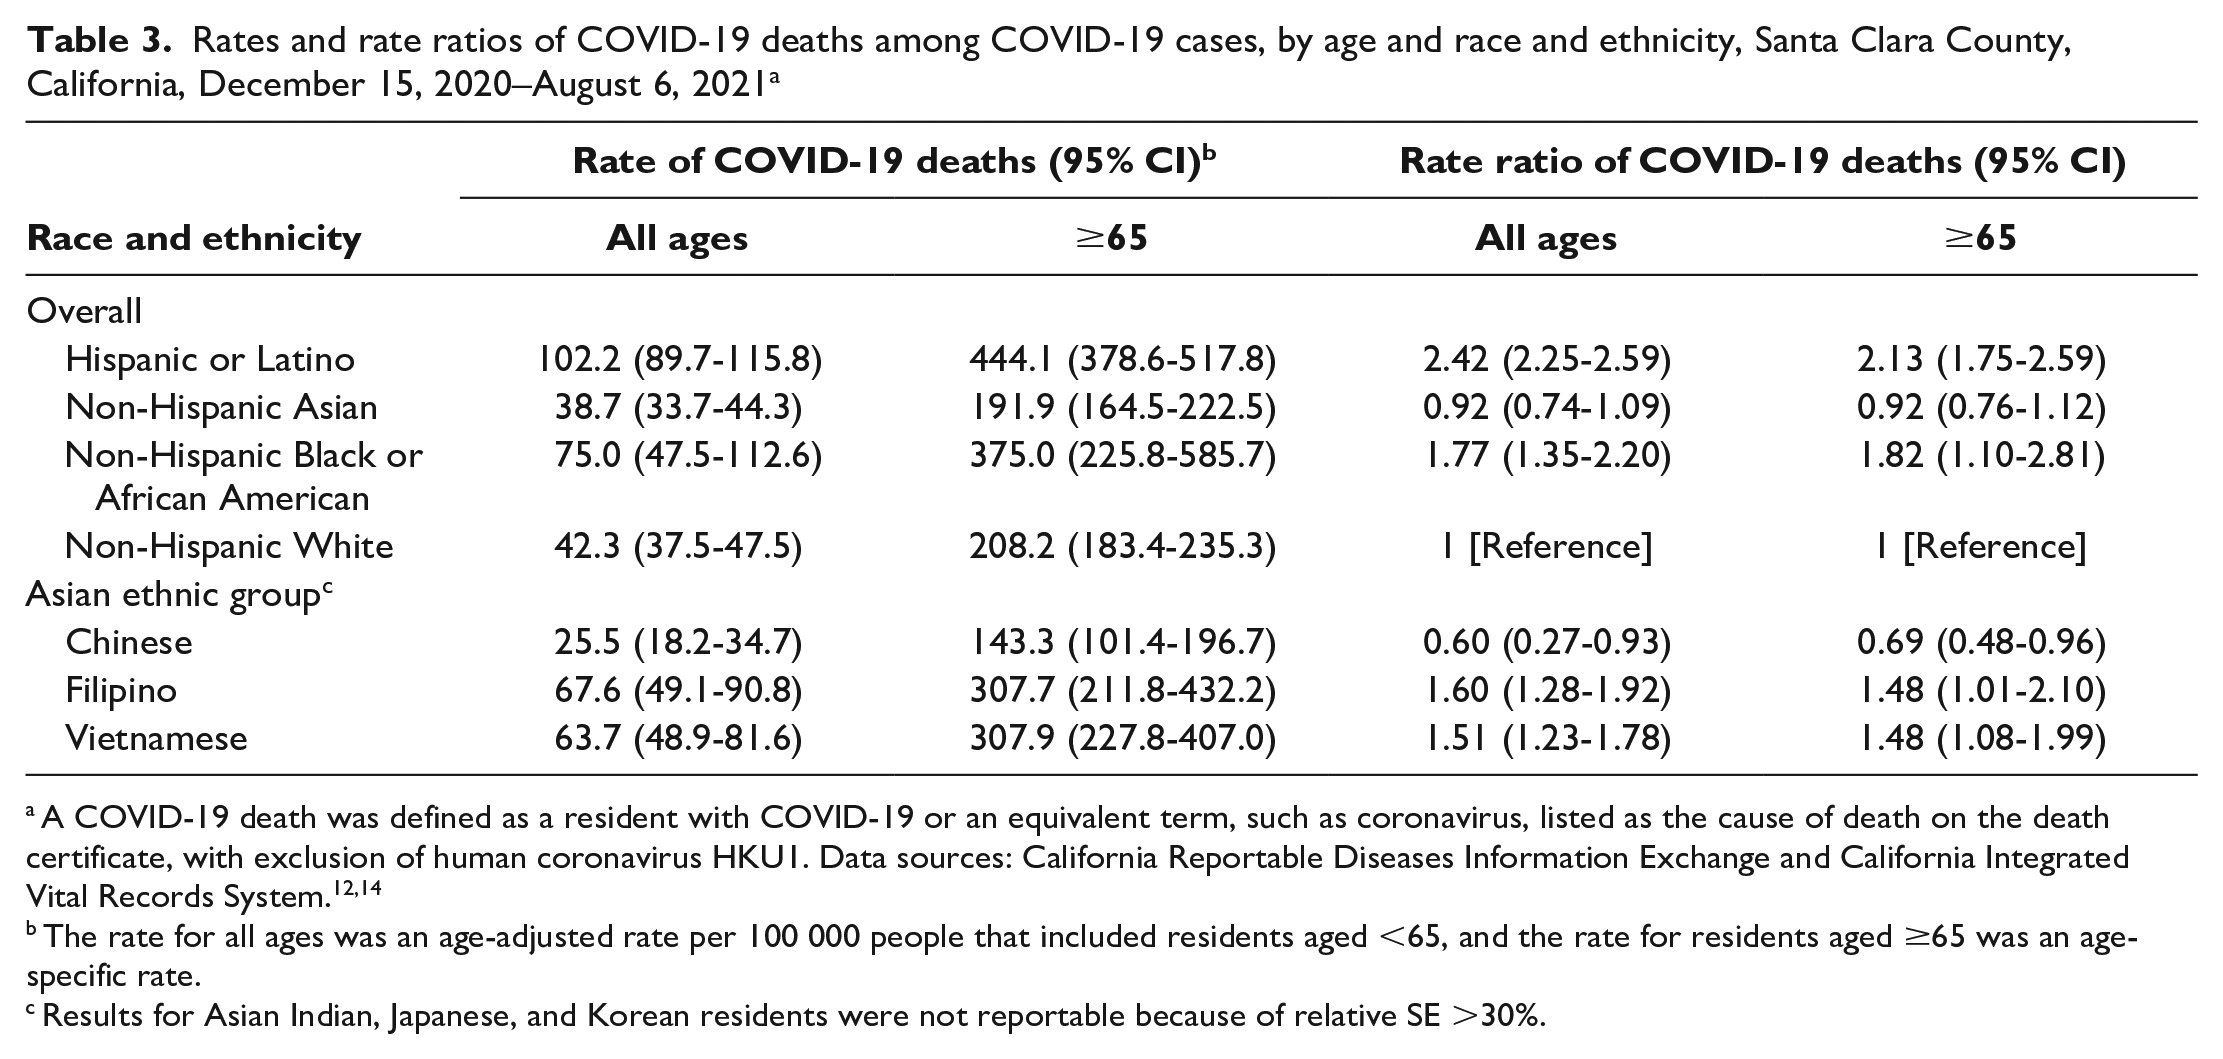
A COVID-19 death was defined as a resident with COVID-19 or an equivalent term, such as coronavirus, listed as the cause of death on the death certificate, with exclusion of human coronavirus HKU1. Data sources: California Reportable Diseases Information Exchange and California Integrated Vital Records System.12,14
The rate for all ages was an age-adjusted rate per 100 000 people that included residents aged <65, and the rate for residents aged ≥65 was an age-specific rate.
Results for Asian Indian, Japanese, and Korean residents were not reportable because of relative SE >30%.
Among COVID-19 cases, residents aged ≥65 (AOR = 20.39; 95% CI, 16.95-24.61), residents in LTCFs (AOR = 8.90; 95% CI, 7.31-10.84), and residents in the least healthy neighborhood (AOR = 1.36; 95% CI, 1.05-1.77) had greater odds of dying from COVID-19 than other age groups, residents not in LTCFs, and residents in the healthiest neighborhood, respectively. Residents who were fully vaccinated (AOR = 0.14; 95% CI, 0.05-0.30) had lower odds of dying from COVID-19 than residents who were partially or not vaccinated (Figure). After adjustment for demographic variables (sex, age group, LTCF residency, vaccination status, and HPI quartiles), among Asian ethnic groups, only Chinese residents had significantly higher odds of death than White residents did (AOR = 1.74; 95% CI, 1.15-2.57).
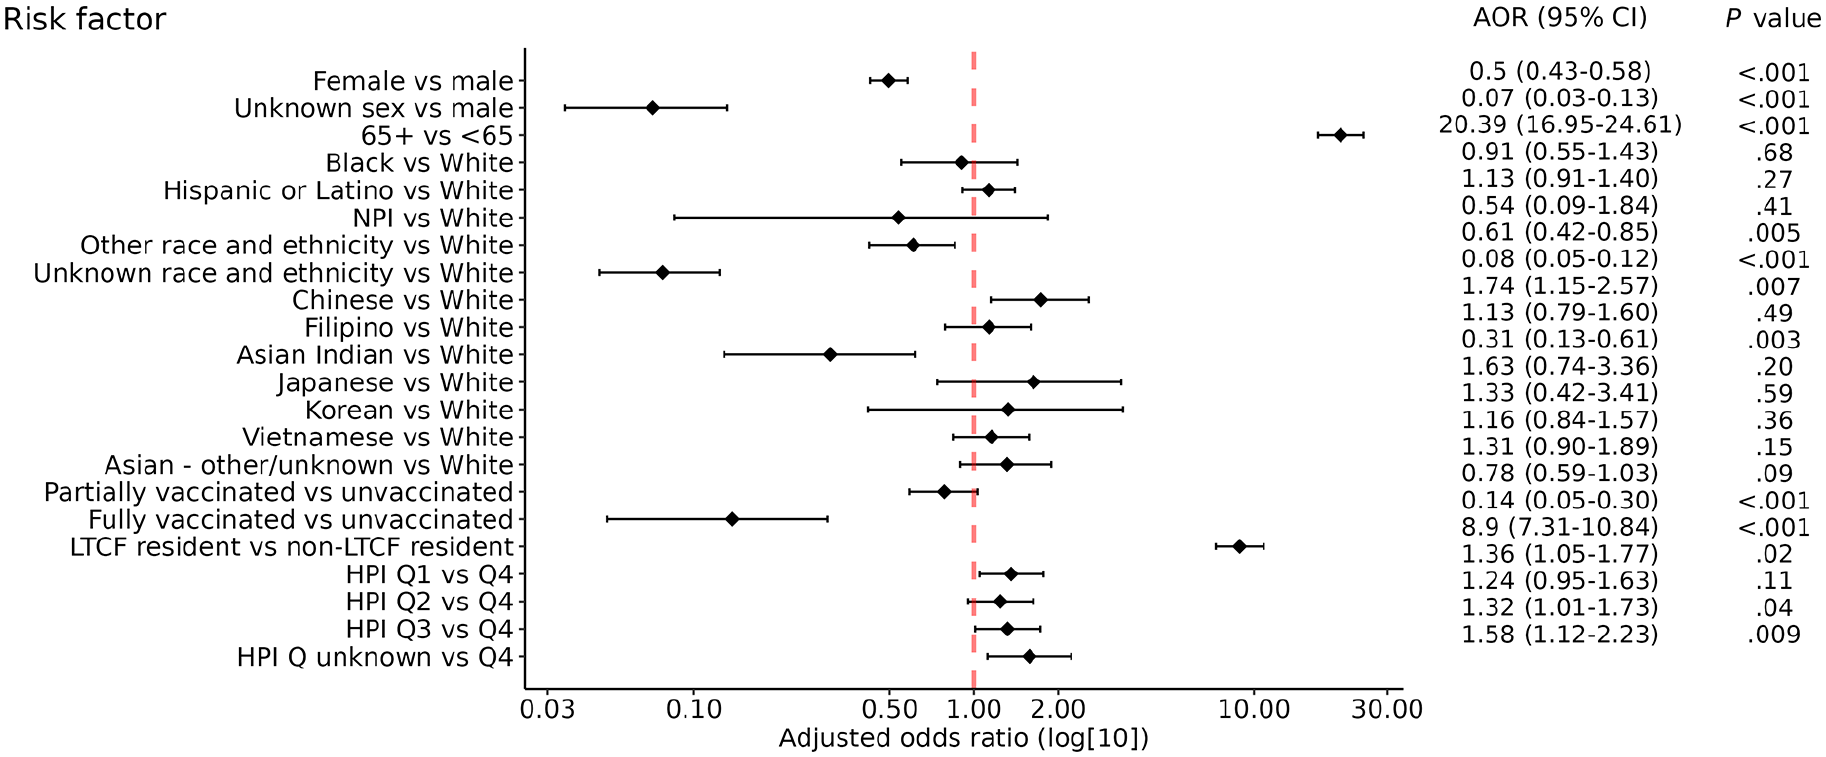
Adjusted odds ratios (AORs) of COVID-19–related deaths among COVID-19 cases who were aged ≥18 years, Santa Clara County, California, December 15, 2020–August 6, 2021. A COVID-19 case was defined as a resident of Santa Clara County with laboratory-confirmed SARS-CoV-2 infection. A COVID-19 case was defined as fully vaccinated if the resident had a positive nucleic acid amplification test on or 14 days after the resident received the 1-dose Janssen-Ad26.COV2-S vaccine or the second dose of the 2-dose Moderna-Spikevax or Pfizer–BioNTech-Comirnaty vaccine. A COVID-19 case was defined as partially vaccinated if the resident had a positive test result within 14 days after the resident completed the 1-dose vaccine or was between doses for the 2-dose vaccine. The Healthy Places Index (HPI) ranked scores for census tracts into quartiles, from least healthy to most healthy. 17 Data sources: California Reportable Diseases Information Exchange, California Immunization Registry, and California Integrated Vital Records System.12,14 Abbreviations: LTCF, long-term care facility; NPI, Native Hawaiian and Other Pacific Islander; Q, quartile.
In analyses of residents who completed the primary COVID-19 vaccine series, Asian residents aged ≥18 years had the highest COVID-19 vaccination coverage among all racial and ethnic groups (87.0%; 95% CI, 86.8%-87.3%) (Table 4). COVID-19 vaccination coverage was highest among Vietnamese (88.1%; 95% CI, 87.6%-88.7%) and Chinese (81.4%; 95% CI, 81.0%-81.9%) residents and lowest among Filipino residents (65.0%; 95% CI, 64.4%-65.6%), showing a rate similar to Black residents (64.8%; 95% CI, 64.0%-65.7%). Hispanic or Latino (72.0%; 95% CI, 71.7%-72.3%) and Korean (72.0%; 95% CI, 70.9%-73.1%) residents had lower vaccine completion rates than White residents did (74.1%; 95% CI, 73.9%-74.4%), but Asian Indian (74.1%; 95% CI, 73.6%-74.5%) and Japanese (74.3%; 95% CI, 73.3%-75.4%) residents had rates that were similar to White residents.
Percentage of completed COVID-19 vaccine series by race and ethnicity, Santa Clara County, California, December 15, 2020–August 6, 2021 a
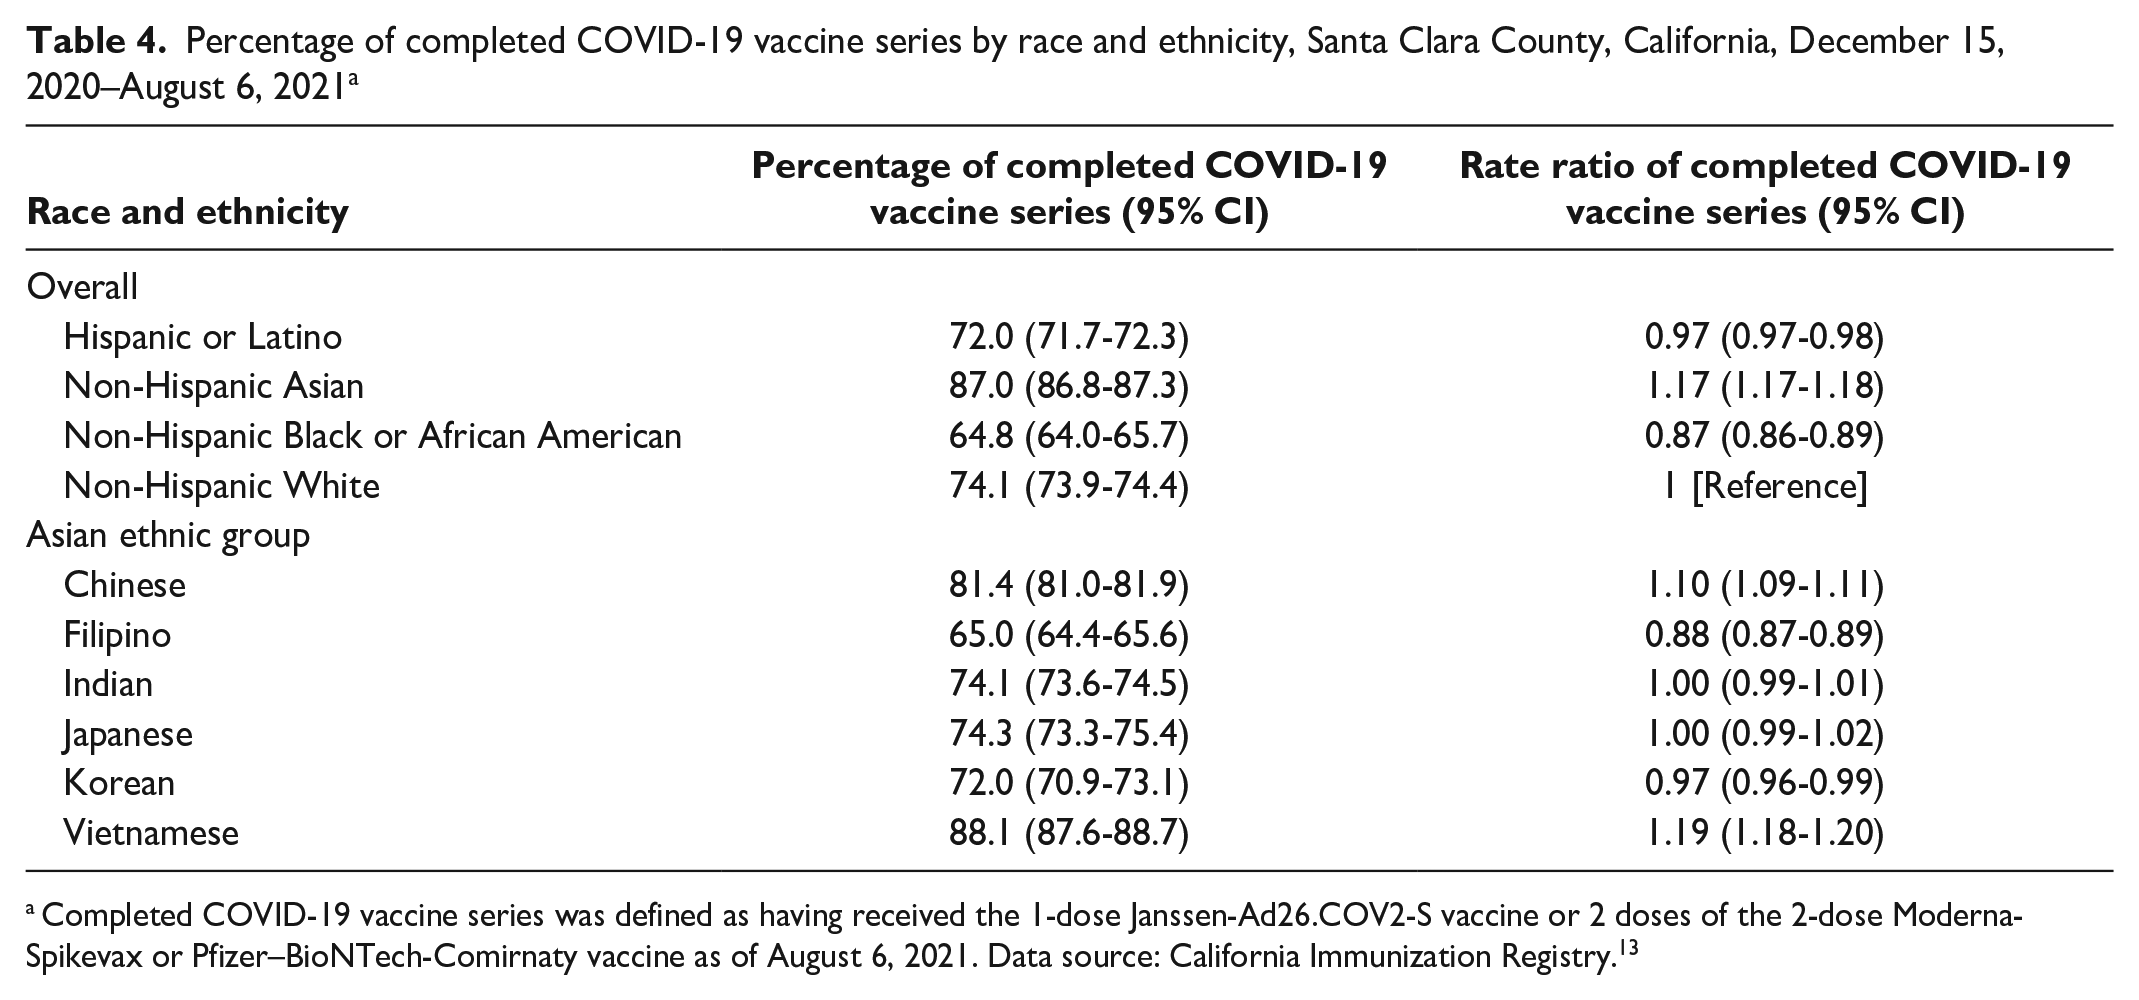
Completed COVID-19 vaccine series was defined as having received the 1-dose Janssen-Ad26.COV2-S vaccine or 2 doses of the 2-dose Moderna-Spikevax or Pfizer–BioNTech-Comirnaty vaccine as of August 6, 2021. Data source: California Immunization Registry. 13
Discussion
The Asian population is a fast-growing racial and ethnic group in California and the United States. 15 Asian people have increased life expectancy and better health outcomes than other racial and ethnic groups do11,20,21; therefore, they are often excluded from research on health disparities.22,23 However, mortality, SDOH, incidence of chronic and infectious diseases, and health care access and use vary widely among Asian ethnic groups.24-27 This study disaggregated data on Asian ethnic groups and revealed a disproportionate prevalence of COVID-19 infection and death among Filipino and Vietnamese residents of Santa Clara County and low vaccine uptake among Filipino residents. These findings highlight the importance of disaggregating Asian health data into ethnic groups to identify and ultimately address disparities in health outcomes in this population.
Two studies based in large US hospital systems reported similar variations in COVID-19 cases and mortality among Asian ethnic groups. In New York City, South Asian residents had the second-highest rates of SARS-CoV-2 test positivity and hospitalization, whereas Chinese residents had the highest mortality rate compared with all other racial and ethnic groups. 4 In Northern and Central California, SARS-CoV-2 test positivity rates among Chinese and Korean residents were lower than among residents who were Asian Indian, Filipino, and other Asian (Cambodian, Hmong, Laotian, Pakistani, Tai). COVID-19 hospitalization rates also varied; Vietnamese, Filipino, Japanese, Chinese, and other Asian residents had notably higher rates than White residents did, and Korean and Asian Indian residents had rates that were similar to those of White residents. 5
Low levels of COVID-19 testing among some racial and ethnic minority groups may result in an underestimation of disease prevalence in these groups. Although a lack of COVID-19 testing among Asian people has been reported, 5 differences among ethnic groups remain unknown. Some Asian ethnic groups may have been tested for COVID-19 more frequently than other Asian ethnic groups because of working in settings at high risk of COVID-19 exposure where regular screening was required. Conversely, other Asian ethnic groups may have worked from home, reducing their chances of being tested for COVID-19.
In Santa Clara County, Vietnamese and Chinese residents were more likely and Filipino and Korean residents were less likely than White residents to receive and complete a COVID-19 vaccine series, consistent with studies in which Vietnamese people reported they were more willing to receive the vaccine than Chinese people, and Korean people indicated a lower level of vaccine intention than both Chinese and Vietnamese people.8,9 Although our study showed that, among Asian ethnic groups, Vietnamese residents had the highest COVID-19 vaccine uptake, Vietnamese people had the second-highest age-adjusted rate of death from COVID-19. This finding may have resulted from high mortality rates among Vietnamese residents before the widespread availability of vaccines; 80% of deaths occurred before February 15, 2021, when <25% of the population was vaccinated.
Disparities in COVID-19 health outcomes among Asian ethnic groups could be multifactorial. 28 Asian ethnic groups differ in educational attainment,11,20 socioeconomic status,11,20 English proficiency,11,20 health literacy,11,29 health insurance, and health care access and use.11,26 Compared with other Asian ethnic groups in Santa Clara County, Filipino and Vietnamese residents had a higher likelihood of working in settings at high risk of COVID-19 exposure, living in overcrowded housing units, having chronic diseases, having lower educational attainment and household income, and being less likely to access and use health services. 11 These factors contribute to an increased risk of COVID-19 infection, hospitalization, and death.1,10 Studies have reported associations between HPI and infectious and noncommunicable disease prevalence.30-32 Our study found that the risk of dying of COVID-19 varied among Asian ethnic groups, particularly between Chinese and Asian Indian residents, even after adjusting for HPI quartiles and other factors such as sex, age, LTCF residency, and vaccination status. Therefore, such factors, the data for which are not collected by public health systems, may also contribute to disparities in COVID-19 mortality among Asian ethnic groups.
Analysis of health outcomes by Asian ethnic groups is essential to identify health disparities in this heterogeneous group and to help guide public health policies, programs, interventions, and resource allocation to mitigate inequities. Our study found that using the “Asian” umbrella category to understand racial and ethnic disparities in COVID-19 health outcomes masked that some Asian ethnic groups were as negatively affected by COVID-19 as other racial and ethnic minority groups. Understanding the unique needs of Asian ethnic groups can facilitate tailored interventions that are responsive to the needs of each Asian ethnic group. Understanding the variation in COVID-19 health outcomes among Asian ethnic groups is particularly important because of the increase in acts of anti-Asian racism and xenophobia during the pandemic, 33 which can exacerbate barriers to timely prevention, care, and access to medical and social services.
Although NAPIIA is a valuable tool, improved data collection is still needed because NAPIIA results may be subject to misclassification.34,35 Data collection at the local, state, and national levels should include reporting of Asian ethnic groups and other heterogeneous racial and ethnic groups, including Native American, mixed race, Black, and Hispanic or Latino populations. Federal and state governments are starting to collect more granular data, with the National Health Interview Survey, Current Population Survey, American Community Survey, and CalREDIE collecting ethnic group data for Asian and Hispanic or Latino populations.36,37 Such practices should be expanded and standardized at the federal level and adopted by public health data systems (eg, CAIR2) at the state and local levels. Guides to collect, document, and analyze racial and ethnic groups should be shared among users of these systems, including with health care delivery systems that collect and transmit data to public health data systems.
Limitations
Our study had some limitations. First, for missing information on Asian ethnic group, we assigned a group by using NAPIIA. The absence of birth country and maiden name, 2 fields that are included in the algorithm but often missing in public health systems, may lead to suboptimal performance of NAPIIA. 38 Misclassification may have also occurred because of overlap between names across Asian ethnic groups and variations in name spellings. However, NAPIIA has been endorsed by the Centers for Disease Control and Prevention 39 and validated in other studies.15,38 In addition, we showed its high positive predictive value when compared with gold standard data (eSupplement).
Second, we were unable to identify the ethnic group for 15% to 20% of Asian residents after reclassification, disproportionately affecting results for Vietnamese, Filipino, and Asian Indian residents. Our analysis showed that the algorithm may be less able to identify people from these ethnic groups than from other ethnic groups. Thus, the actual rates of COVID-19 infection and mortality among Vietnamese and Filipino residents may have been higher than shown in our study. Misclassification of Chinese and Korean people could overestimate COVID-19 incidence and death. Asian residents who were in LTCFs were more likely to lack ethnic group information than those who were not in LTCFs. Lack of information may have further obscured the effects of COVID-19, particularly for Japanese, Korean, and Chinese people, who are more likely to be LTCF residents than Asian residents from other ethnic groups.
Third, we obtained COVID-19 vaccination status by matching CalREDIE and CAIR2, which subjected our data to mismatches. Residents who were partially vaccinated or had completed a COVID-19 vaccine series may have been misclassified as unvaccinated or partially vaccinated. We included all available covariates to estimate mortality risk among COVID-19 cases, but some covariates, such as hospitalization and comorbidities, were not accessible. Although we included SDOH, SDOH is not collected at the individual level. Such risk factors, which are known to lead to severe outcomes, likely varied among racial and ethnic and Asian ethnic groups and could have affected our estimates.
Fourth, although data from the 2017-2021 American Community Survey and the US Census are generally more accurate than other population estimates, they have been contested to undercount some groups, particularly undocumented immigrants. 40 Therefore, estimates for Asian ethnic groups with high numbers of undocumented immigrants, such as Filipino, Asian Indian, and Chinese people, 41 may have been overestimated.
Conclusions
When Asian people are analyzed as a whole, disparities in health and outcomes among Asian ethnic groups may be hidden, highlighting the importance of disaggregating data on the Asian population into ethnic groups when identifying, reporting, and addressing outcomes of COVID-19 and other diseases. Data on racial and ethnic groups must be collected, standardized, and made available to local public health departments. Progress is needed to establish updated data standards that define and collect data on racial and ethnic group, and support is needed for users of these systems in collecting, documenting, and analyzing data on racial and ethnic groups.
Supplemental Material
sj-docx-1-phr-10.1177_00333549241308165 – Supplemental material for Disparities in COVID-19 Cases, Deaths, and Vaccination, by Race and Ethnicity and Asian Ethnic Groups, Santa Clara County, California, 2020-2021
Supplemental material, sj-docx-1-phr-10.1177_00333549241308165 for Disparities in COVID-19 Cases, Deaths, and Vaccination, by Race and Ethnicity and Asian Ethnic Groups, Santa Clara County, California, 2020-2021 by Wen Lin, Madeleine Swart, Pamela Stoddard, Kate Kelsey, Anandi Sujeer, Christopher M. Hoover and Wayne Enanoria in Public Health Reports
Footnotes
Acknowledgements
The authors thank Mandeep Sidhu, MPH, senior epidemiologist at the County of Santa Clara Public Health Department, for technical consultancy and provision of Healthy Places Index and population estimates.
Declaration of Conflicting Interests
The authors declared no potential conflicts of interest with respect to the research, authorship, and/or publication of this article.
Funding
The authors received no financial support for the research, authorship, and/or publication of this article.
Supplemental Material
Supplemental material for this article is available online. The authors have provided these supplemental materials to give readers additional information about their work. These materials have not been edited or formatted by Public Health Reports’s scientific editors and, thus, may not conform to the guidelines of the AMA Manual of Style, 11th Edition.
References
Supplementary Material
Please find the following supplemental material available below.
For Open Access articles published under a Creative Commons License, all supplemental material carries the same license as the article it is associated with.
For non-Open Access articles published, all supplemental material carries a non-exclusive license, and permission requests for re-use of supplemental material or any part of supplemental material shall be sent directly to the copyright owner as specified in the copyright notice associated with the article.