
Abstract
Objective:
The Federated States of Micronesia (FSM) experience periodic outbreaks of vaccine-preventable diseases. Our objective was to assess the cost-effectiveness of routine outreach and catch-up campaign strategies for increasing vaccination coverage for the measles, mumps, and rubella (MMR) vaccine among children aged 12 months through 6 years in Chuuk, FSM.
Methods:
We used a cost-effectiveness model to assess 4 MMR vaccination strategies from a public health perspective: routine outreach conducted 4 times per year (quarterly routine outreach), routine outreach conducted 2 times per year (biannual routine outreach), catch-up campaigns conducted once per year (annual catch-up campaign), and catch-up campaigns conducted every 2 years with quarterly routine outreach in non–catch-up campaign years (status quo). We calculated costs and outcomes during a 5-year model horizon and summarized results as incremental cost-effectiveness ratios. We analyzed the following public health outcomes: additional protected person-month (PPM), doses administered and protected people (ie, a child who completed a 2-dose MMR series). We conducted 1-way sensitivity analyses to evaluate the stability of incremental cost-effectiveness ratios and to identify influential model inputs.
Results:
Among the 4 MMR vaccination strategies, quarterly routine outreach was the most effective and most expensive strategy, and biannual routine outreach was the least expensive and least effective strategy. Quarterly routine outreach (vs status quo) yielded approximately an additional 7001 PPMs and 132 vaccine doses administered, with incremental costs of about $4 per PPM, $193 per dose administered, and $123 per protected person.
Conclusion:
Routine outreach and catch-up campaign vaccination strategies can be important interventions to improve health in Chuuk, FSM. More frequent routine outreach events could improve MMR coverage and reduce the likelihood of outbreaks of vaccine-preventable diseases such as measles and mumps.
Measles is one of the most infectious human diseases and can cause serious illness, lifelong complications, and death. 1 The measles, mumps, and rubella (MMR) vaccine is 97% effective against measles, 2 protecting individuals from infection and death, and widespread use of the MMR vaccine can stop the spread of the virus in populations that achieve and maintain high levels of immunity. 3 However, in 2018, measles caused more than 140 000 deaths globally, mostly among children aged <5 years. 4 The World Health Organization (WHO) Global Vaccine Action Plan for 2012 through 2020 established targets for measles and rubella elimination in at least 5 WHO Regions by 2020. 5 The Federated States of Micronesia (FSM) is a member country of the WHO Western Pacific region and has committed to measles elimination by achieving and maintaining a 95% MMR coverage rate.
FSM is an island nation consisting of 4 island states spread across 2700 km in the Pacific Ocean near the equator. 6 Under the Compact of Free Association, the United States provides FSM with economic assistance, defense, and other benefits, including providing vaccination funding and technical assistance from the Centers for Disease Control and Prevention. 7 FSM recommends the first dose of the MMR vaccine at age 12 months and the second dose at 13 months. 8 FSM, and the state of Chuuk in particular, faces unique challenges to increasing vaccination coverage, including geographic remoteness, limited access to vaccination services, and highly mobile populations. 9 In 2019, MMR vaccination coverage among children aged 12 months through 6 years in Chuuk was 70% for ≥2 vaccine doses, which is below the FSM target. Low vaccination coverage may be attributed to dispersed populations across Chuuk’s outer island regions (a vast group of small islands distant from the main island of Weno), where routine vaccination services are limited. 10 Because of low vaccination coverage, FSM experiences periodic outbreaks of vaccine-preventable diseases (VPDs), including a measles outbreak in 2014 and mumps outbreaks in 2007 and 2017-2018.11 -13 MMR vaccination is known to be a cost-effective intervention, and access to timely MMR vaccine is important for reducing morbidity and mortality, for population health, and for reducing outbreaks.14,15
Vaccines are housed at the Chuuk Public Health Department on Weno and distributed by boats and automobiles to outer island regions (eFigure 1 in Supplemental Material) through 2 vaccination strategies: (1) routine outreach and (2) catch-up campaigns. Routine outreach consists of a set of vaccination events designed to engage outer island groups throughout the state at various time points throughout the year. Catch-up campaigns are singular statewide vaccination events during a designated period (usually 1 month). Both routine outreach and catch-up campaign events improve population health by increasing vaccination coverage; however, the strategies differ in implementation costs and vaccination outcomes. Routine outreach events are conducted multiple times per year, minimizing dedicated resources per event. Compared with routine outreach events, catch-up campaign events take longer to complete because they are conducted statewide during a designated period, requiring more dedicated time and resources per event. Although both routine outreach and catch-up campaign vaccination strategies are conducted in Chuuk to increase vaccination coverage, little is known about differences in their cost-effectiveness in an island jurisdiction. In this study, we assessed the economic value of different vaccination outreach strategies for children aged 12 months through 6 years to determine the optimal strategy with regard to cost and vaccination coverage and to better understand the trade-offs between routine outreach and catch-up campaign events.
Methods
To assess the economic value of alternative vaccination strategies, we developed a cost-effectiveness model. We included a simple population (or compartmental) model of children aged 12 months through 6 years who have received 0, 1, or 2 doses of the MMR vaccine (eFigure 2 in Supplemental Material). We used our model to compare 4 vaccination outreach strategies: routine outreach events conducted 4 times per year (quarterly routine outreach), routine outreach events conducted 2 times per year (biannual routine outreach), catch-up campaigns conducted once per year (annual catch-up campaigns), and catch-up campaigns conducted every 2 years with quarterly routine outreach during non–catch-up campaign years (status quo). We based the timing of events for the status quo strategy on the outreach implementation plan of the Chuuk Immunization Program. For the quarterly routine outreach strategy, we included 20 routine outreach events (4 events every year of the 5-year model). For the status quo strategy, we included 1 catch-up campaign event (years 1, 3, and 5) every other year and 4 routine outreach events in the non–catch-up campaign event years (years 2 and 4).
Model inputs for population size, vaccination coverage, and costs per routine outreach and catch-up campaign event represented outreach activities conducted to remote regions of Chuuk. Model estimates included costs accruing to the public health department and immunization program, representing the public health perspective. We used a monthly timestep in our model to account for costs and benefits during a 5-year period. We discounted future costs and outcomes by 3% annually. We built the model in Microsoft 365 Excel. We validated base case estimates in the model against vaccination coverage assessment data from 2016 and 2021 (eFigure 3 in Supplemental Material).
This activity was reviewed by the Centers for Disease Control and Prevention (CDC), deemed not research, and conducted consistent with applicable federal law and CDC policy (45 CFR part 46; 21 CFR part 56; 42 USC Sect 241(d), 5 USC Sect 552a, 44 USC Sect 3501 et seq).
Population
We assumed the model to have a starting population of 7303 children aged 12 months through 6 years with an active patient status in the immunization information system (IIS) as of December 31, 2019. To account for new children becoming age eligible to receive the MMR vaccine, we increased the model population by 88 children per month, based on average monthly birth data from 2015 through 2019. Among children aged 12 months through 6 years, we used a starting level of MMR coverage of 17% for the first dose (ie, only 1 dose) and 70% for the second dose (ie, received ≥2 doses), based on data from 2019. We followed the model population for 5 years during the implementation of vaccination outreach events in FSM. We used data from the IIS to calculate model population, monthly birth rate, and MMR coverage.
Vaccination Coverage During Outreach Events
We defined vaccination coverage as the percentage of eligible children who were vaccinated with either a first or second dose of MMR vaccine during a single routine outreach or catch-up campaign event. We determined that, in a single routine outreach event, base case vaccination coverage was 10% for the first dose and 7% for the second dose (Table 1). We determined that, in a single catch-up campaign event, base case vaccination coverage was 36% for the first dose and 22% for the second dose. We also calculated the ranges for coverage inputs (eTable 1 in Supplemental Material). For a given strategy after the full 5-year time horizon of the model, the achieved overall vaccination coverage depends on the number of events in each strategy and the eligible population at the time of each event. For example, the first dose coverage of 10% and the second dose coverage of 7% among eligible children from a single routine outreach event would affect the vaccine-eligible model population 4 times per year for all 5 years under the quarterly routine outreach strategy.
Input values used in a cost-effectiveness model comparing measles, mumps, and rubella vaccination outreach strategies during a 5-year period, Chuuk, Federated States of Micronesia a
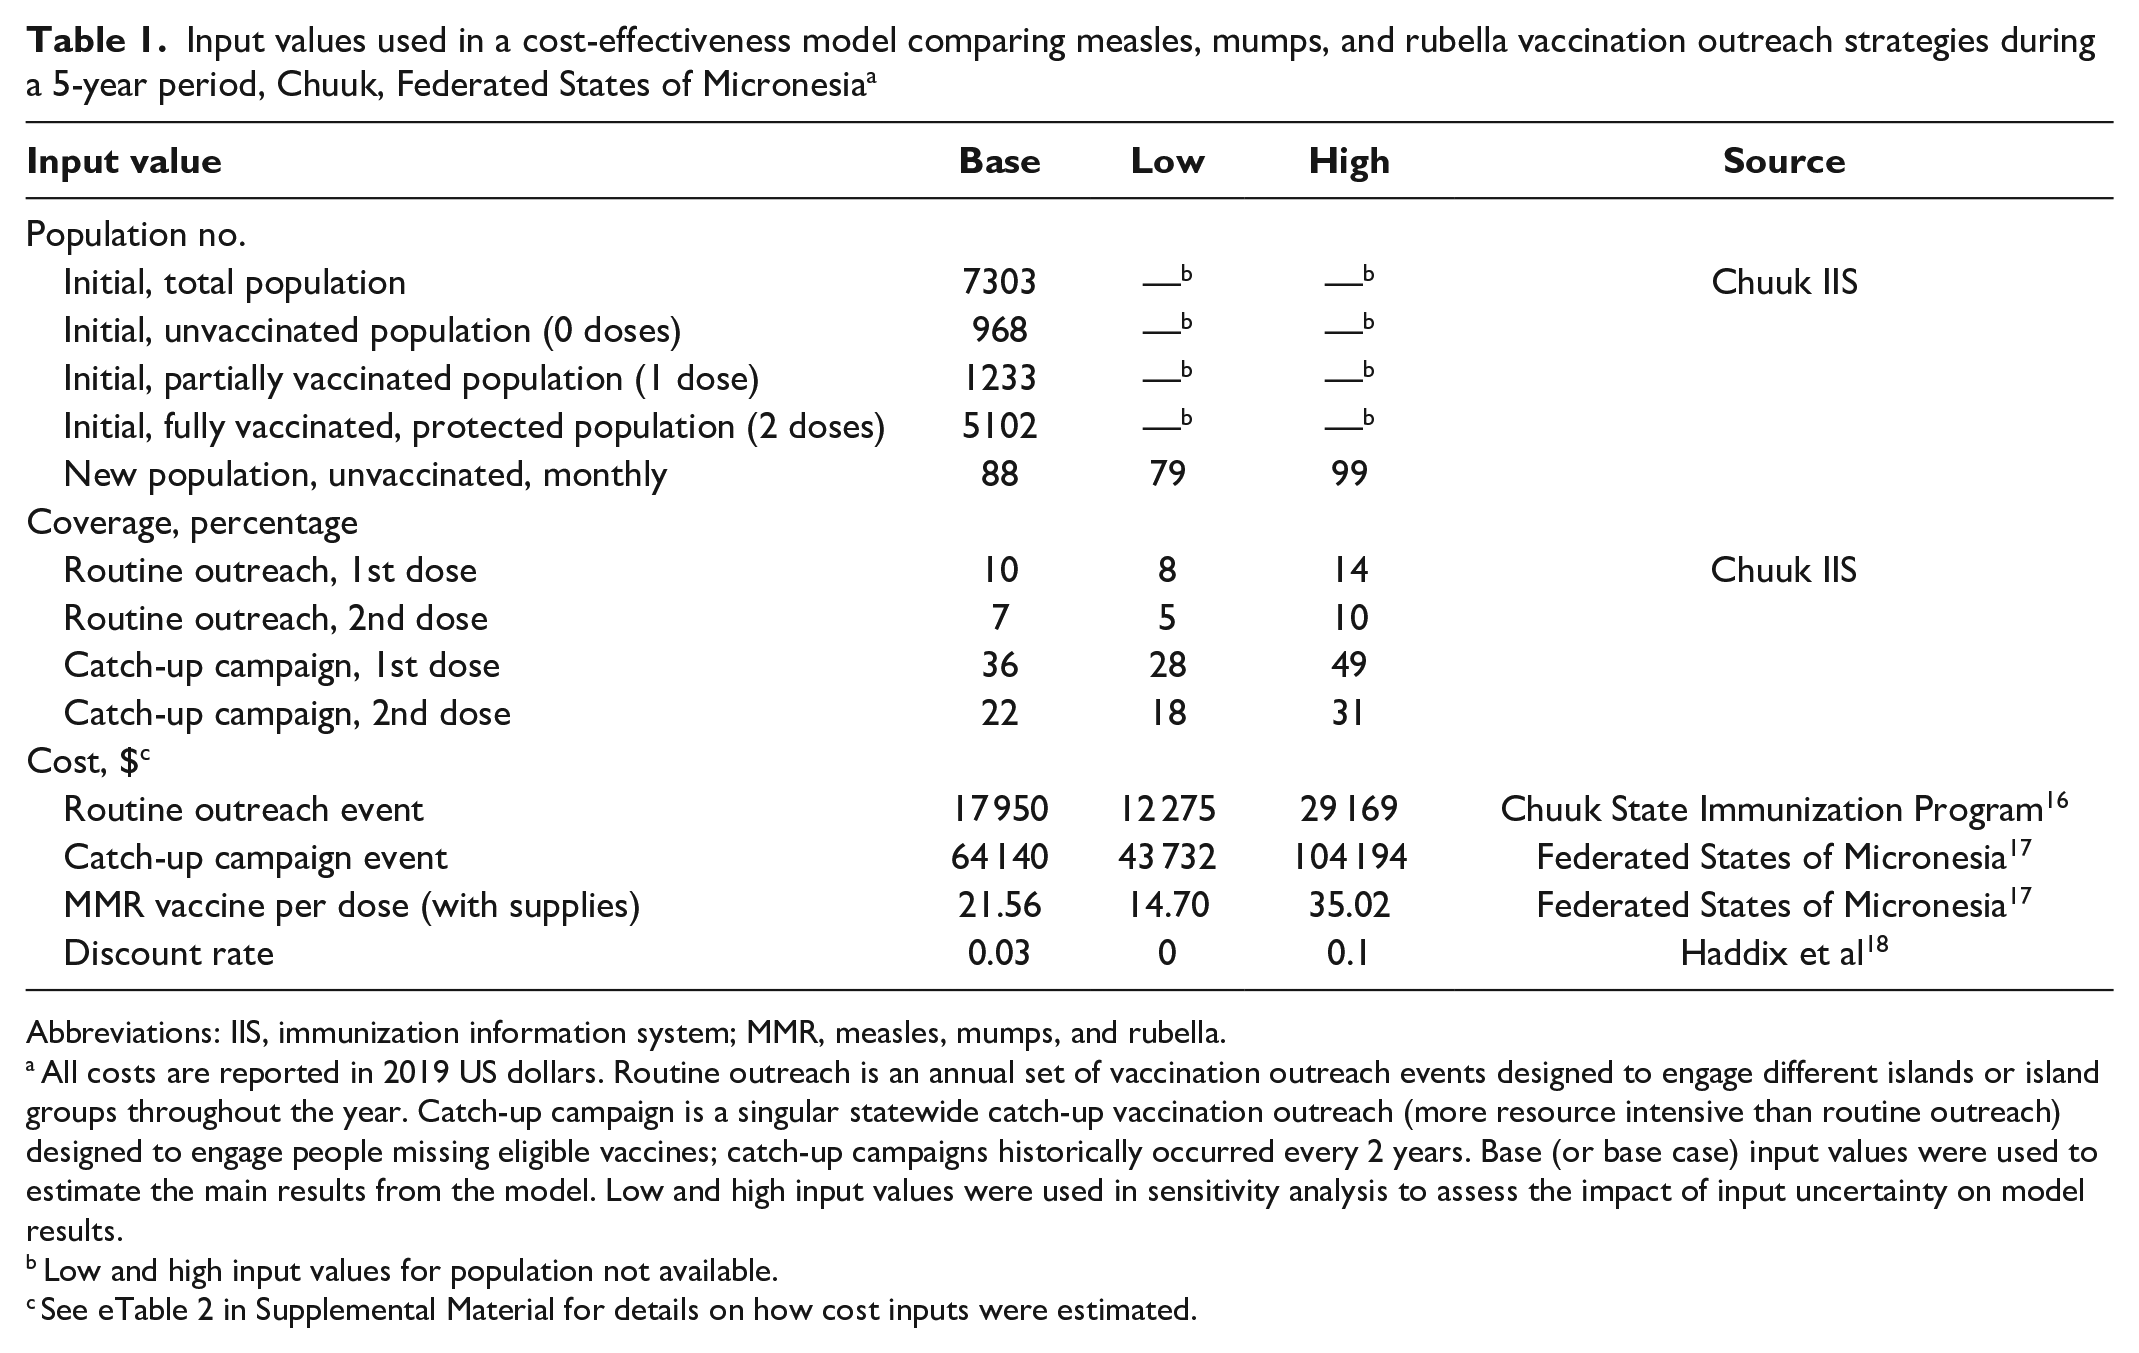
Abbreviations: IIS, immunization information system; MMR, measles, mumps, and rubella.
All costs are reported in 2019 US dollars. Routine outreach is an annual set of vaccination outreach events designed to engage different islands or island groups throughout the year. Catch-up campaign is a singular statewide catch-up vaccination outreach (more resource intensive than routine outreach) designed to engage people missing eligible vaccines; catch-up campaigns historically occurred every 2 years. Base (or base case) input values were used to estimate the main results from the model. Low and high input values were used in sensitivity analysis to assess the impact of input uncertainty on model results.
Low and high input values for population not available.
See eTable 2 in Supplemental Material for details on how cost inputs were estimated.
We validated the vaccination coverage inputs by conducting a modeling exercise that reasonably replicated the vaccination coverages that were reported for 1-year-olds and 6-year-olds in the vaccination coverage assessments from 2016 and 2021 (eFigure 3 in Supplemental Material). We calculated the estimates of vaccination coverage from the IIS data by using SAS version 9.4 (SAS Institute Inc).
Costs
We included 2 components to determine the total cost of a routine outreach or catch-up campaign event: (1) event implementation cost and (2) vaccination cost. For a single outreach event, we determined that the implementation cost would be a fixed cost, consisting of equipment rentals, materials, and personnel. A catch-up campaign event requires more resources than a routine outreach event; thus, a catch-up campaign event has a greater implementation cost than a routine outreach event. For the model, we assumed that implementation costs would not be affected by the number of vaccinations administered. We estimated the event implementation cost from outreach spend records provided by the FSM National Immunization Program and the Chuuk State Immunization Program for the years 2018 (which included several routine outreach events) and 2019 (which included a single catch-up campaign event) (eTable 2 in Supplemental Material).16,17 These records provided itemized costs for personnel, equipment (eg, boats, automobiles, refrigerated storage units), and fuel that were used for the outreach events, such that implementation costs could be separated from vaccination costs.
For vaccination costs, we included costs of the administered vaccine doses and the associated supplies, such as syringes and cotton swabs. For our model, vaccinations costs were variable costs. As variable costs, the vaccination costs increase with the number of vaccinations given at a particular event. The number of vaccinations given per event depends on the eligible population at the time of the event. We estimated the cost per vaccination from records provided by the FSM National Immunization Program for the catch-up campaign that occurred in 2019. 17 Because vaccination costs were reported separately from implementation costs by the FSM National Immunization Program, we were able to identify a specific cost per dose administered. For all events (routine outreach and catch-up campaign) in the model, we used this cost per dose. We reported all costs in 2019 US dollars, with adjustments made by using the Consumer Price Index of FSM. 19
Outcomes
We selected as primary outcomes items that would represent objectives of interest for a typical immunization program. Thus, we included MMR doses administered, protected person-months (PPMs), and cost per protected person as primary outcomes. We defined doses administered as the number of doses of MMR administered during the 5-year period of the model. We defined PPM as the total number of months per person from the time the second dose of MMR was received until the end of the model period. We defined a protected person as a person who received ≥2 doses of MMR.
Cost-Effectiveness Analysis
After we calculated the costs and outcomes for each strategy, we ordered the strategies by increasing effectiveness. We calculated incremental cost-effectiveness ratios (ICERs) for each strategy relative to the next less effective strategy. We defined ICERs as the change in costs divided by change in outcomes between 2 possible strategies, which we could interpret as a cost per health outcome gained. We calculated ICERs for all primary outcome measures (cost [$]/dose administered, cost [$]/PPM, and cost [$]/protected person). We excluded from comparisons the strategies that exhibited extended or weak dominance relative to the next more effective strategy, in accordance with standard methodology for cost-effectiveness analysis. 18 Although the main summary measure for economic value was the ICER, we also calculated the average cost-effectiveness ratio (ACER) to compare each strategy with the least effective strategy. We also calculated the average costs per outcome by dividing the total costs by the outcomes in each strategy. We plotted total PPMs and total costs for each strategy on a cost-effectiveness plane. Because of the importance of the status quo strategy in Chuuk’s immunization program activities, we conducted an additional ICER calculation to assess the quarterly routine outreach strategy versus the status quo strategy.
Sensitivity Analyses
We conducted sensitivity analyses to assess the effects of uncertainty on cost-effectiveness estimates. We focused the sensitivity analyses on the cost ($)/PPM outcome measure, because PPM captures the benefits of vaccination timeliness. 15 In particular, early or on-time vaccination would confer more PPMs than delayed vaccination but could confer equivalent doses or protected people. We conducted univariate sensitivity analyses by using low-range and high-range values for the following inputs: first and second dose MMR vaccine coverage for each event type, event costs, vaccine dose cost, discount rate, population, and an alternative status quo strategy. We developed an alternative status quo strategy to assess outcomes of interest by starting the status quo strategy with a year of routine outreach events, so that the strategy would have routine outreach events in years 1, 3, and 5 and have catch-up campaign events in years 2 and 4. We developed the ranges for routine outreach event coverage and costs on the basis of the range of number of routine outreach events that occurred in 2018. We used the increase in coverage from the 2019 campaign as the base case estimate for catch-up campaign event coverage. We developed upper and lower estimates for catch-up campaign coverage and cost inputs on the basis of the ranges that were calculated for routine outreach coverage (eTable 1 in Supplemental Material). To determine the range of costs and coverages for catch-up campaign events, we applied the percentage deviation between the range input values and the base case values of routine outreach events to the catch-up campaign base case values. We presented results for sensitivity analyses as a tornado diagram.
Results
The total cost varied across strategies, with costs of the biannual routine outreach of $242 575, annual catch-up campaign of $421 053, status quo of $437 983, and quarterly routine outreach of $463 521 (Table 2). Quarterly routine outreach was the most effective strategy, resulting in 2351 protected children, which was 208 more protected children than the next most effective strategy, status quo. Biannual routine outreach was the least effective strategy with the fewest PPM, doses administered, and protected children. Across strategies, the total PPM was estimated to be 29 953 for biannual routine outreach, 48 134 for annual catch-up campaign, 54 088 for status quo, and 61 089 for quarterly routine outreach (Table 2). More effective strategies had lower ACERs. The ACERs were $9.82 per PPM for annual catch-up campaign (vs biannual routine outreach), $8.10 per PPM for status quo (vs biannual routine outreach), and $7.10 per PPM for quarterly routine outreach (vs biannual routine outreach). For ICER calculations, annual catch-up campaign and status quo were excluded based on extended dominance (or weak dominance) (Table 2; Figure 1). After the extended dominated strategies were removed, the ICER for quarterly routine outreach (vs biannual routine outreach) was estimated to be $7.10 per PPM, which was equal to the quarterly routine outreach ACER (Table 2). When the quarterly routine outreach strategy was directly compared with the status quo strategy, the ICERs associated with quarterly routine outreach were $3.65 per PPM, $193.47 per dose administered, and $122.78 per protected person (Table 3).
Costs, vaccination outcomes, and cost-effectiveness estimates for 4 measles, mumps, and rubella vaccination outreach strategies during a 5-year period, Chuuk, Federated States of Micronesia a
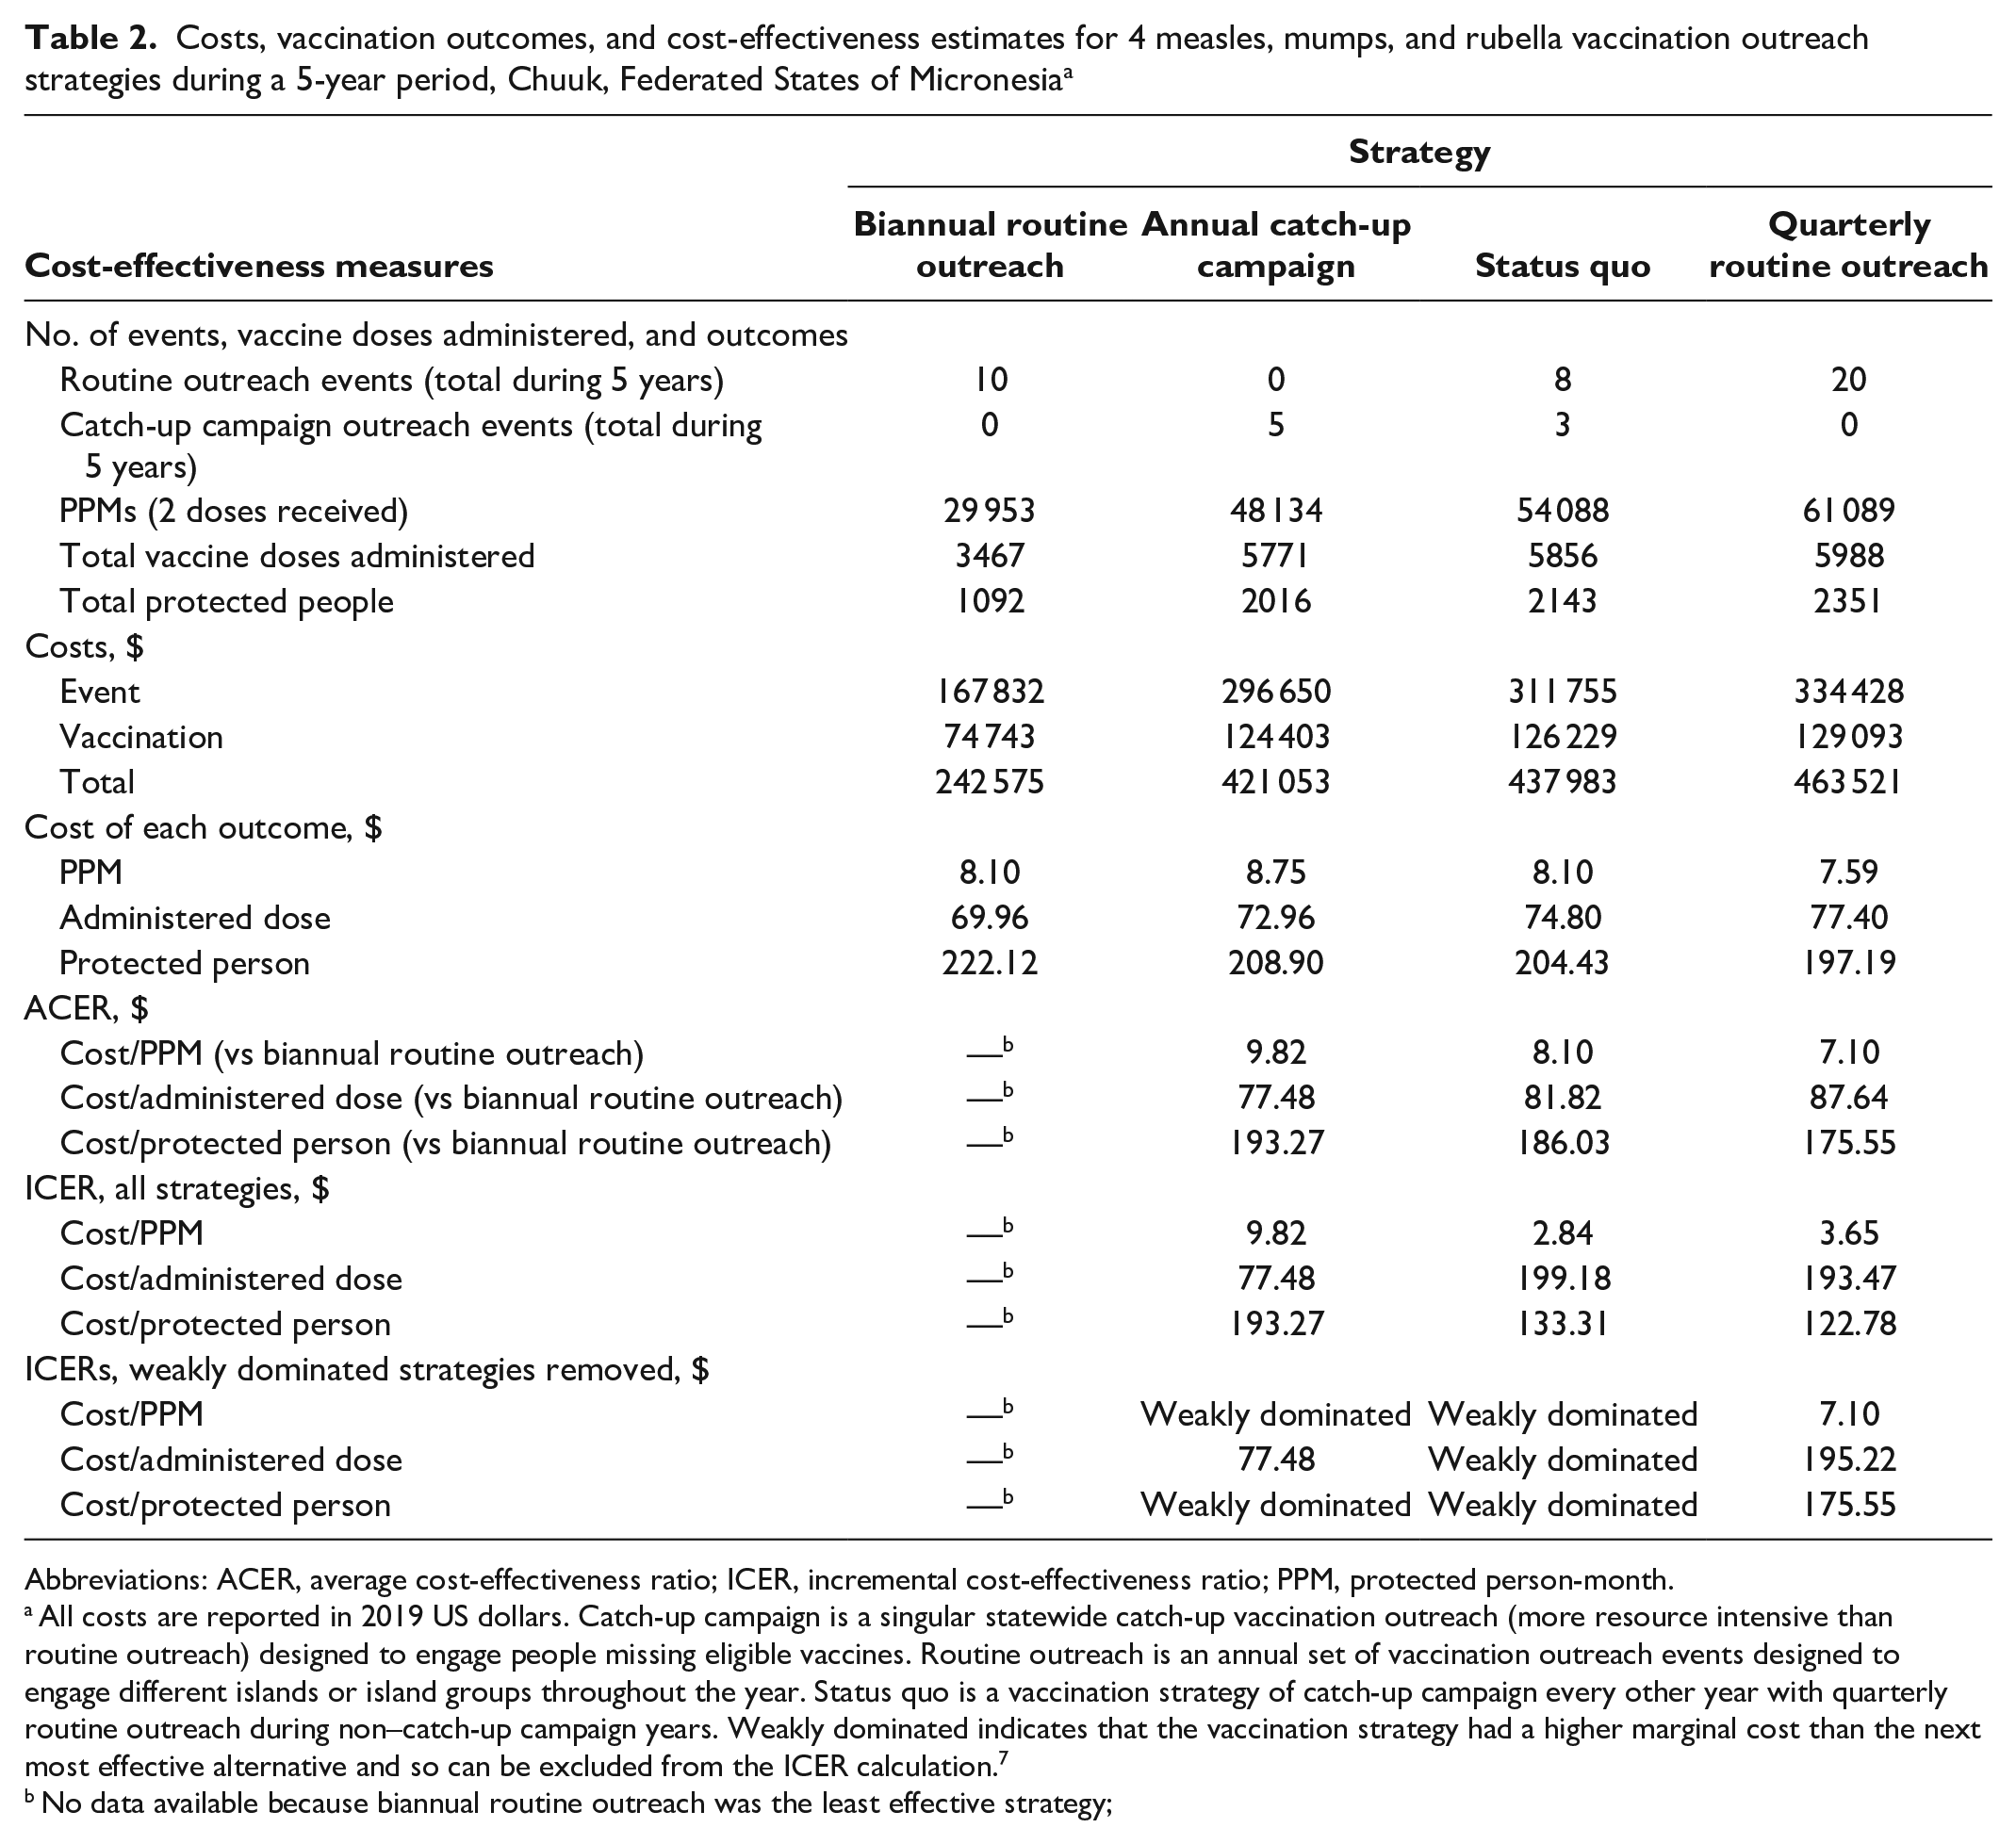
Abbreviations: ACER, average cost-effectiveness ratio; ICER, incremental cost-effectiveness ratio; PPM, protected person-month.
All costs are reported in 2019 US dollars. Catch-up campaign is a singular statewide catch-up vaccination outreach (more resource intensive than routine outreach) designed to engage people missing eligible vaccines. Routine outreach is an annual set of vaccination outreach events designed to engage different islands or island groups throughout the year. Status quo is a vaccination strategy of catch-up campaign every other year with quarterly routine outreach during non–catch-up campaign years. Weakly dominated indicates that the vaccination strategy had a higher marginal cost than the next most effective alternative and so can be excluded from the ICER calculation. 7
No data available because biannual routine outreach was the least effective strategy;
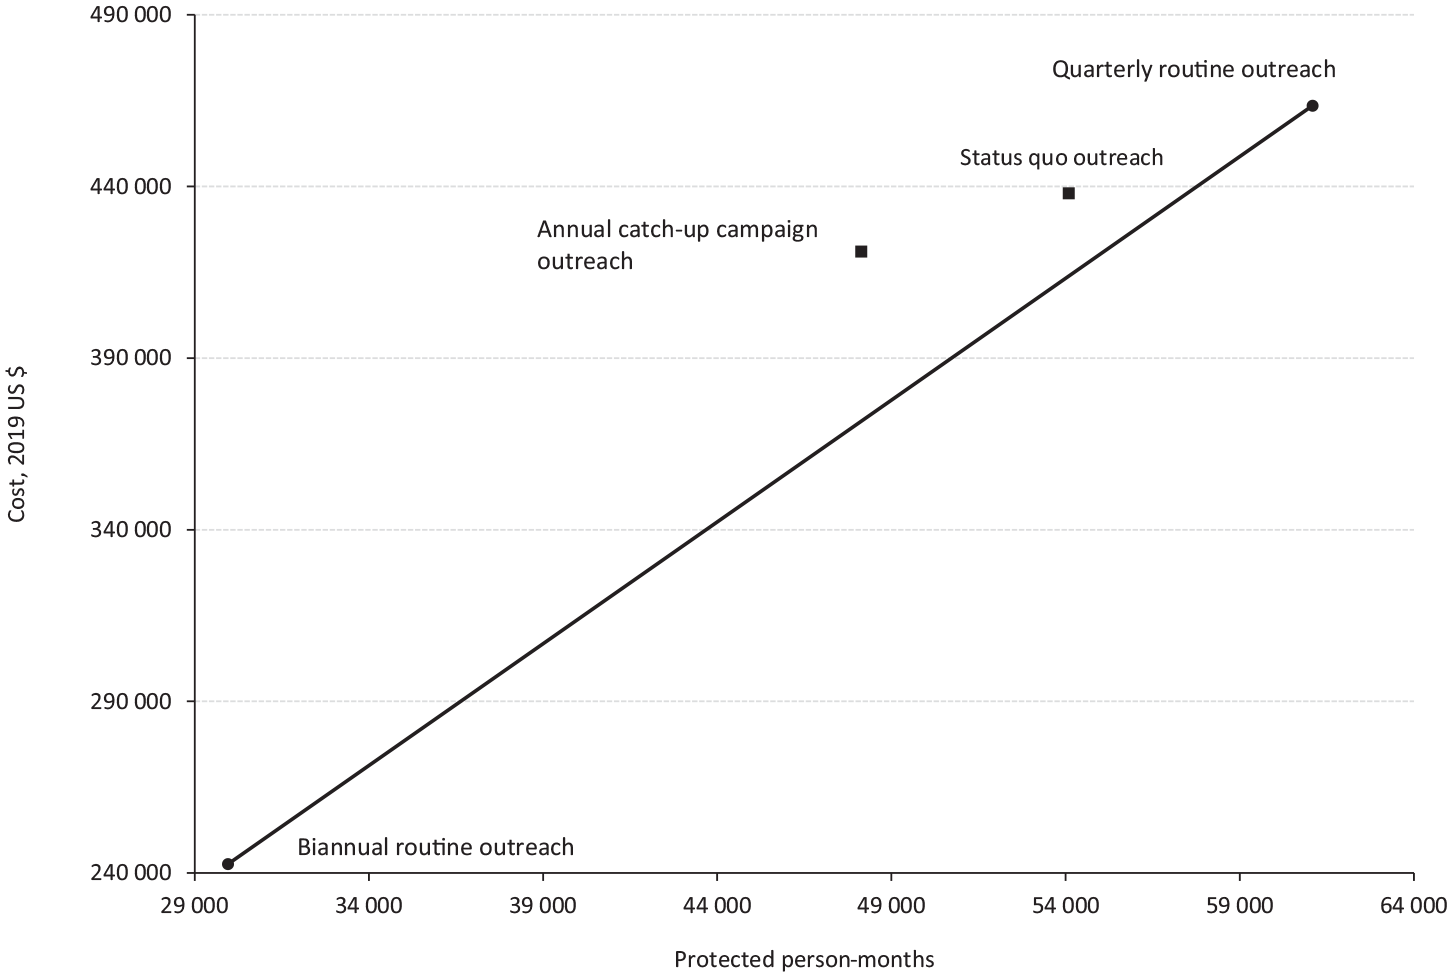
Cost-effectiveness assessed in terms of costs (in 2019 US dollars) per protected person-month for 4 measles, mumps, and rubella vaccination outreach strategies during a 5-year period, Chuuk, Federated States of Micronesia. Black squares represent extended (or weakly) dominated strategies (ie, a vaccination strategy with a higher marginal cost than the next most effective alternative). Catch-up campaign is a singular statewide catch-up vaccination outreach designed to engage people missing eligible vaccines. Routine outreach is an annual set of vaccination outreach events designed to engage different islands or island groups throughout the year. Status quo is a vaccination strategy of catch-up campaign every other year with quarterly routine outreach during non–catch-up campaign years.
Costs, vaccination outcomes, and cost-effectiveness estimates for measles, mumps, and rubella vaccination strategies (quarterly routine outreach vs status quo) during a 5-year period, Chuuk, Federated States of Micronesia a
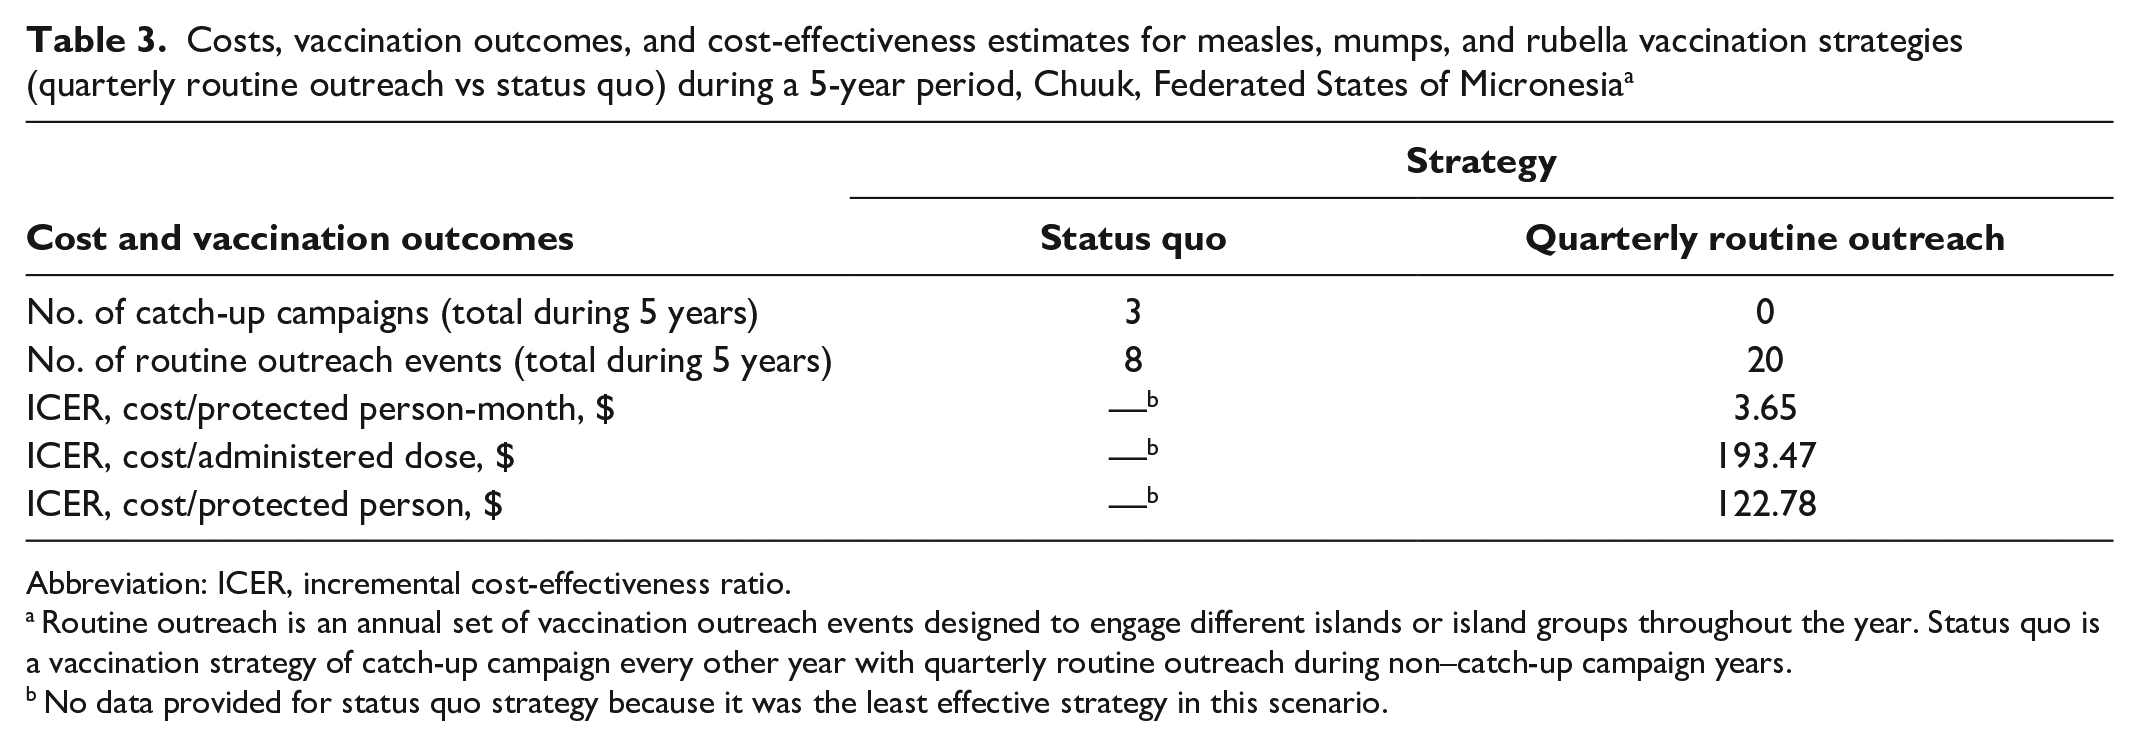
Abbreviation: ICER, incremental cost-effectiveness ratio.
Routine outreach is an annual set of vaccination outreach events designed to engage different islands or island groups throughout the year. Status quo is a vaccination strategy of catch-up campaign every other year with quarterly routine outreach during non–catch-up campaign years.
No data provided for status quo strategy because it was the least effective strategy in this scenario.
Sensitivity Analysis
The univariate sensitivity analyses for the value of quarterly routine outreach (vs status quo) showed that the most important inputs in terms of effects on the ICER were catch-up campaign event 2-dose coverage (ie, increase in ≥2-dose MMR coverage from a single event), routine outreach event cost, catch-up campaign event cost, and routine outreach event 2-dose coverage (Figure 2). For the highest input (catch-up campaign event 2-dose coverage), the quarterly routine outreach was dominated by status quo. With the lowest routine outreach event cost or the highest catch-up campaign event cost, the ICER showed a cost savings for quarterly routine outreach versus status quo. When the routine outreach event 2-dose coverage was varied across the full input range, the ICER for quarterly routine outreach (vs status quo) ranged from $2.23 to $12.34 per PPM (Figure 2).
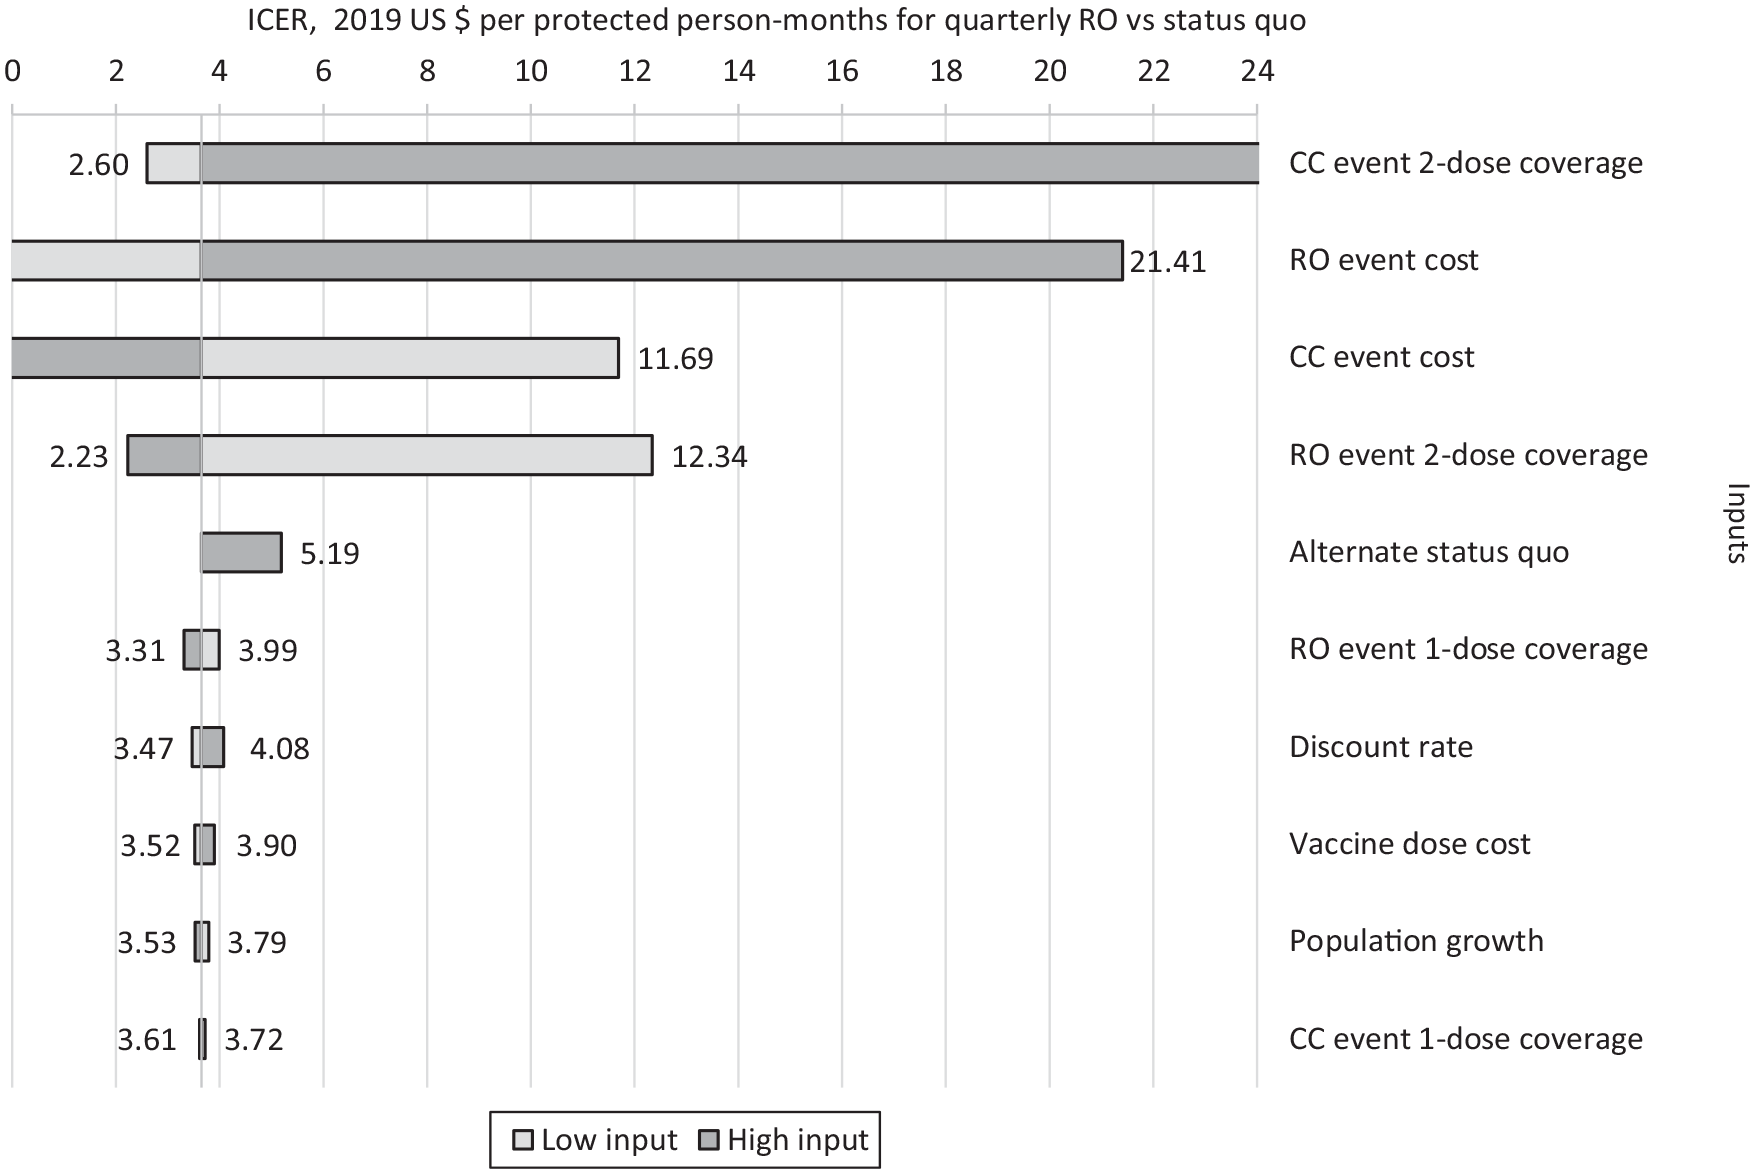
Tornado diagram of sensitivity analysis from the cost-effectiveness model, comparing measles, mumps, and rubella vaccination outreach strategies (quarterly routine outreach [RO] vs status quo) during a 5-year period, Chuuk, Federated States of Micronesia. Diagram shows costs (in 2019 US dollars) per protected person-month (PPM) as inputs are varied. Range values used for each input in the sensitivity analyses are from Table 1. Catch-up campaign (CC) is a singular statewide catch-up vaccination outreach designed to engage people missing eligible vaccines. RO is an annual set of vaccination outreach events designed to engage different islands or island groups throughout the year. Status quo is a vaccination strategy of catch-up campaign every other year with quarterly routine outreach during non–catch-up campaign years. The high-input incremental cost-effectiveness ratio (ICER) for the catch-up campaign event 2-dose vaccination coverage produced an estimate in which status quo dominated the quarterly routine outreach event.
Discussion
In the base case and most of the sensitivity analyses, our model predicted that the quarterly routine outreach strategy was the most effective strategy, yielding more children vaccinated, more vaccine doses administered, and more months of protection for children during a 5-year model period. Importantly, quarterly routine outreach provided the opportunity to increase on-time vaccination, which is reflected in the higher levels of PPM in the quarterly routine outreach strategy compared with the other strategies. An exception to this broad finding was identified in the sensitivity analysis, where the coverage rate associated with catch-up campaign events was set to the highest value. Our sensitivity analysis showed status quo to be dominant relative to quarterly routine outreach, meaning that the status quo strategy yielded greater benefits measured as additional PPM while incurring fewer costs. If the coverage rate, or effectiveness, of the catch-up campaign events was sufficiently high, then the status quo strategy could yield more economically favorable results than the quarterly routine outreach strategy.
Historically, children aged 12 months through 6 years who live on FSM’s outer islands have had low vaccination coverage due to remoteness and limited resources to reach them. Low vaccination coverage has likely contributed to widespread measles and mumps outbreaks in Chuuk and FSM, 10 and such outbreaks have the potential to spread outside FSM’s borders. 20 The cost data used as inputs in the cost-effectiveness model support findings from previous studies that showed catch-up campaigns can be costlier than routine outreach when implemented alone.21,22 Although stand-alone catch-up campaigns may result in more children vaccinated during a single event, if routine outreach events can be conducted more frequently, then more children could be more consistently protected from VPDs during a longer term. With quarterly routine outreach, children who have recently become age-eligible for MMR will likely receive the vaccine in a timelier manner compared with catch-up campaign events, in accordance with recommendations by the Advisory Committee on Immunization Practices and FSM’s National Immunization Program,8,23 thus decreasing the time a child is vulnerable to VPDs. Current outreach strategies have not been successful at achieving the FSM-recommended 95% vaccination coverage target by age 19 months. Conducting more frequent routine outreach or achieving high coverage during catch-up campaign events, particularly for the second dose of MMR, could yield improvements in vaccination coverage, longer-term protection from VPDs, and an improved chance to achieve national vaccination coverage targets.
Limitations and Other Considerations
This study had several limitations. First, despite efforts to obtain the most complete set of program costs for both routine outreach and catch-up campaign events, some costs may have been omitted. As an example, inputs for routine outreach events were based on reported cost data from 2018, which were applied to all years of the model. In practice, reported costs could vary by year. Second, vaccination coverage for routine outreach and catch-up campaign events was also based on a series of calculations applied to IIS data from a single year. Ideally, event-specific data would have been obtained. In general, these modeling limitations related to input uncertainty and data motivated the use of sensitivity analyses and the model validation exercise found in the Supplemental Material.
Some aspects of this modeled system were beyond the current scope of analysis. First, modeling results may not be generalizable to other vaccines; including other vaccine types could favor different outreach strategies. Second, we did not explicitly model disease or health outcomes beyond vaccine-conferred protection, such as VPD cases, health care utilization associated with VPDs, or quality-adjusted life years. Estimating the effects of these additional outcomes is beyond the purview of the local immunization program. In general, vaccine protection may be correlated with improved health outcomes and increased quality-adjusted life years. Third, although the quarterly routine outreach strategy was estimated to be approximately $25 000 more expensive than the status quo strategy, we did not directly evaluate the affordability of any outreach strategies, so the financial feasibility of the strategies remains unknown.
Conclusions
The cost-effectiveness model showed, compared with the status quo vaccination strategies in Chuuk, FSM, the quarterly routine outreach strategy resulted in higher numbers of vaccinated children and PPMs. These additional health benefits are estimated to cost approximately $3 per PPM or $122 per protected person. On the basis of these results, the Chuuk state immunization program could consider conducting quarterly routine MMR outreach events among children aged 12 months through 6 years to improve vaccination coverage, to provide improved levels of vaccine protection, and to reduce the burden of disease from measles. In Chuuk, FSM, which has far-flung outer islands where public health outreach is logistically challenging and expensive, the use of quarterly routine outreach events would improve timing and spacing of MMR doses for children. These results may also have implications for other jurisdictions with dispersed and disproportionately affected populations.
Supplemental Material
sj-docx-1-phr-10.1177_00333549241249672 – Supplemental material for Cost-Effectiveness Analysis of Routine Outreach and Catch-Up Campaign Strategies for Measles, Mumps, and Rubella Vaccination in Chuuk, Federated States of Micronesia
Supplemental material, sj-docx-1-phr-10.1177_00333549241249672 for Cost-Effectiveness Analysis of Routine Outreach and Catch-Up Campaign Strategies for Measles, Mumps, and Rubella Vaccination in Chuuk, Federated States of Micronesia by Mehreen Meghani, Jamison Pike, Ashley Tippins and Andrew J. Leidner in Public Health Reports
Footnotes
Acknowledgements
The authors thank Carter Apaisam, RN, Augustus Elias, BS, and Florine Elimo, MA, FSM Immunization Program and Chuuk State Immunization Program, for assistance with data collection and management in addition to administrative and technical support; and Pedro Judicpa, MPH, Centers for Disease Control and Prevention, for technical assistance and project coordination.
Disclaimer
The findings and conclusions in this article are those of the authors and do not necessarily represent the views of the Centers for Disease Control and Prevention or the US Department of Health and Human Services.
Declaration of Conflicting Interests
The authors declared no potential conflicts of interest with respect to the research, authorship, and/or publication of this article.
Funding
The authors disclosed receipt of the following financial support for the research, authorship, and/or publication of this article: This study was funded by the Centers for Disease Control and Prevention.
Supplemental Material
Supplemental material for this article is available online. The authors have provided these supplemental materials to give readers additional information about their work. These materials have not been edited or formatted by Public Health Reports’s scientific editors and, thus, may not conform to the guidelines of the AMA Manual of Style, 11th Edition.
References
Supplementary Material
Please find the following supplemental material available below.
For Open Access articles published under a Creative Commons License, all supplemental material carries the same license as the article it is associated with.
For non-Open Access articles published, all supplemental material carries a non-exclusive license, and permission requests for re-use of supplemental material or any part of supplemental material shall be sent directly to the copyright owner as specified in the copyright notice associated with the article.