
Abstract
Childhood psychosocial experiences can have a lifelong effect on health. These experiences can be measured together as positive and adverse childhood experiences or individually as positive childhood experiences (PCEs) or adverse childhood experiences. Most research on PCEs has focused on how PCEs promote health outcomes. However, limited research has been conducted on the prevalence of PCEs among adolescents in local areas served by public health departments. The St. Joseph County Department of Health developed a study to test the feasibility of surveillance of PCEs through local public health departments and to establish a prevalence for PCE exposure among a population of urban public-school students in Indiana. We conducted a survey in spring 2022 that collected demographic information on students at 2 high schools and 1 middle school and assessed exposure to PCEs. We assessed prevalence of PCEs on a 5-point Likert scale (0 = never, 1 = rarely, 2 = sometimes, 3 = usually, 4 = always). PCE scores were grouped into low (0-2), medium (3-5), and high (6 or 7). The prevalence of individual PCE items ranged from 35.6% to 86.8%. Among 798 respondents, 189 (23.7%) reported low PCE scores, 396 (49.6%) reported medium scores, and 213 (26.7%) reported high scores. This research demonstrates the feasibility of school-based PCE surveillance and establishes a baseline prevalence of PCE exposure among a population of middle and high school students. These methods are applicable to different contexts and can provide both local health departments and school systems with a new tool to address adverse childhood experiences.
Children’s physical and mental development is understood to be influenced by their social environment. Exposure to adverse childhood experiences (ACEs) increases the risk for poor health outcomes,1-6 whereas exposure to positive conditions (including relationships with trusted adults, close friendships, and safe neighborhoods) promotes improved physical and mental health outcomes.4,5,7-9 For example, children with safe, stable, and nurturing relationships are less likely to report mental distress than children lacking those relationships. 10 Positive experiences at school can promote positive mental health and protect against adversity. 11 The works of Narayan et al 12 and Bethell et al 8 were instrumental in formalizing a construct of positive childhood experiences (PCEs) to measure along with ACEs.12,13 Bethell and colleagues, for example, leveraged the Child and Youth Resilience Measure to identify 7 PCEs and demonstrated a dose–response association with adult depression and adult social and emotional support. 8 Subsequently, research on PCEs as a type of psychosocial exposure has also increased. In a recent systematic review, 9 most studies showed a main effect of PCEs on relational and mental health outcomes, with PCEs likely promoting positive outcomes independent of ACEs, and few studies showed an interaction between ACEs and PCEs, suggesting that PCEs may not moderate the effects of ACEs. However, additional research is needed to clarify the exact relationship between PCEs and ACEs, particularly by using concurrent data.9,10,14,15 Further research and an interdisciplinary focus on PCEs are needed, and public health departments may play a role in monitoring and promoting PCEs in partnership with families, schools, and community-based organizations (CBOs).
Purpose
The purpose of this case study was to test the feasibility of PCE surveillance by a local public health department in partnership with a local school district and to establish the prevalence for PCE exposure among urban public school students.
Methods
St. Joseph County Department of Health (SJCDoH)
SJCDoH serves a population of more than 270 000 people residing in both rural and urban communities in Indiana. Of 92 Indiana counties, St. Joseph County ranks 51st for health outcomes and 74th for social and economic factors. 16 SJCDoH has 60 employees among 8 units, with most serving core public health services, such as food and environmental inspections, immunizations, and vital records. In 2020, SJCDoH recognized growing health disparities between White and non-White residents, leading to the creation of the SJCDoH Health Equity, Epidemiology, and Data unit in July 2020, which developed the current project. In 2021, the SJCDoH conducted in-person discussions about ACEs with leaders of 16 CBOs serving children and families. The SJCDoH team wanted to learn what CBOs knew about ACE science and prevention, how they were responding to ACEs, and how the CBOs perceived the SJCDoH as an ally in ACE prevention. Through discussions, SJCDoH learned that community partners were aware of ACEs but that community partners felt better positioned to increase protective factors than to prevent adversity. The SJCDoH determined that CBOs had a knowledge gap about the nuances of positive and adverse childhood experiences (PACE) science and programming and would benefit from PACE-specific partnership with the SJCDoH. The SJCDoH took on the role of convening practitioners and providing technical support for research and data management, monitoring, and evaluation. A primary output of the new PACE-specific partnership was a spring 2022 pilot program to assess the prevalence of PCEs in selected South Bend Community School Corporation (SBCSC) schools. The Indiana University Institutional Review Board determined the survey to be exempt from formal ethical review because of its focus on public health surveillance, anonymous data, and minimal risk.
School Participation
The participating school district has 4 high schools and 7 middle schools, with 8640 total students in grades 6 through 12. We connected with social workers and principals at 2 of the 4 high schools in fall 2021 to discuss the survey. As social workers and principals expressed interest, the district office engaged and selected 2 high schools and 1 middle school to participate in the pilot study. We sent a link to the survey to each school principal. High school 1 (n = 694 students) and the middle school (n = 451 students) invited all students to complete the survey. High school 2 invited students enrolled in a health class (n = 237 students) to complete the survey. We gave each school 1 week to administer the survey and collected the data during 3 weeks in spring 2022.
Survey Design
The survey contained 2 parts: 8 questions pertaining to sociodemographic information and 7 questions assessing PCEs. The PCE questions were as follows: How often have you (1) felt able to talk to your family about your feelings; (2) felt your family stood by you during difficult times; (3) enjoyed participating in community traditions, such as holidays or cultural celebrations; (4) felt like you belong, or fit in, at school; (5) felt supported by friends; (6) had at least 2 nonparent adults who took genuine interest in you; and (7) felt safe and protected by an adult in your home? For each question, participants could choose 1 of 5 options: (1) never, (2) rarely, (3) sometimes, (4) usually, or (5) always. SJCDoH leadership, SBCSC administrators and social workers, and University of Notre Dame clinical and behavioral psychologists checked the survey for face validity. Ten middle and high school students reviewed the survey for readability and acceptability. We issued the survey (offered in English and Spanish) through Research Electronic Data Capture (REDCap), a secure, web-based software platform.17,18
Students were asked to report their school, grade, age, ethnicity, race, sex and gender, mother’s education level, and father’s education level. For ethnicity, students were asked, “Are you Hispanic?” and could respond yes or no. For race, participants could select any of the following: American Indian or Alaska Native, Asian, Black or African American, Native Hawaiian or Other Pacific Islander, and White. Participants who selected >1 race were recategorized as “>1 race.” For sex and gender, participants could select male, female, transgender, nonbinary, or other. The survey asked participants the following questions about parental education: “What is the highest level of education completed by your mother?” and “What is the highest level of education completed by your father?” For these 2 questions, participants could select middle school, high school, college degree, or other/unknown.
Data Analysis
We used SPSS Statistics for Windows version 28 (IBM Corp) for statistical analysis. We summarized descriptive statistics for continuous variables as means and categorical variables as frequencies and percentages. For calculation of prevalence of PCEs, we counted responses of “usually” and “always” as having a PCE and “never,” “rarely,” and “sometimes” as not having a PCE, in accordance with prior literature. 8 We converted responses to an individual score ranging from 0 to 7. We then categorized scores into 3 groups: low PCE level (score of 0-2), medium PCE level (score of 3-5), and high PCE level (score of 6 or 7). We also provided school administrators an opportunity to report any technical issues or need for interventions to support student well-being.
Outcomes
Feasibility
Of 1382 students who were offered the survey, 824 (59.6%) returned the survey: 358 of 694 students (51.6%) responded from high school 1, 207 of 237 students (87.3%) responded from high school 2 (health class only), and 233 of 451 students (51.7%) responded from the middle school. Of 824 submitted surveys, 26 (3.2%) were incomplete and were excluded from analysis: 12 were missing data on race, 2 had an incorrect school name, 2 were missing data on age and/or grade, 2 had all races marked, and 8 had missing PCE data. A high percentage of surveys had missing or unknown data on parents’ education; these responses were combined with the response of “other.” Of 824 students who returned surveys, 798 (96.8%) completed the survey. The mean and median survey response times were 10 minutes (with 3 outliers) and 5 minutes, respectively. No technology issues or need of interventions for student well-being was reported.
Demographic Characteristics
Survey participants had a mean age of 15.2 years. Of the 798 participants, 410 (51.4%) identified as White, 228 (28.6%) as Black, 99 (12.4%) as multiracial, 27 (3.4%) as American Indian or Alaska Native, 19 (2.4%) as Asian, and 15 (1.9%) as Native Hawaiian or Pacific Islander; 199 participants (24.9%) identified as Hispanic. Participants self-reported sex or gender as follows: 352 were male (44.1%), 368 were female (46.1%), 17 were transgender (2.1%), 40 were nonbinary (5.0%), and 21 were other (2.6%) (Table 1).
Demographic characteristics and positive childhood experiences (PCEs) of high school and middle school survey participants, St. Joseph County, Indiana, 2022 a
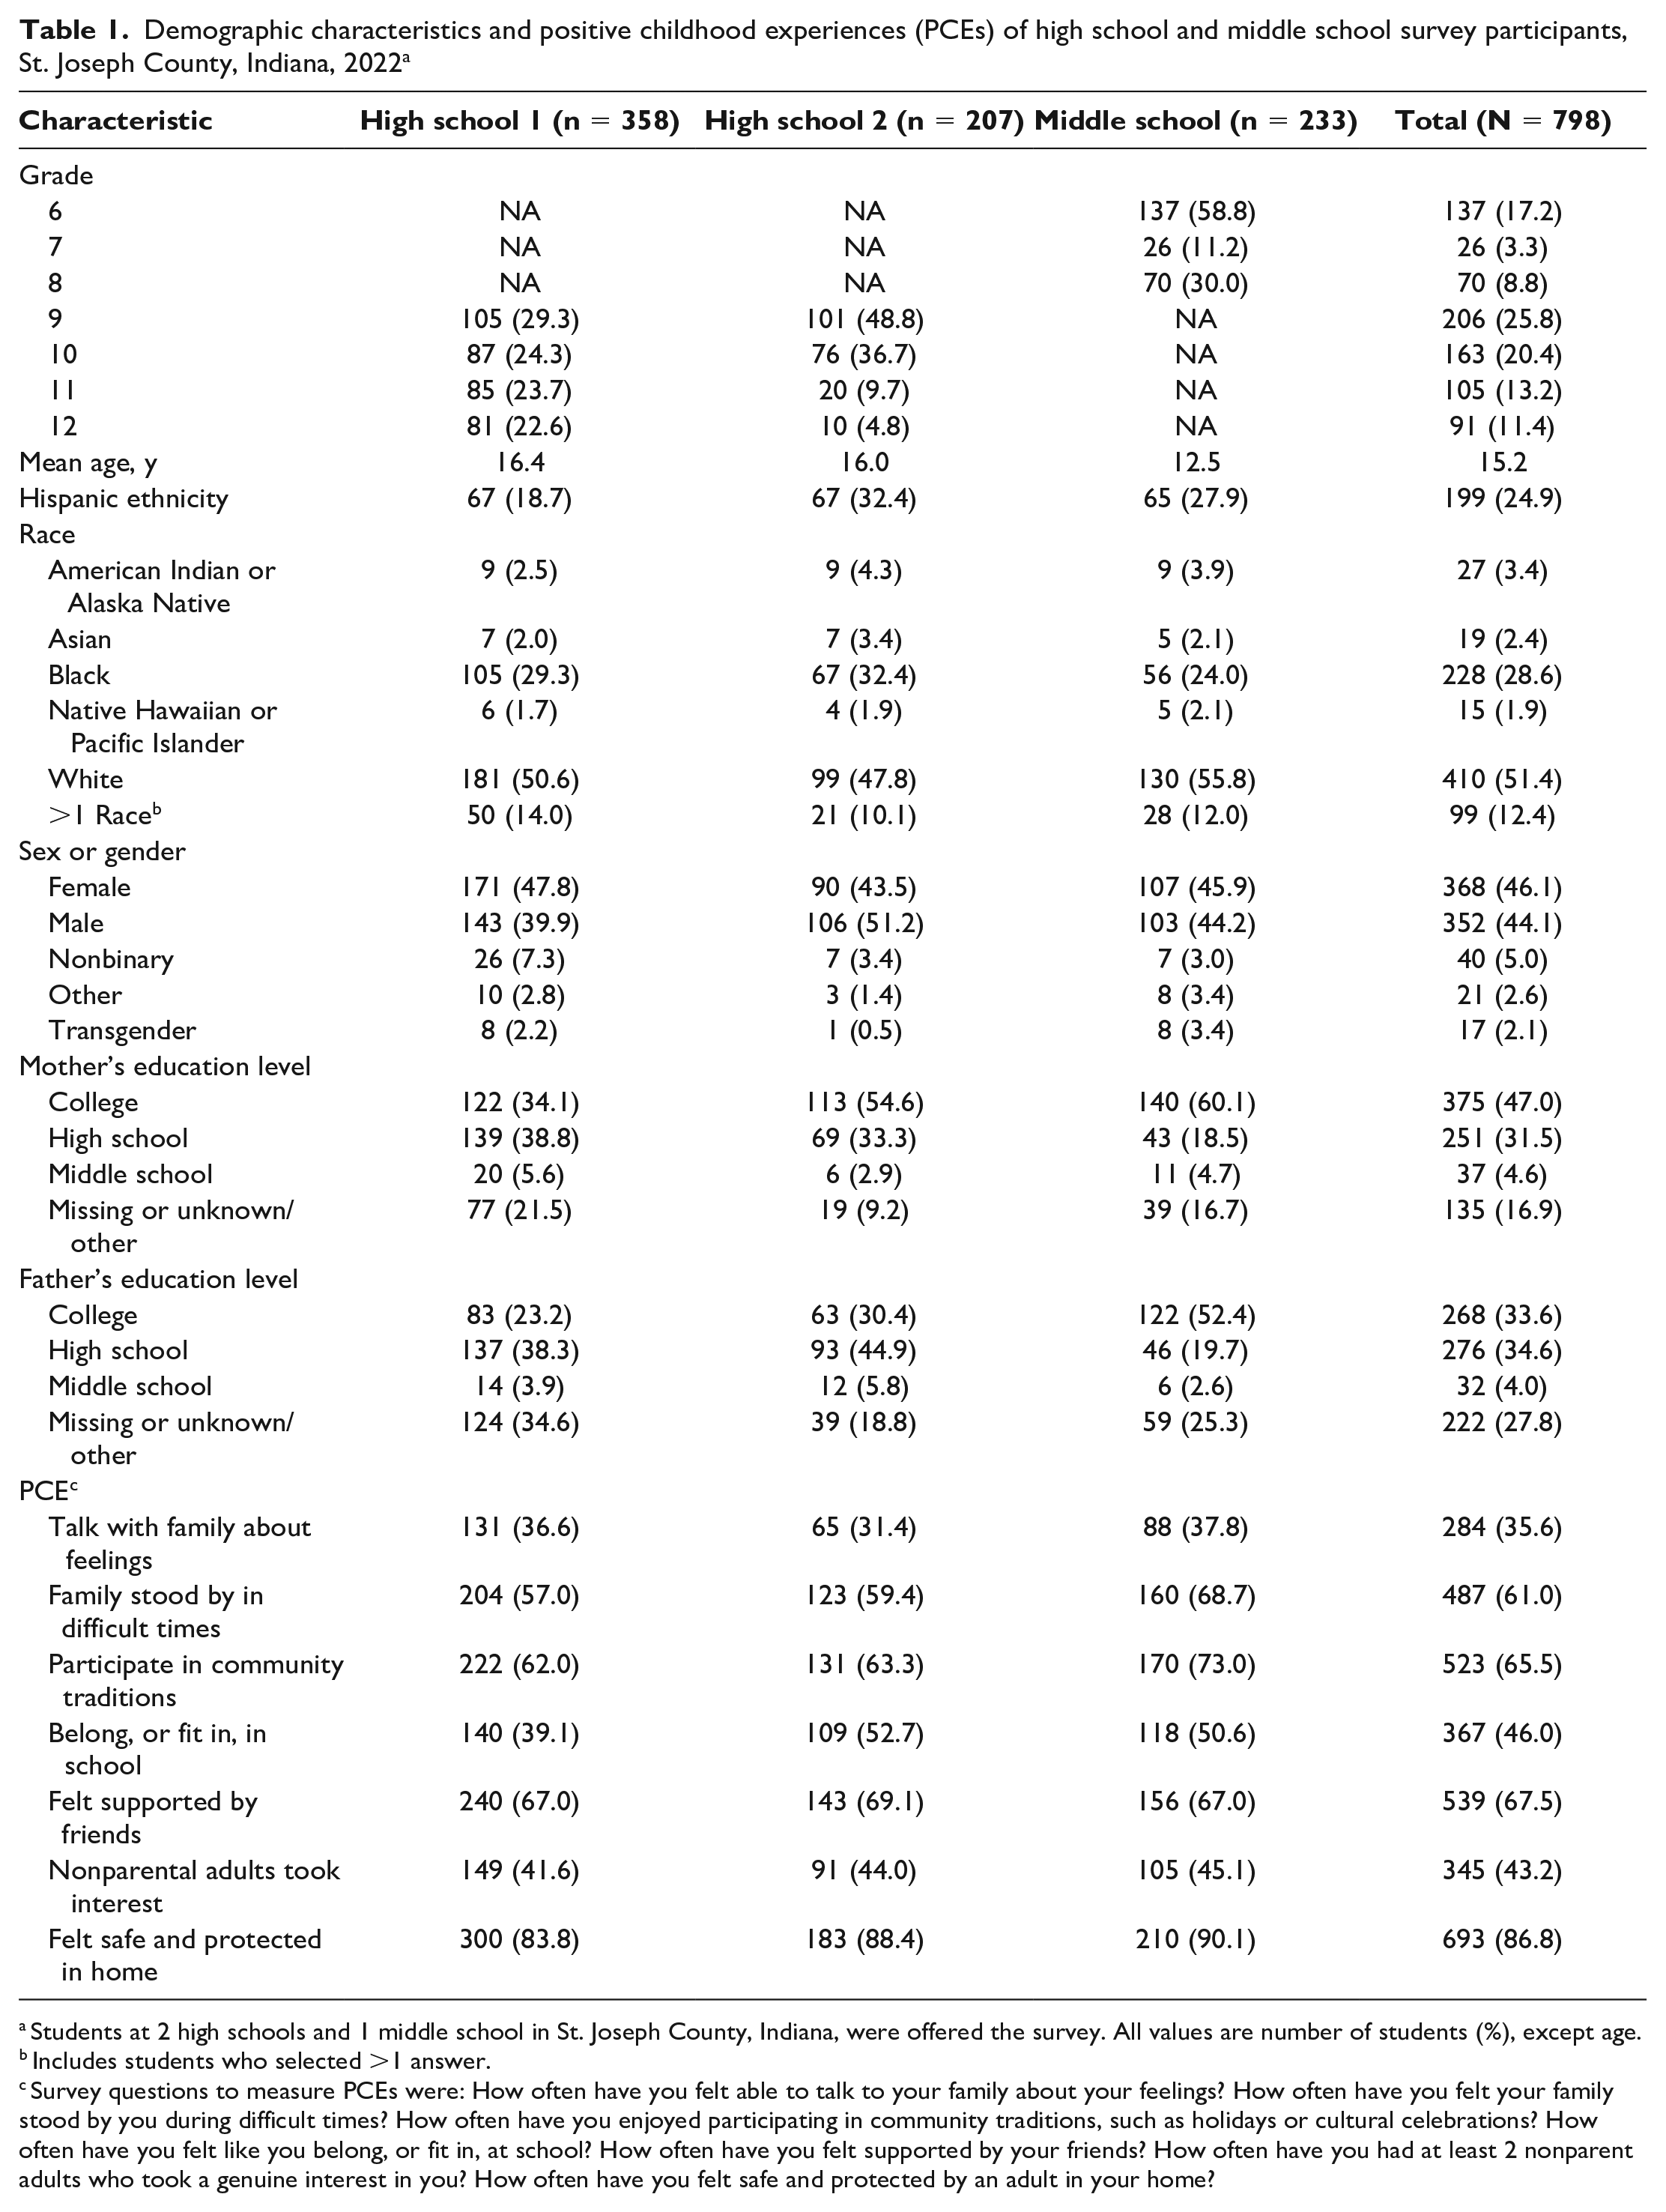
Students at 2 high schools and 1 middle school in St. Joseph County, Indiana, were offered the survey. All values are number of students (%), except age.
Includes students who selected >1 answer.
Survey questions to measure PCEs were: How often have you felt able to talk to your family about your feelings? How often have you felt your family stood by you during difficult times? How often have you enjoyed participating in community traditions, such as holidays or cultural celebrations? How often have you felt like you belong, or fit in, at school? How often have you felt supported by your friends? How often have you had at least 2 nonparent adults who took a genuine interest in you? How often have you felt safe and protected by an adult in your home?
Prevalence of PCEs
The prevalence of individual PCE items for the total sample ranged from 35.6% to 86.8% (Table 1). Of 798 participants, 693 (86.8%) reported feeling safe and protected by an adult in their home, 539 (67.5%) reported feeling supported by friends, 523 (65.5%) reported that they participated in community traditions, 487 (61.0%) reported having family who stood by them in difficult times, 367 (46.0%) reported fitting in at school, and 345 (43.2%) reported having at least 2 nonparental adults who took interest in them. Only 284 participants (35.6%) reported being able to talk with their family about their feelings. Of 798 participants, 189 (23.7%) had a low PCE score, 395 (49.5%) had a medium PCE score, and 213 (26.7%) had a high PCE score (Table 2).
Characteristics of high school and middle school survey participants according to low (score of 0-2), medium (score of 3-5), or high (score of 6 or 7) level of positive childhood experiences (PCEs), St. Joseph County, Indiana, 2022 a
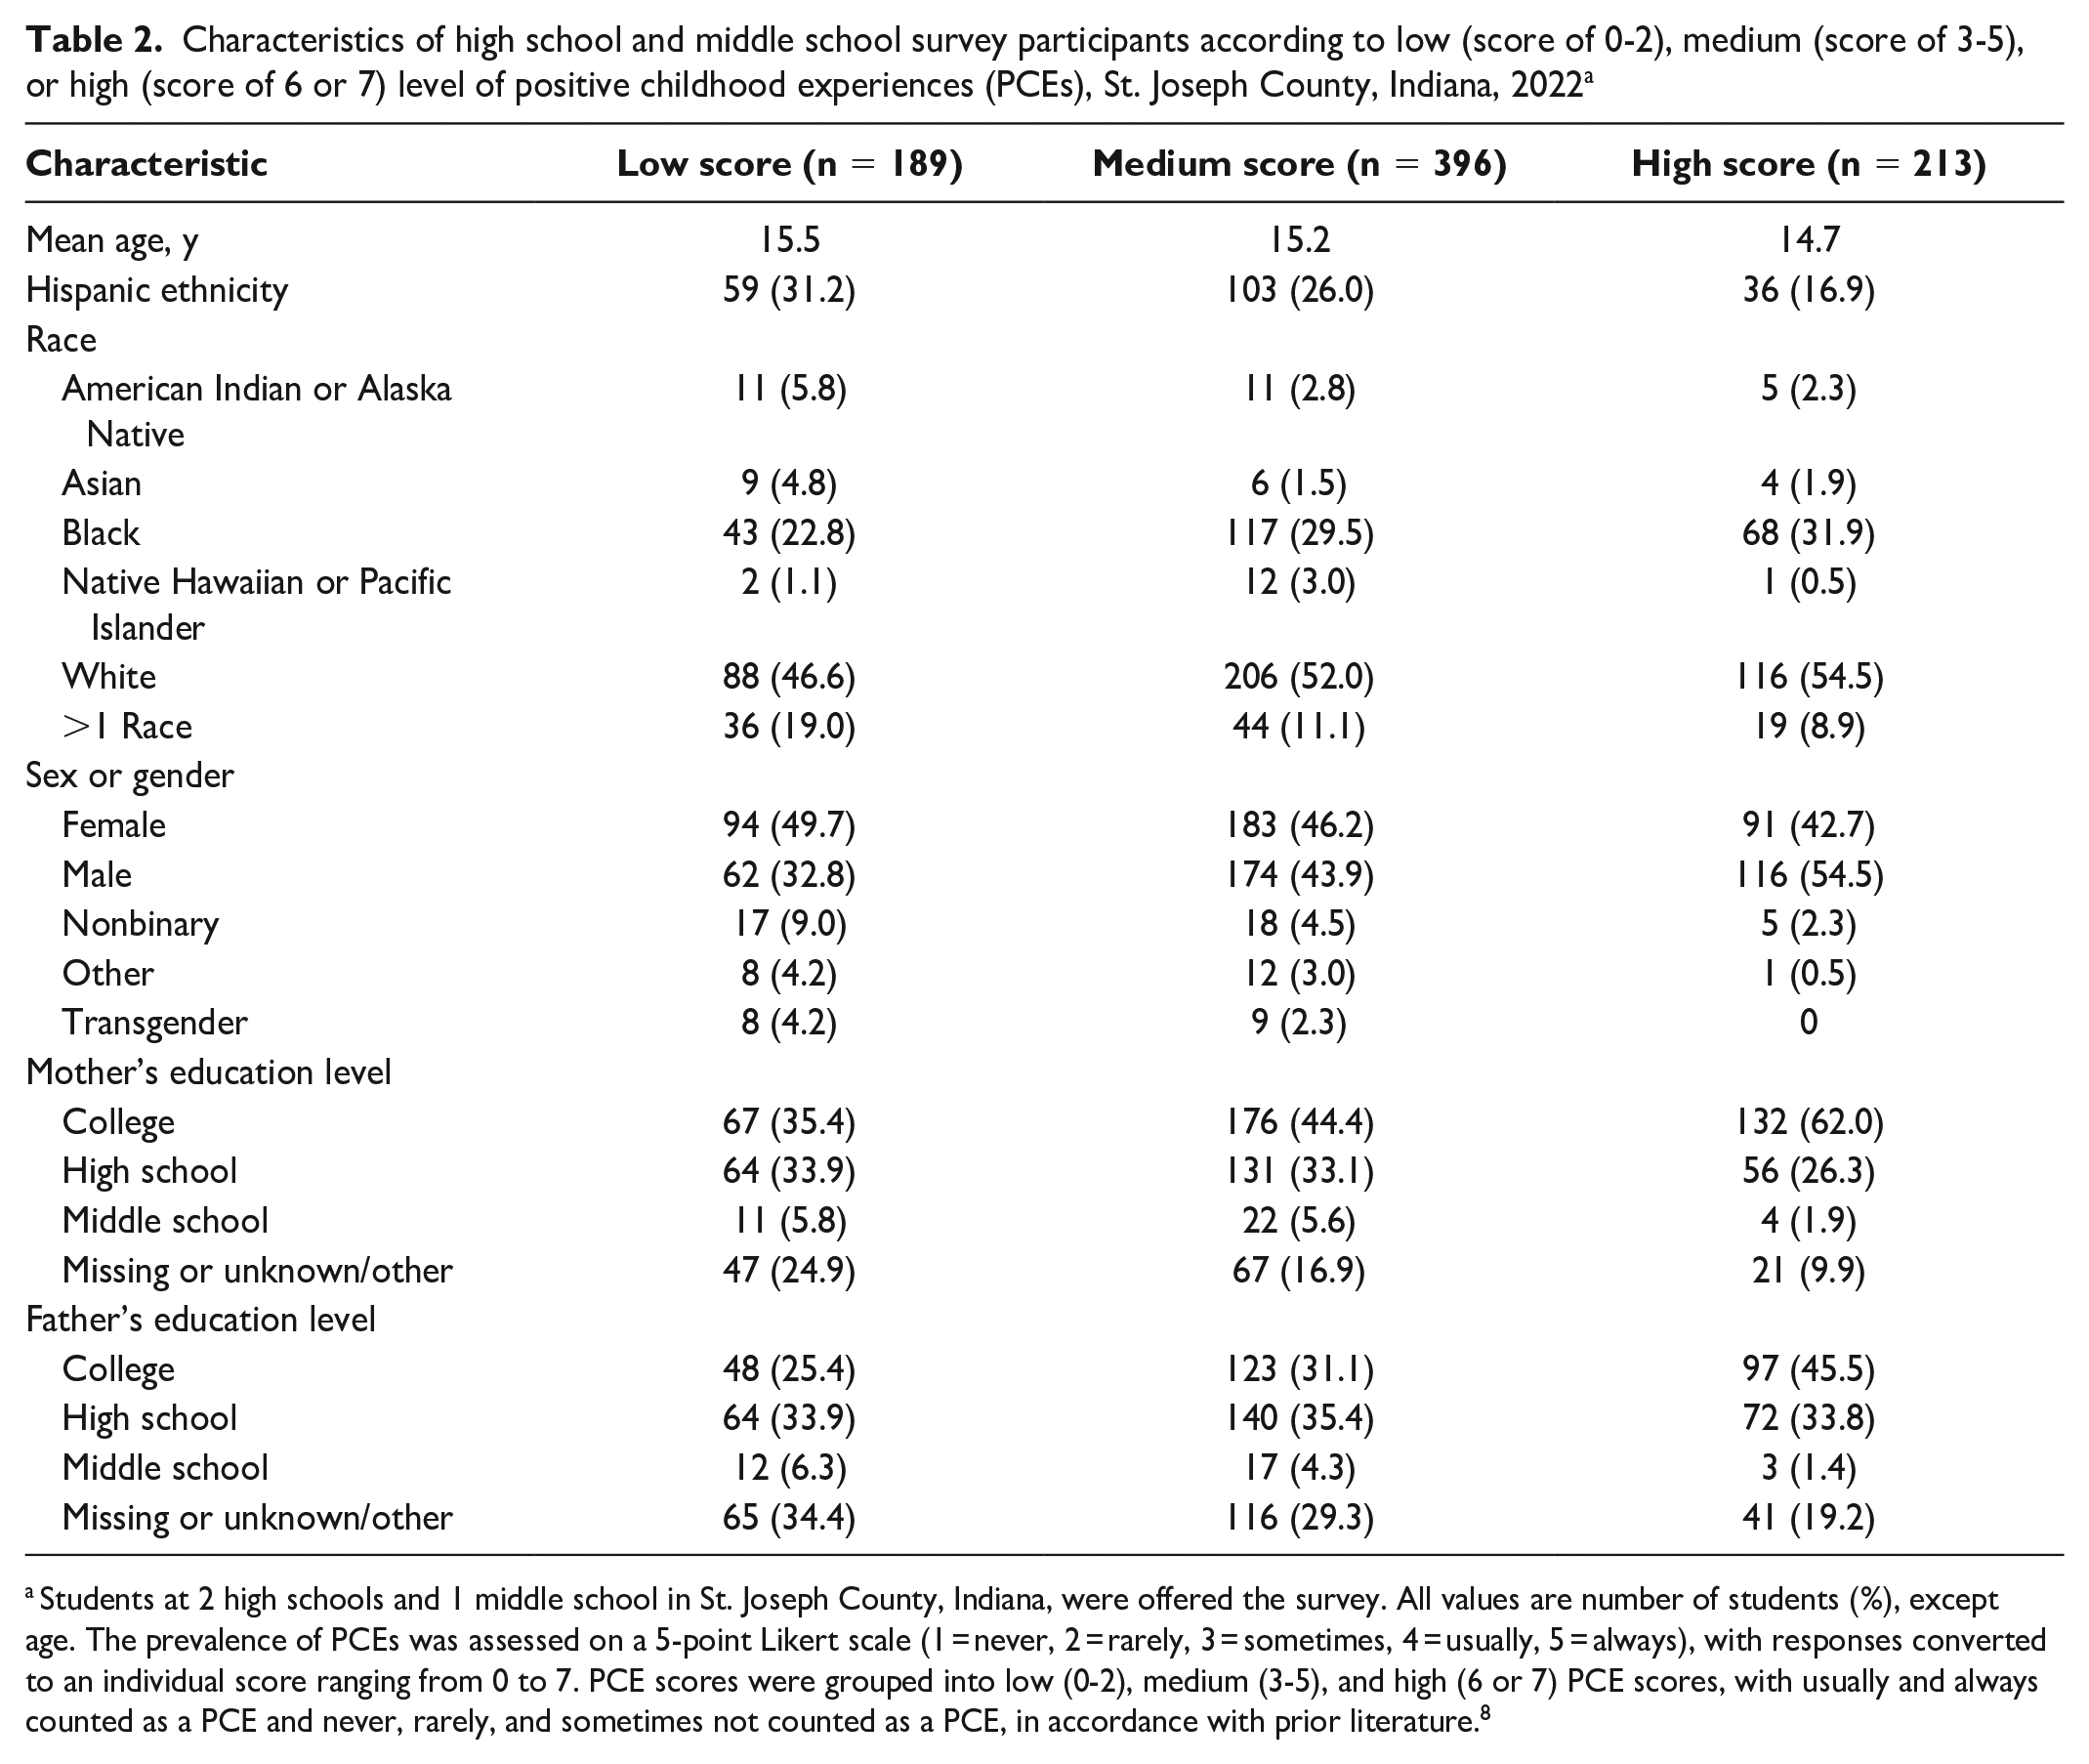
Students at 2 high schools and 1 middle school in St. Joseph County, Indiana, were offered the survey. All values are number of students (%), except age. The prevalence of PCEs was assessed on a 5-point Likert scale (1 = never, 2 = rarely, 3 = sometimes, 4 = usually, 5 = always), with responses converted to an individual score ranging from 0 to 7. PCE scores were grouped into low (0-2), medium (3-5), and high (6 or 7) PCE scores, with usually and always counted as a PCE and never, rarely, and sometimes not counted as a PCE, in accordance with prior literature. 8
Lessons Learned
When sharing the pilot results with school systems, we discussed interventions that could take place in schools and target PCE items with low prevalence. For example, we found that feelings of belongingness is an area that could be improved by school systems, as evidenced by lower PCE scores for feelings of belongingness among participants compared with the other PCE items. The PCE surveillance also generated interest in a district-wide survey for fall 2023, with the addition of questions on perceptions of substance use and actual substance use.
Our case study, which to our knowledge is the first PCE study designed and implemented by a local public health department, could be replicated by other local public health departments. In the future, SJCDoH can support school leaders interested in system change through survey development and measurement of intended outcomes. The following sections outline our findings on the feasibility of the study and the limitations of existing data on the prevalence of PCEs. In addition, we describe some of the organizational and structural factors that helped the SJCDoH build a research relationship with SBCSC: a strengths-based approach, supportive leadership, the use of timely and relevant data, and persistence in the face of logistical challenges and competing priorities.
Feasibility
This case study demonstrates the feasibility of PCE surveillance by a local public health department in partnership with a school system, as measured by the response rate and the average time needed to complete the survey. Our response rate (59.6%) was lower than response rates to the Youth Risk Behavioral Surveillance System (YRBSS) survey (60% to 70%).19,20 However, YRBSS surveys are distributed during multiple waves to improve response rates, and we distributed our survey link only once. In high school 2, the survey link was distributed during a health class where we met with a social worker to review the study information sheet that described the purpose, the expected need, and the voluntary nature of the survey, which was presented at the beginning of each survey. This focused release and direct communication likely contributed to a higher response rate at high school 2 than at the other 2 schools. Future survey distribution should consider a classroom methodology or multiple releases.
Need for Benchmarking and Further Research
This case study establishes a baseline prevalence for exposure to PCEs among students in 3 urban public schools with diverse racial and ethnic minority populations. Because PCE surveillance and research is in its infancy, information on best practices is limited. In the study by Bethell et al, 8 a measurement tool for PCEs demonstrated that PCEs mitigated the effects of ACEs on adult mental health. PCE research continues to evolve, but empirical research that measures the prevalence of PCEs among adolescents is rare. Rather, most leading PCE research asks adults to reflect back on their childhood. The study by Bethell et al, 8 which used statewide data from an adult population, found higher prevalence rates of PCEs than the rates in our study (low, 13.2%; medium, 34.5%; and high, 52.3%). It is unclear how lived experiences and recall bias might influence reported rates of PCEs. Qu et al 21 also examined PCEs, specifically the relationship between concurrent PCE exposure and depression and anxiety among adolescents in China. Rates of PCE exposure were 27.2% for low scores, 46.4% for medium scores, and 26.4% for high scores. However, it was not clear how developmental trajectories and timing of measurements affected outcomes. Neither of the previous studies reported the prevalence of individual PCE items, which may be sensitive to programmatic changes.
Strengths-Based Approach
CBOs welcomed the addressing of community issues through a strengths-based approach (ie, measuring PCEs). CBOs felt ACEs were too recalcitrant to be a focus of programmatic change, and the CBOs expressed concern about retraumatization if sensitive questions were asked. Although empirical research has shown minimal risk of retraumatization when participants are asked about their ACEs, 22 CBOs expressed concerns, suggesting a need for trauma-informed trainings for CBOs in addition to PCE surveillance.
The strengths-based approach that we used to measure PCEs was an important factor in developing and sustaining partnership buy-in. However, PCE surveillance should not be considered a replacement for ACE surveillance and response, and PCE surveillance alone is insufficient to prevent and respond to ACEs. In our community, surveillance and prevention of ACEs require additional investment and consideration to build community capacity.
Supportive Leadership and Staff
Given the political realities of local public health departments, scalable and sustainable programs require active support from senior leadership. Promoting PCEs became a new strategic priority area for SJCDoH’s 2020-2024 Strategic Plan. Surveillance efforts require staffing and resources. As such, SJCDoH developed partnerships with 2 academic centers, which provided a public health fellow and analysis support. The public health fellow was low cost, and the analyses were conducted free of charge. Local public health departments often struggle to obtain local data or to customize existing data collection efforts to fit the needs of their community. Our case study showed that local, relevant data can be collected, have a low cost, and be minimally invasive for schools, suggesting that the methodology would be sustainable over time.
Timely and Relevant Data to Drive Change
State and national surveillance of young people is conducted through the YRBSS, which provides a low-cost way to benchmark a range of psychosocial and behavioral risk and protective factors, including PCE prevalence. However, YRBSS data are rarely available at a county or more granular level, where results may differ from state or national data. In addition, YRBSS PCE surveillance data are delayed; preliminary data are released roughly 2 years after data collection. Participating schools in our pilot surveillance study received individual, school-level reports within 6 weeks. Although this pilot surveillance study provided limited utility for our public health department, given the limited amount of data collected and selection bias, we demonstrated the feasibility of partnerships with schools and the potential to provide timely data, enabling SJCDoH and its partners to create actionable steps at a granular level.
Patience, Persistence, and Understanding Competing Priorities of CBOs
Implementing the survey took patience and an understanding of how school systems work. Many well-intentioned school-based public health interventions strain school resources, including instructional time, facilities, and personnel. Participating in a survey is a time- and resource-intensive requirement that not all schools are able to make. Central to the success of the PCE surveillance was the brevity of the survey and the minimal burden: no teacher training, interventions, or future surveys were required to participate. However, the survey results were meaningful to the schools, resulting in interventions and plans for further data collection. Our process ensured that data were timely and relevant for teachers, social workers, and school administrators.
Footnotes
Declaration of Conflicting Interests
The authors declared no potential conflicts of interest with respect to the research, authorship, and/or publication of this article.
Funding
The authors received no financial support for the research, authorship, and/or publication of this article.