
Abstract
Objectives:
Syndromic surveillance can help identify the onset, location, affected populations, and trends in infectious diseases quickly and efficiently. We developed an electronic medical record–based surveillance algorithm for COVID-19–like illness (CLI) and assessed its performance in 5 Massachusetts medical practice groups compared with statewide counts of confirmed cases.
Materials and Methods:
Using data from February 2020 through November 2022, the CLI algorithm was implemented in sites that provide ambulatory and inpatient care for about 25% of the state. The initial algorithm for CLI was modeled on influenza-like illness: an International Classification of Diseases, Tenth Revision, Clinical Modification (ICD-10-CM) diagnosis code for COVID-19 and an ICD-10-CM diagnosis code suggesting severe lower respiratory tract infection or ≥1 ICD-10-CM diagnosis code for upper or lower respiratory tract infection plus fever. We generated weekly counts of CLI cases and patients with ≥1 clinical encounter and visually compared trends with those of statewide laboratory-confirmed cases.
Results:
The initial algorithm tracked well with the spring 2020 wave of COVID-19, but the components that required fever did not clearly detect the November 2020–January 2021 surge and identified <1% of weekly encounters as CLI. We revised the algorithm by adding more mild symptoms and removing the fever requirement; this revision improved alignment with statewide confirmed cases through spring 2022 and increased the proportion of encounters identified as CLI to about 2% to 6% weekly. Alignment between CLI trends and confirmed COVID-19 case counts diverged again in fall 2022, likely because of decreased COVID-19 testing and increases in other respiratory viruses.
Practice Implications:
Our work highlights the importance of using a broad definition for COVID-19 syndromic surveillance and the need for surveillance systems that are flexible and adaptable to changing trends and patterns in disease or care.
Syndromic surveillance is the strategy of tracking infectious diseases and other conditions of public health interest by using representative indicators—such as International Classification of Diseases, Tenth Revision, Clinical Modification (ICD-10-CM) 1 diagnosis codes for signs and symptoms suggestive of the condition rather than counting cases that meet a specific case definition such as positive laboratory assay—to enhance the timeliness, breadth, and completeness of surveillance. 2 By applying thoughtfully developed algorithms and using appropriate data sources, syndromic surveillance can help detect the onset, location, affected populations, and trajectory of emerging infectious diseases more quickly and more efficiently than monitoring positive laboratory tests or other specific disease indicators alone. 3 Syndromic surveillance has long been a centerpiece of efforts in the United States to identify bioterrorism threats early and is a core constituent of the Centers for Disease Control and Prevention’s (CDC’s) surveillance strategy for influenza via the Outpatient Influenza-like Illness Surveillance Network (ILINet). 4
In February 2020, as the COVID-19 pandemic began in the United States, SARS-CoV-2 testing was limited to a subset of individuals, typically symptomatic individuals with epidemiologic risk factors for SARS-CoV-2 exposure. As it became apparent that SARS-CoV-2 was widespread in the United States, shortfalls in testing capacity compelled many health care systems to limit testing to symptomatic or exposed patients at increased risk for severe disease. To better monitor and understand the COVID-19 epidemic in Massachusetts, we developed a syndromic surveillance strategy for COVID-19–like illness (CLI) by using the Electronic medical record Support for Public health (ESP) public health surveillance platform (www.esphealth.org).5,6 ESP in Massachusetts includes daily electronic medical record (EMR) extracts drawn from 5 clinical practice groups that collectively serve about 25% of the state’s population.
We initially implemented a CLI algorithm based on early case descriptions and modeled after existing algorithms for influenza-like illness (ILI) surveillance.4,7 The initial CLI algorithm required diagnosis codes for lower respiratory tract infection or a combination of diagnosis codes for upper or lower respiratory tract illness and fever (diagnosis code for fever or measured temperature >100 °F). We did so to parallel the traditional approach to ILI surveillance 4 and because fever was believed to be a prominent feature of COVID-19 at the time. 8 After implementation of the algorithm, however, we discovered that components of this strategy were insensitive to major fluctuations in the incidence of laboratory-confirmed COVID-19 cases, the data source against which we compared the performance of the algorithm. We therefore modified the algorithm to be more inclusive. We describe the initial CLI algorithm and how we modified it during the pandemic to better monitor CLI and align with trends in laboratory-confirmed cases.
Materials and Methods
We developed the CLI algorithm by using ESP, an open-source public health surveillance platform that uses automated daily extracts of data from EMR systems to identify and report conditions of public health interest to health departments. ESP maps EMR data to common terms, analyzes these data for reportable conditions, and automatically submits case reports to health departments’ electronic surveillance systems or generates aggregate summaries.5,6,9 -11
The ESP CLI surveillance module was implemented in 5 multisite clinical practice groups in eastern Massachusetts: (1) Atrius Health, an ambulatory care group that primarily cares for a well-insured population of about 700 000 people annually; (2) Boston Medical Center, a 514-bed academic medical center in Boston that provides ambulatory, emergency, and inpatient medical care to about 220 000 people annually and is the largest safety-net hospital in New England; (3) a network of 4 Boston community health centers participating in Boston HealthNet that provide care to about 100 000 low- to middle-income people annually; (4) Cambridge Health Alliance, a safety-net inpatient and outpatient health system for about 200 000 people annually in communities north of Boston; and (5) the Massachusetts League of Community Health Centers, a central data repository on about 400 000 people who receive care from federally qualified health centers throughout the state annually. Combined, these clinical practice groups care for approximately 25% of the population in Massachusetts.
ESP installations in each clinical practice group automatically generated a weekly deidentified dataset that included the number of CLI cases per week stratified by age group, sex, and race and ethnicity; the number of patients and CLI cases with positive COVID-19 molecular test results and/or positive laboratory test results for other respiratory viruses; and the number of patients who had ≥1 clinical encounter at the practice group overall, stratified by demographic groups. We defined clinical encounters by ≥1 of the following: laboratory result, prescription, recorded diagnosis code, vital sign, or immunization.
We modeled our initial algorithm for CLI (Figure 1) on algorithms historically used to track ILI; it used an ICD-10-CM diagnosis code for COVID-19 and a code suggesting severe lower respiratory tract infection (lower respiratory tract infection, bronchitis, pneumonia, acute respiratory distress syndrome, or chest imaging) or ≥1 diagnosis code for upper or lower respiratory tract infection plus fever (measured or coded).
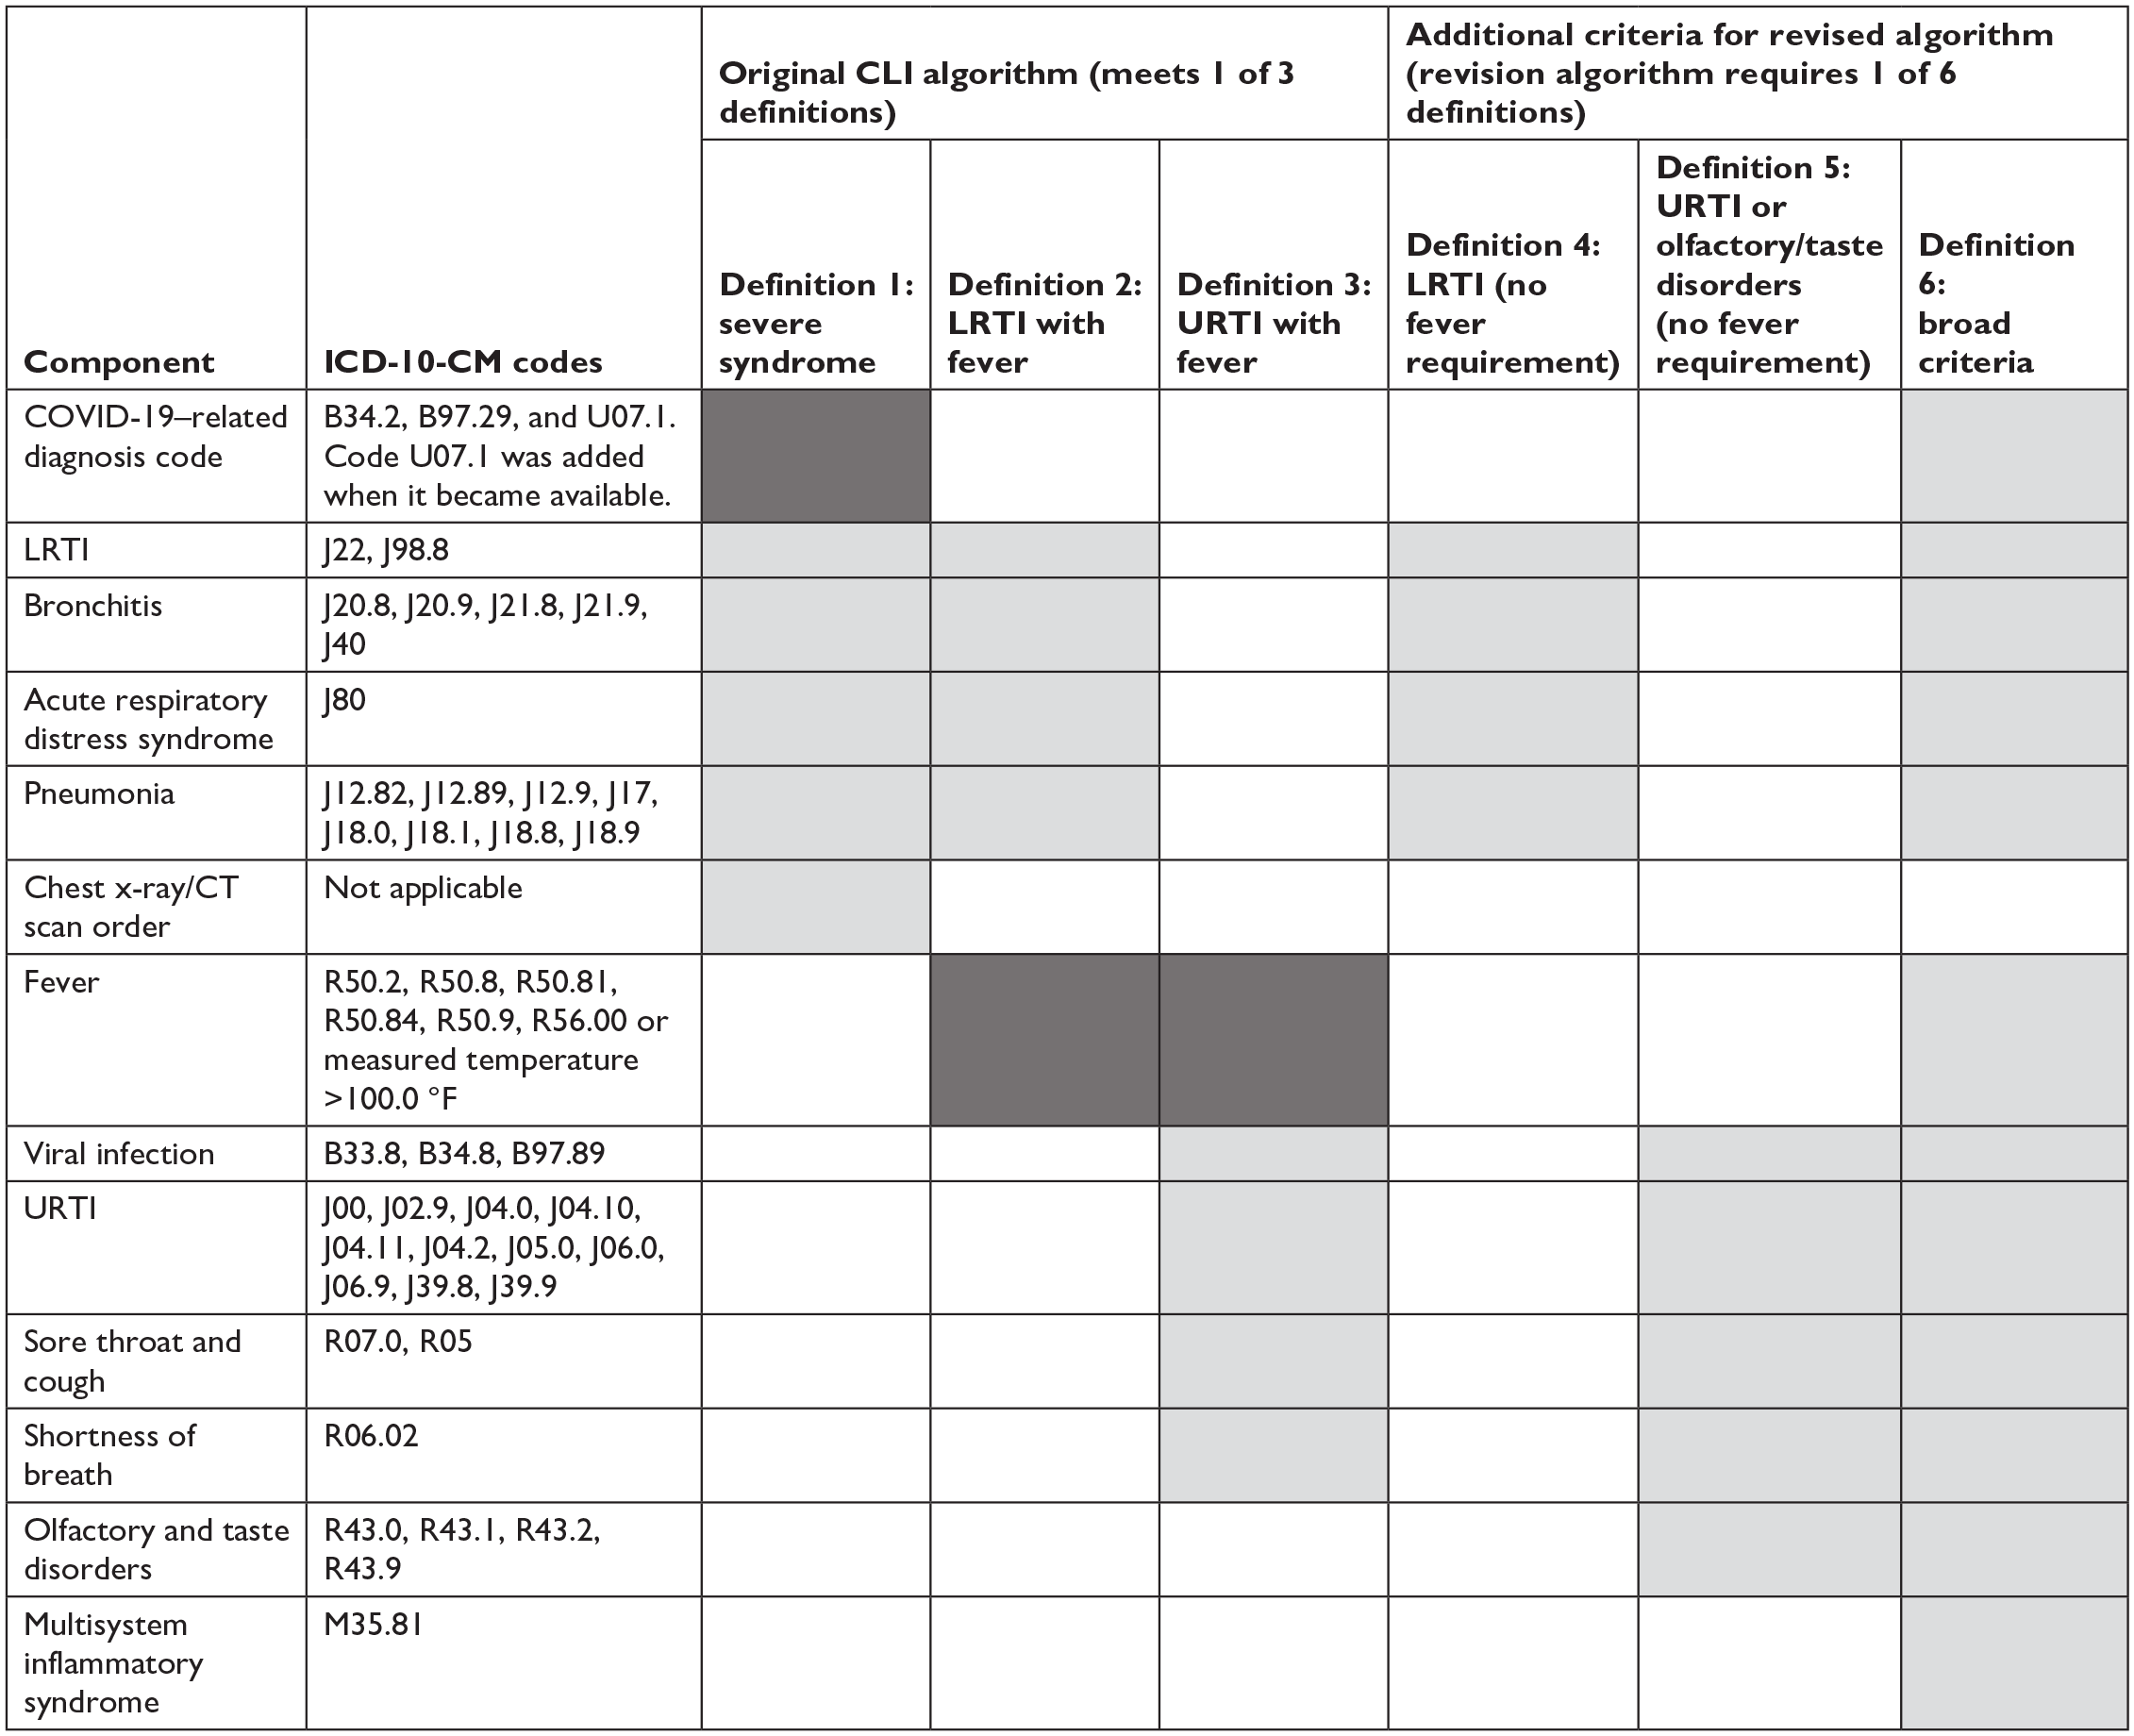
Components of an algorithm for COVID-19–like illness (CLI). Definitions require items in dark shading and at least 1 item in light shading. Clinical encounters that met definitions 1, 2, or 3 were counted as CLI in the original algorithm; clinical encounters that met any definition (1-6) were counted as CLI in the revised algorithm. Abbreviations: CT, commuted tomography; ICD-10-CM, International Classification of Diseases, 10th Revision, Clinical Modification 1 ; LRTI, lower respiratory tract infection; URTI, upper respiratory tract infection.
In April 2020, the initial algorithm was applied to EMR data beginning in February 2020. We then generated prospective weekly reports to monitor CLI activity. We visually compared CLI trends, overall and by component, with statewide laboratory-confirmed weekly incident case counts from the Massachusetts Department of Public Health’s COVID-19 Dashboard. 12 We observed parallel trends in CLI and laboratory-confirmed cases during spring and summer 2020. The alignment between the fever-requiring components of the initial CLI algorithm (proportion of clinical encounters that met the CLI algorithm) and laboratory-confirmed cases was attenuated during fall 2020 and missed the winter 2020/2021 SARS-CoV-2 surge (Figure 2). We hypothesized that this lack of alignment might be due to the algorithm’s emphasis on severe lower respiratory tract illness or the requirement for fever in patients with mild symptoms. We reasoned that these features were rendering the algorithm blind to mild cases of COVID-19, a critical limitation as testing capacity expanded and it became clear that most people with SARS-CoV-2 infection have mild symptoms without fever or no symptoms at all.13 -15 Furthermore, the proportion of encounters that were identified as CLI overall was low, routinely <1%. We consequently modified the CLI algorithm to remove the requirement for fever and added mild symptoms potentially compatible with CLI, including olfactory and taste disorders.
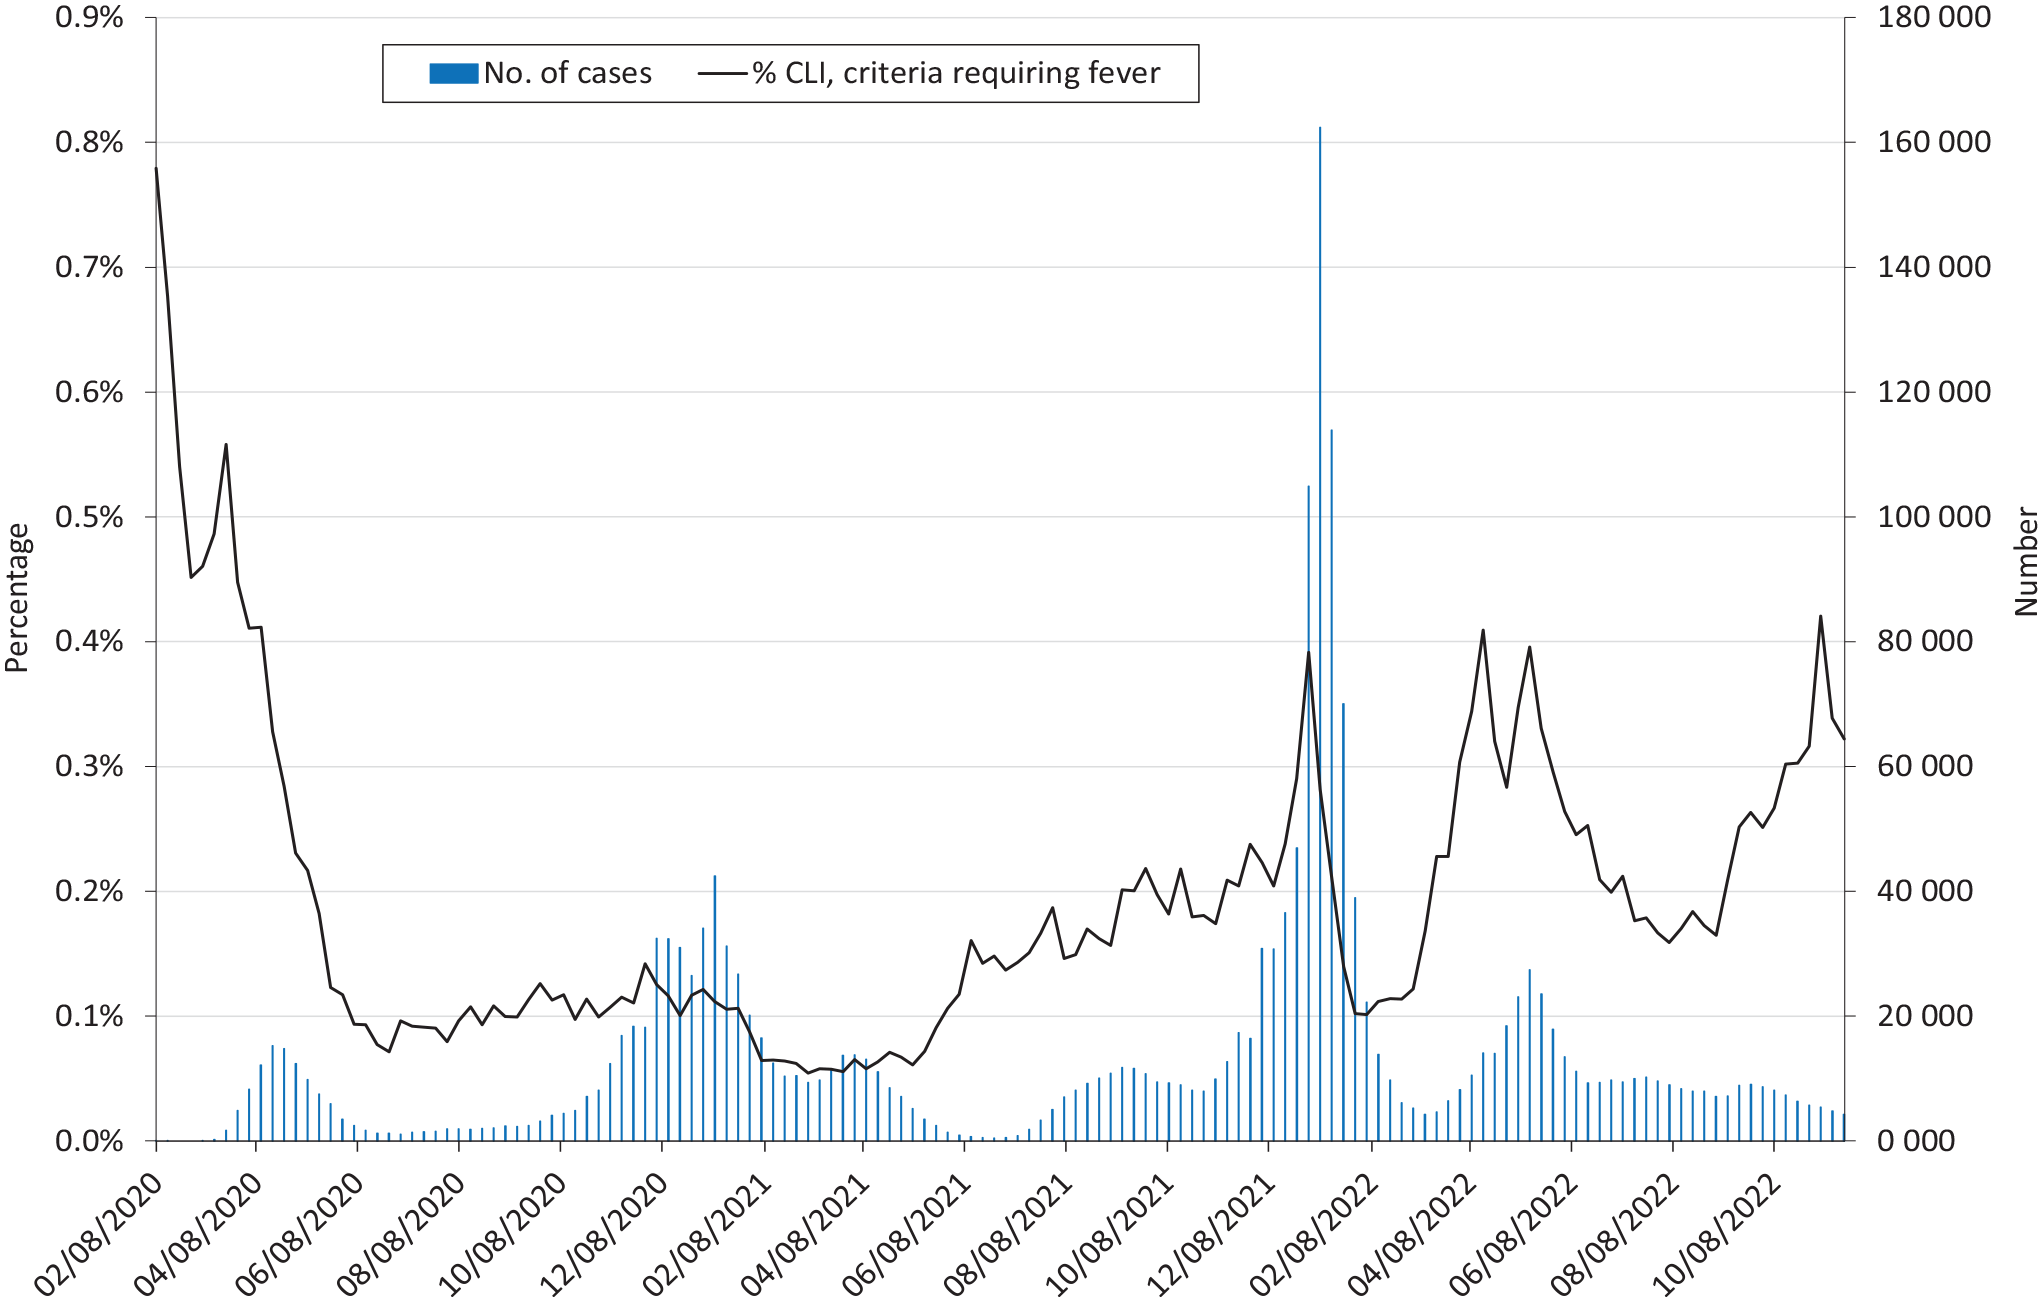
Weekly proportion of patients with COVID-19–like illness (CLI) based on criteria requiring fever versus counts of new confirmed cases of SARS-CoV-2 statewide, Massachusetts, February 2020–November 2022. % CLI refers to the proportion of all clinical encounters per week that met the components of the CLI algorithm requiring fever. Here, CLI is defined as occurrence of a diagnosis code for lower respiratory tract infection and a fever or a diagnosis code for an upper respiratory infection and a fever. The x-axis is the week-ending date. Dates for confirmed cases are the laboratory test date. Dates for CLI are the encounter date. Data source: Electronic medical record data were from the Electronic medical record Support for Public health (ESP) public health surveillance platform (www.esphealth.org). Case counts were statewide laboratory-confirmed weekly incident case counts from the Commonwealth of Massachusetts. 12
This work was performed as public health surveillance and was not subject to institutional review board oversight at the Massachusetts Department of Public Health or Harvard Pilgrim Health Care Institute.
Results
We show the weekly proportion of CLI cases among patients who had diagnosis codes for signs of upper or lower respiratory tract infections and fever versus the number of confirmed new cases in the state (Figure 2). These components of the algorithm tracked well with the spring 2020 wave of cases but did not clearly detect the surge in November 2020 through January 2021, and the algorithm identified <1% of weekly encounters as CLI. We therefore revised the algorithm. The revised algorithm included more mild symptoms and did not rely heavily on the fever requirement. The new algorithm substantially improved alignment with statewide confirmed cases, with concordant peaks from February 2020 through May 2022 (Figure 3). The proportion of encounters identified as CLI was about 2% to 6% weekly with the revised algorithm. More recent surveillance data showed divergence between CLI rates and laboratory-confirmed cases, albeit with an increase in CLI activity in September–November 2022, while confirmed case counts from the same period were low.
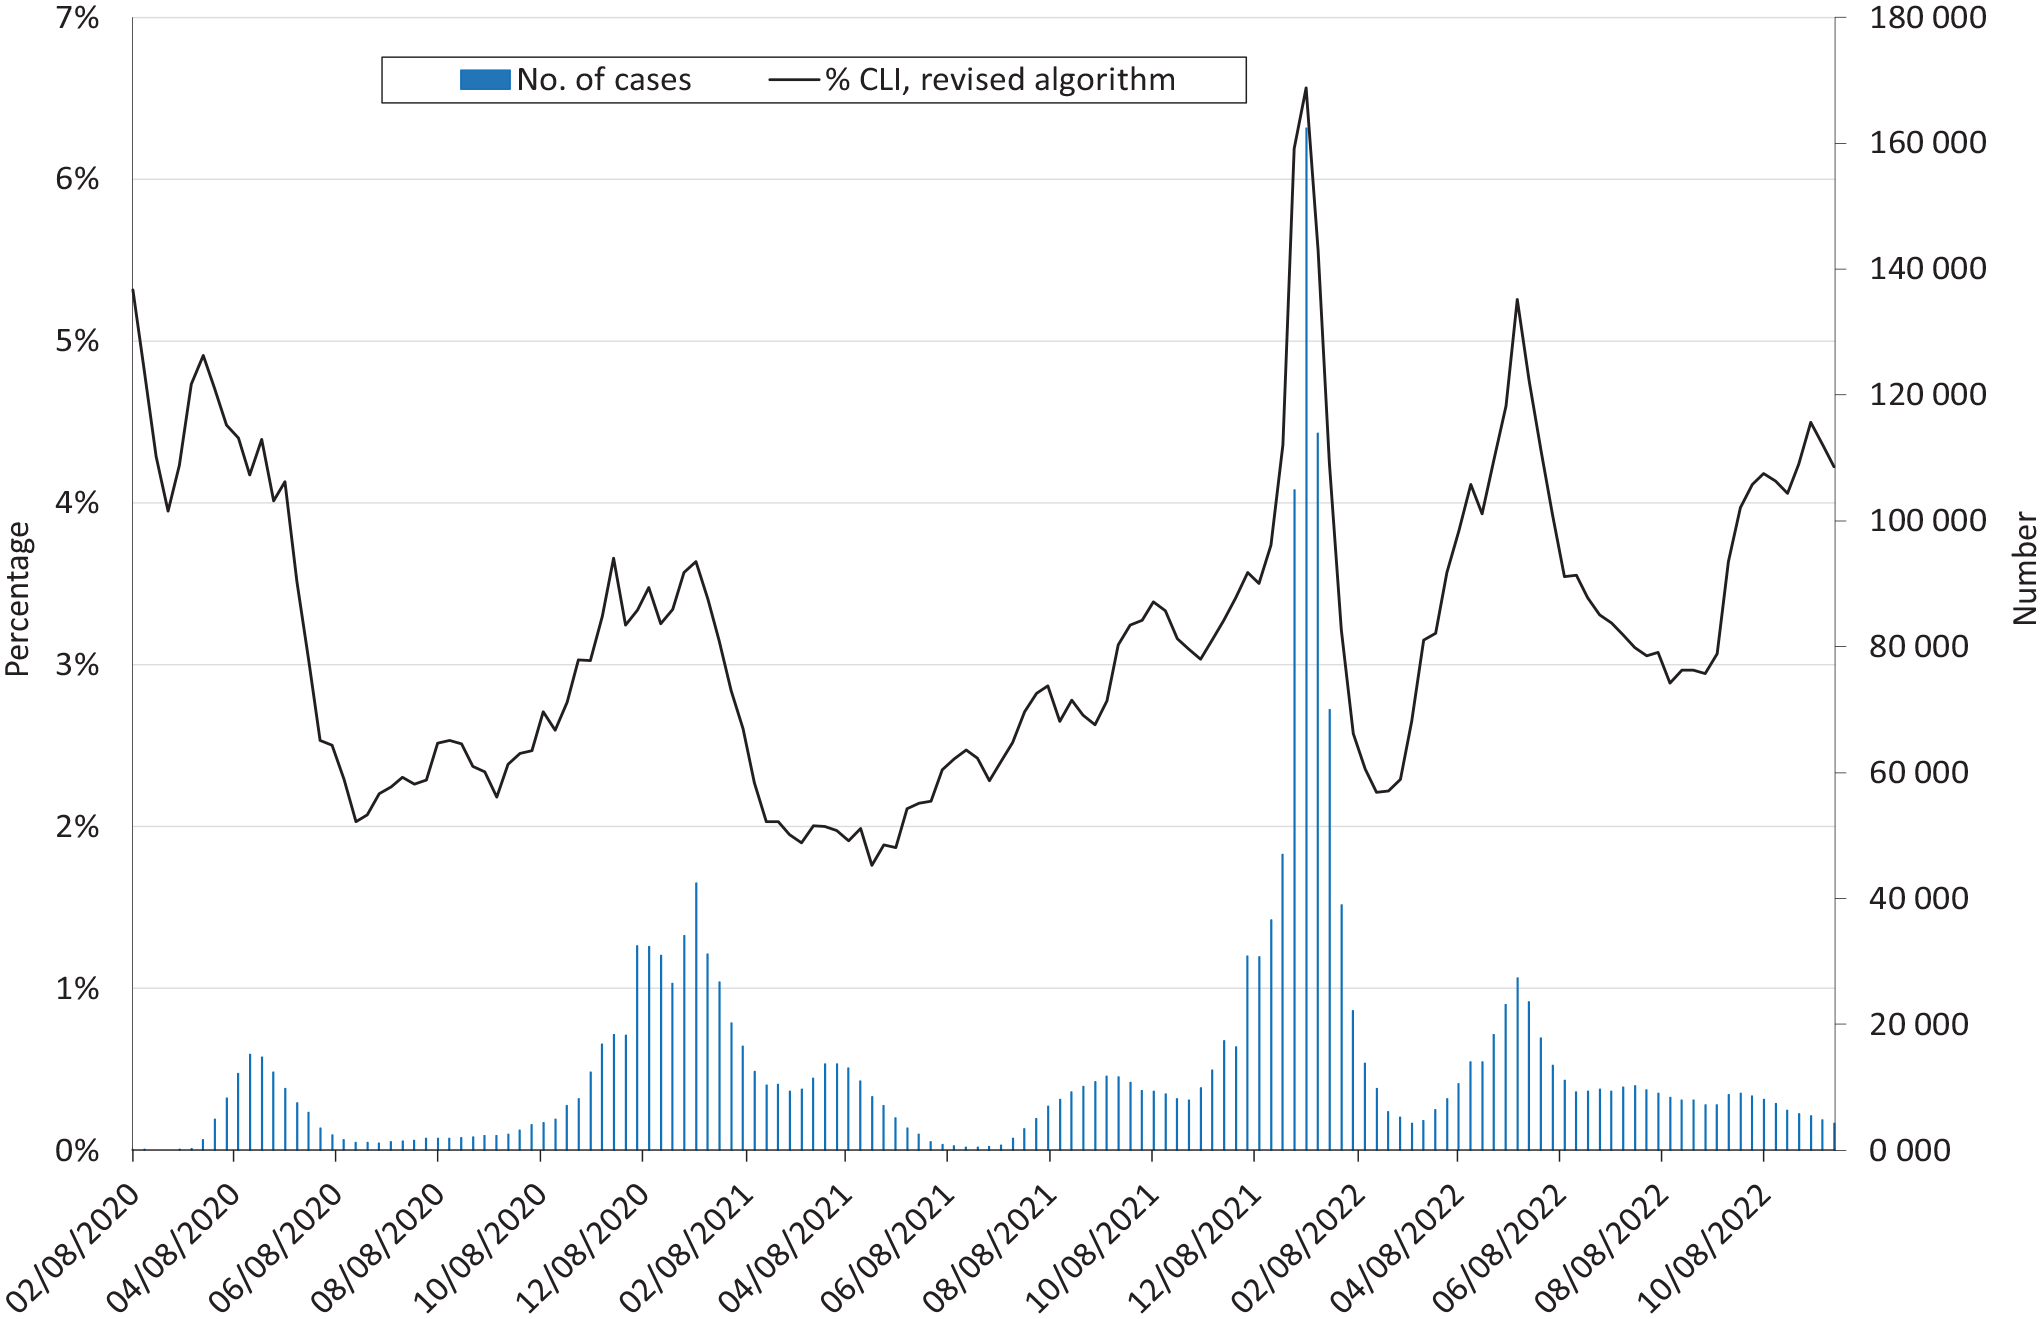
Weekly proportion of patients with COVID-19–like illness (CLI) without the fever requirement and including milder symptoms versus counts of new confirmed cases of SARS-CoV-2 statewide, Massachusetts, February 2020–November 2022. % CLI refers to the proportion of all clinical encounters per week that met the full CLI algorithm. The x-axis is the week-ending date. Dates for confirmed cases are the laboratory test date. Dates for CLI are the encounter date. Electronic medical record data were from the Electronic medical record Support for Public health (ESP) public health surveillance platform (www.esphealth.org).5,6 Case counts were statewide laboratory-confirmed weekly incident case counts from the Commonwealth of Massachusetts. 12 See Figure 1 for the revised CLI definition.
Discussion
Respiratory virus surveillance requires numerous data sources when specific etiological testing is not available, not reported, or not routinely pursued. To effectively respond to the evolving SARS-CoV-2 pandemic and complement other data sources used by the Massachusetts Department of Public Health, we leveraged ESP, an EMR-based public health surveillance platform that was well established in Massachusetts and used for more than a decade for ILI surveillance and tracking of other conditions of public health interest. We were able to quickly implement a syndromic algorithm and weekly report via this system and adapt it to enhance performance when it became evident that our initial CLI algorithm was missing evolving trends. By modifying the CLI algorithm in early 2021 to include patients with mild symptoms, with or without fever, the algorithm mirrored changes in laboratory-confirmed cases better than definitions requiring fever. The rise in CLI in data from more recent months (fall 2022), during which confirmed COVID-19 case counts did not increase, could be attributable to a combination of factors: a decline in laboratory testing of individuals with COVID-19 as more individuals either tested at home or did not undergo testing, or the CLI algorithm identifying individuals with influenza, respiratory syncytial virus, and other respiratory viral infections. Both explanations may be true: Massachusetts laboratory surveillance data showed an increase in influenza activity during October–November 2022, 16 and wastewater data in Massachusetts indicated an increase in SARS-CoV-2 circulation in September–November 2022. 17
While we made decisions to modify the CLI algorithm based primarily on the misalignment in trends between the proportion of clinical encounters that were CLI and counts of confirmed COVID-19 cases, we note that the original algorithm identified a much lower proportion of encounters (<1%) that met CLI compared with the revised algorithm (about 2% to 6% weekly with the revised algorithm). The proportion of encounters identified with the revised CLI is similar to what has historically been observed in Massachusetts for ILI during influenza seasons. 16 Although we did not expect the proportion of encounters with CLI to be the same as those with ILI given the differences in pathogens and definitions, on face value it makes sense that the proportion of encounters with CLI would be >1% given the higher attack rate of SARS-CoV-2 compared with influenza. Also, our observations and conclusions about algorithm performance were based on visual inspection alone and were not based on formal statistical testing.
In the United States, CDC’s National Syndromic Surveillance Program 18 is a source of data on CLI. Early in the pandemic, the program’s definition of CLI included symptoms of COVID-19 or an ICD-10-CM diagnosis code for COVID-19 identified in emergency departments.19,20 Data from the National Syndromic Surveillance Program were included in a report by Iuliano et al 21 and are used in CDC’s COVID Data Tracker 22 ; in both of these sources, the syndromic definition for COVID-19 is based on diagnosis codes for COVID-19 only (ie, no symptom codes) from emergency departments. In comparison with these earlier and more recent approaches by CDC, our syndromic definition for CLI was broad, and our data source consisted primarily of ambulatory care data. In addition, a 2021 article by Güemes et al 23 reported on a cluster detection approach using a syndromic definition that included fever, which, as we demonstrate via our original CLI algorithm, may underestimate data on COVID-19 activity.
Several limitations to this work should be noted. The CLI algorithm was implemented in 5 clinical practice groups that included a mix of ambulatory, emergency department, and hospitalized patients, and trends in CLI varied by care setting. While our work provided insight into COVID-19 activity without dependence on laboratory testing, it was not necessarily specific to SARS-CoV-2 and may have detected syndromes caused by other respiratory viruses. The algorithm’s performance will need to be monitored over time.
Practice Implications
Syndromic surveillance is a complement to laboratory-confirmed cases of COVID-19 and other respiratory viruses, enabling public health agencies to monitor activity regardless of testing practices or guideline adherence. Our work suggests that shifts in patients’ prevailing symptoms, care-seeking behavior, and coding practices, as well as changes in test availability and utilization, can affect the performance of syndromic surveillance systems. Our work highlights the importance of using a broad definition for COVID-19 syndromic surveillance—providing a broad view into respiratory illness activity—and the need for surveillance systems that are flexible and adaptable to changing trends and patterns in disease or care. Our findings also raise the question of whether to reconsider the requirement of fever for ILI definitions because the spectrum of illness for influenza also encompasses mild symptoms without fever. 24 Future work should consider a syndromic surveillance approach that can capture and differentiate among the full range of respiratory viruses that commonly circulate. When it is important to understand which organisms are circulating (eg, respiratory syncytial virus vs influenza vs SARS-CoV-2), a more specific approach to syndromic and viral surveillance will be needed.
Footnotes
Acknowledgements
This work was supported with funding from the Massachusetts Department of Public Health. The authors also thank the following colleagues for their contributions: Myfanwy Callahan, MD, MPH (Atrius Health); Dan Flanagan, MS, and Jonathan Bress, MS (Boston Medical Center); Ed Steen, MS, and Hieu Bui, BS (DotHouse Health and Codman Square Health Center); Michael Ndungu, BS, Rolda Lawrence, RN, and Melissa Leaston, RN (Whittier Street Health Center); colleagues at Boston Health Care for the Homeless, all part of Boston HealthNet; Brian Herrick, MD, and Michelle Weiss, MPH (Cambridge Health Alliance); and Lynette Mascioli, MPH, and Marlene Abreu, MA (Massachusetts League of Community Health Centers).
Disclaimer
The opinions expressed by authors contributing to this journal do not necessarily reflect the opinions of the institutions and agencies with which the authors are affiliated.
Declaration of Conflicting Interests
The authors declared no potential conflicts of interest with respect to the research, authorship, and/or publication of this article.
Funding
The authors disclosed receipt of the following financial support for the research, authorship, and/or publication of this article: This work was funded by the Massachusetts Department of Public Health.