
Abstract
Health authorities encouraged the use of digital contact tracing mobile applications (apps) during the COVID-19 pandemic, but the level of adoption was low because apps offered few direct benefits to counterbalance risks to personal privacy. Adoption of such apps could improve if they provided benefits to users. NOVID (COVID-19 Radar), a smartphone app, provided users with personalized data on social proximity of COVID-19 cases and exposed contacts. We analyzed uptake of NOVID at the Georgia Institute of Technology (Georgia Tech) during the 2020-2021 academic year. Data included anonymous NOVID users who self-identified with Georgia Tech and their first- and second-degree network contacts. NOVID achieved 13%-30% adoption at Georgia Tech. Because of technical challenges, adoption waned after an initial peak. The largest increases in adoption (from 41 to 3704) followed administrative promotion of NOVID. Adoption increased modestly (from 2512 to 2661) after faculty- and student-led promotion, such as distribution of door hangers and a public seminar. Two-thirds of on-campus NOVID users were connected to a large network of other users, enabling them to receive data on social proximity of COVID-19 cases and exposed contacts. Network cohesion was observed to emerge rapidly when adoption rates passed just 10%, consistent with estimates from network theory. The key lesson learned in this case study is that top-down administrative promotion outperforms bottom-up grassroots promotion. Relatively high levels of adoption and network cohesion, despite technical challenges during the Georgia Tech pilot of NOVID, illustrate the promise of digital contact tracing when apps provide privacy and inherently beneficial personalized data to their users, especially in regions where Google Apple Exposure Notification is not available.
Digital exposure notification (EN) differs from conventional contact tracing in that potential exposures to COVID-19 are identified from automatically collected data, such as proximity of mobile devices, in addition to retrospective interviews. 1 As soon as a smartphone application (app) user reports a positive COVID-19 test result, recent contacts receive notifications about their potential exposure and public health guidance for next steps. Because digital contact tracing can convey timely information in a scalable manner, it has been a core strategy in containing large outbreaks—for example, the Itaewon Night Club outbreak of SARS-CoV-2 in South Korea.2-4 Modeling suggests that even if outbreak containment fails, EN can reduce community transmission, 5 especially when the level of adoption of the technology is high.6-8
However, conventional EN apps offer little direct benefit to the individual user. 9 Alerts are received only after a user is exposed, at which point quarantine could prevent exposure of others but could not reverse the user’s own exposure. Financial compensation for using an EN app has been shown to improve uptake9-11 but is not feasible for large-scale deployment.12,13
Privacy concerns are cited as major barriers to adoption of EN apps, 14 especially when they track a user’s location (eg, using global positioning systems, Wi-Fi, QR code scanners, financial transaction data).15,16 Some technologies avoid recording a person’s geolocation by measuring only proximity between users (eg, Bluetooth signal strength17,18 or inaudible ultrasonic “squeaks” from the device’s speaker19,20). However, even these technologies21,22 collect potentially identifiable data, such as device identification, 23 which technology companies could triangulate with user data from other platforms to deanonymize users.24,25 Additionally, despite being the de facto national and international standard, Google Apple EN was not available in some regions, including Georgia.
The dearth of direct benefit to app users, who bear the potential harm of privacy invasion, is believed to cause an imbalance of incentives that underlies the low rates of adoption of EN apps.26-28 A need exists for privacy-respecting apps that directly benefit their users, ideally to an extent where the perceived benefit outweighs the perceived harm. Such technologies could improve the lives of app users while promoting uptake in populations.
Purpose
We sought to study the effect of tipping the balance of incentives by increasing the direct benefits to the user while minimizing the harms of privacy invasion. The smartphone app NOVID provided a unique personalized COVID-19 “radar” with real-time visual information on social proximity of disease while taking extensive measures to preserve privacy and ensure anonymity. This case study analyzed uptake, social network connectivity, and practical lessons learned during the pilot of NOVID at the Georgia Institute of Technology (Georgia Tech) during the 2020-2021 academic year.
Methods
Programmatic Development of the NOVID App
Upon installation, NOVID assigned each user a random identifier. Optionally, users could enter a community code identifying themselves as members of a specific user community. The app did not request the user’s name, demographic data, or any other personal information. While in use, the NOVID app collected information about the proximity and duration of time spent near other NOVID app–enabled devices. These data were collected via Bluetooth by using the inverse square law to translate signal strength into estimated distance. 29 Between Android phones, NOVID also issued inaudible ultrasonic microphone “squeaks” to more accurately measure proximity and duration and to avoid spurious connections that may occur with Bluetooth technologies (eg, connecting neighbors in adjoining rooms because of Bluetooth signals penetrating walls). 30 NOVID also detected when users were connected to a common Wi-Fi access point, but it maintained an anonymized table of random identifiers as temporary aliases for Wi-Fi access points. These Wi-Fi alias tables were overwritten hourly to minimize the risk of identifying the specific Wi-Fi access point being used.
Users could report either receiving a positive COVID-19 test result or being notified of a COVID-19 exposure by a conventional contact tracer. NOVID automatically labeled self-reports as unverified. Optionally, users could enter a one-time confirmation code provided by their local health authority, which caused the notification received by contacts to be labeled as verified.
NOVID measured social proximity of disease based on degrees of separation (ie, network “hops”) between cases and contacts in the social network (Figure 1). In Figure 1, “you” would have 1 degree of separation from your family and friends, 2 degrees of separation from distant friends, 3 degrees of separation from acquaintances, and further degrees of separations (≥4) from others. Within those social networks, individuals may be vaccinated, have symptoms, or even have COVID-19. This type of information visualization provides the user with a social network “radar” map. Like other EN apps, NOVID alerted users if they came in direct contact with a confirmed case. However, NOVID also provided users their own personalized COVID-19 “radar” displaying the number of positive cases and total users at different numbers of network hops away (Figure 2). A button allowed users to animate the bar graphs to see how their exposure risk was evolving over time, which could inform whether risk was increasing because cases were becoming more proximal or decreasing because cases were becoming more distant in their personalized network.
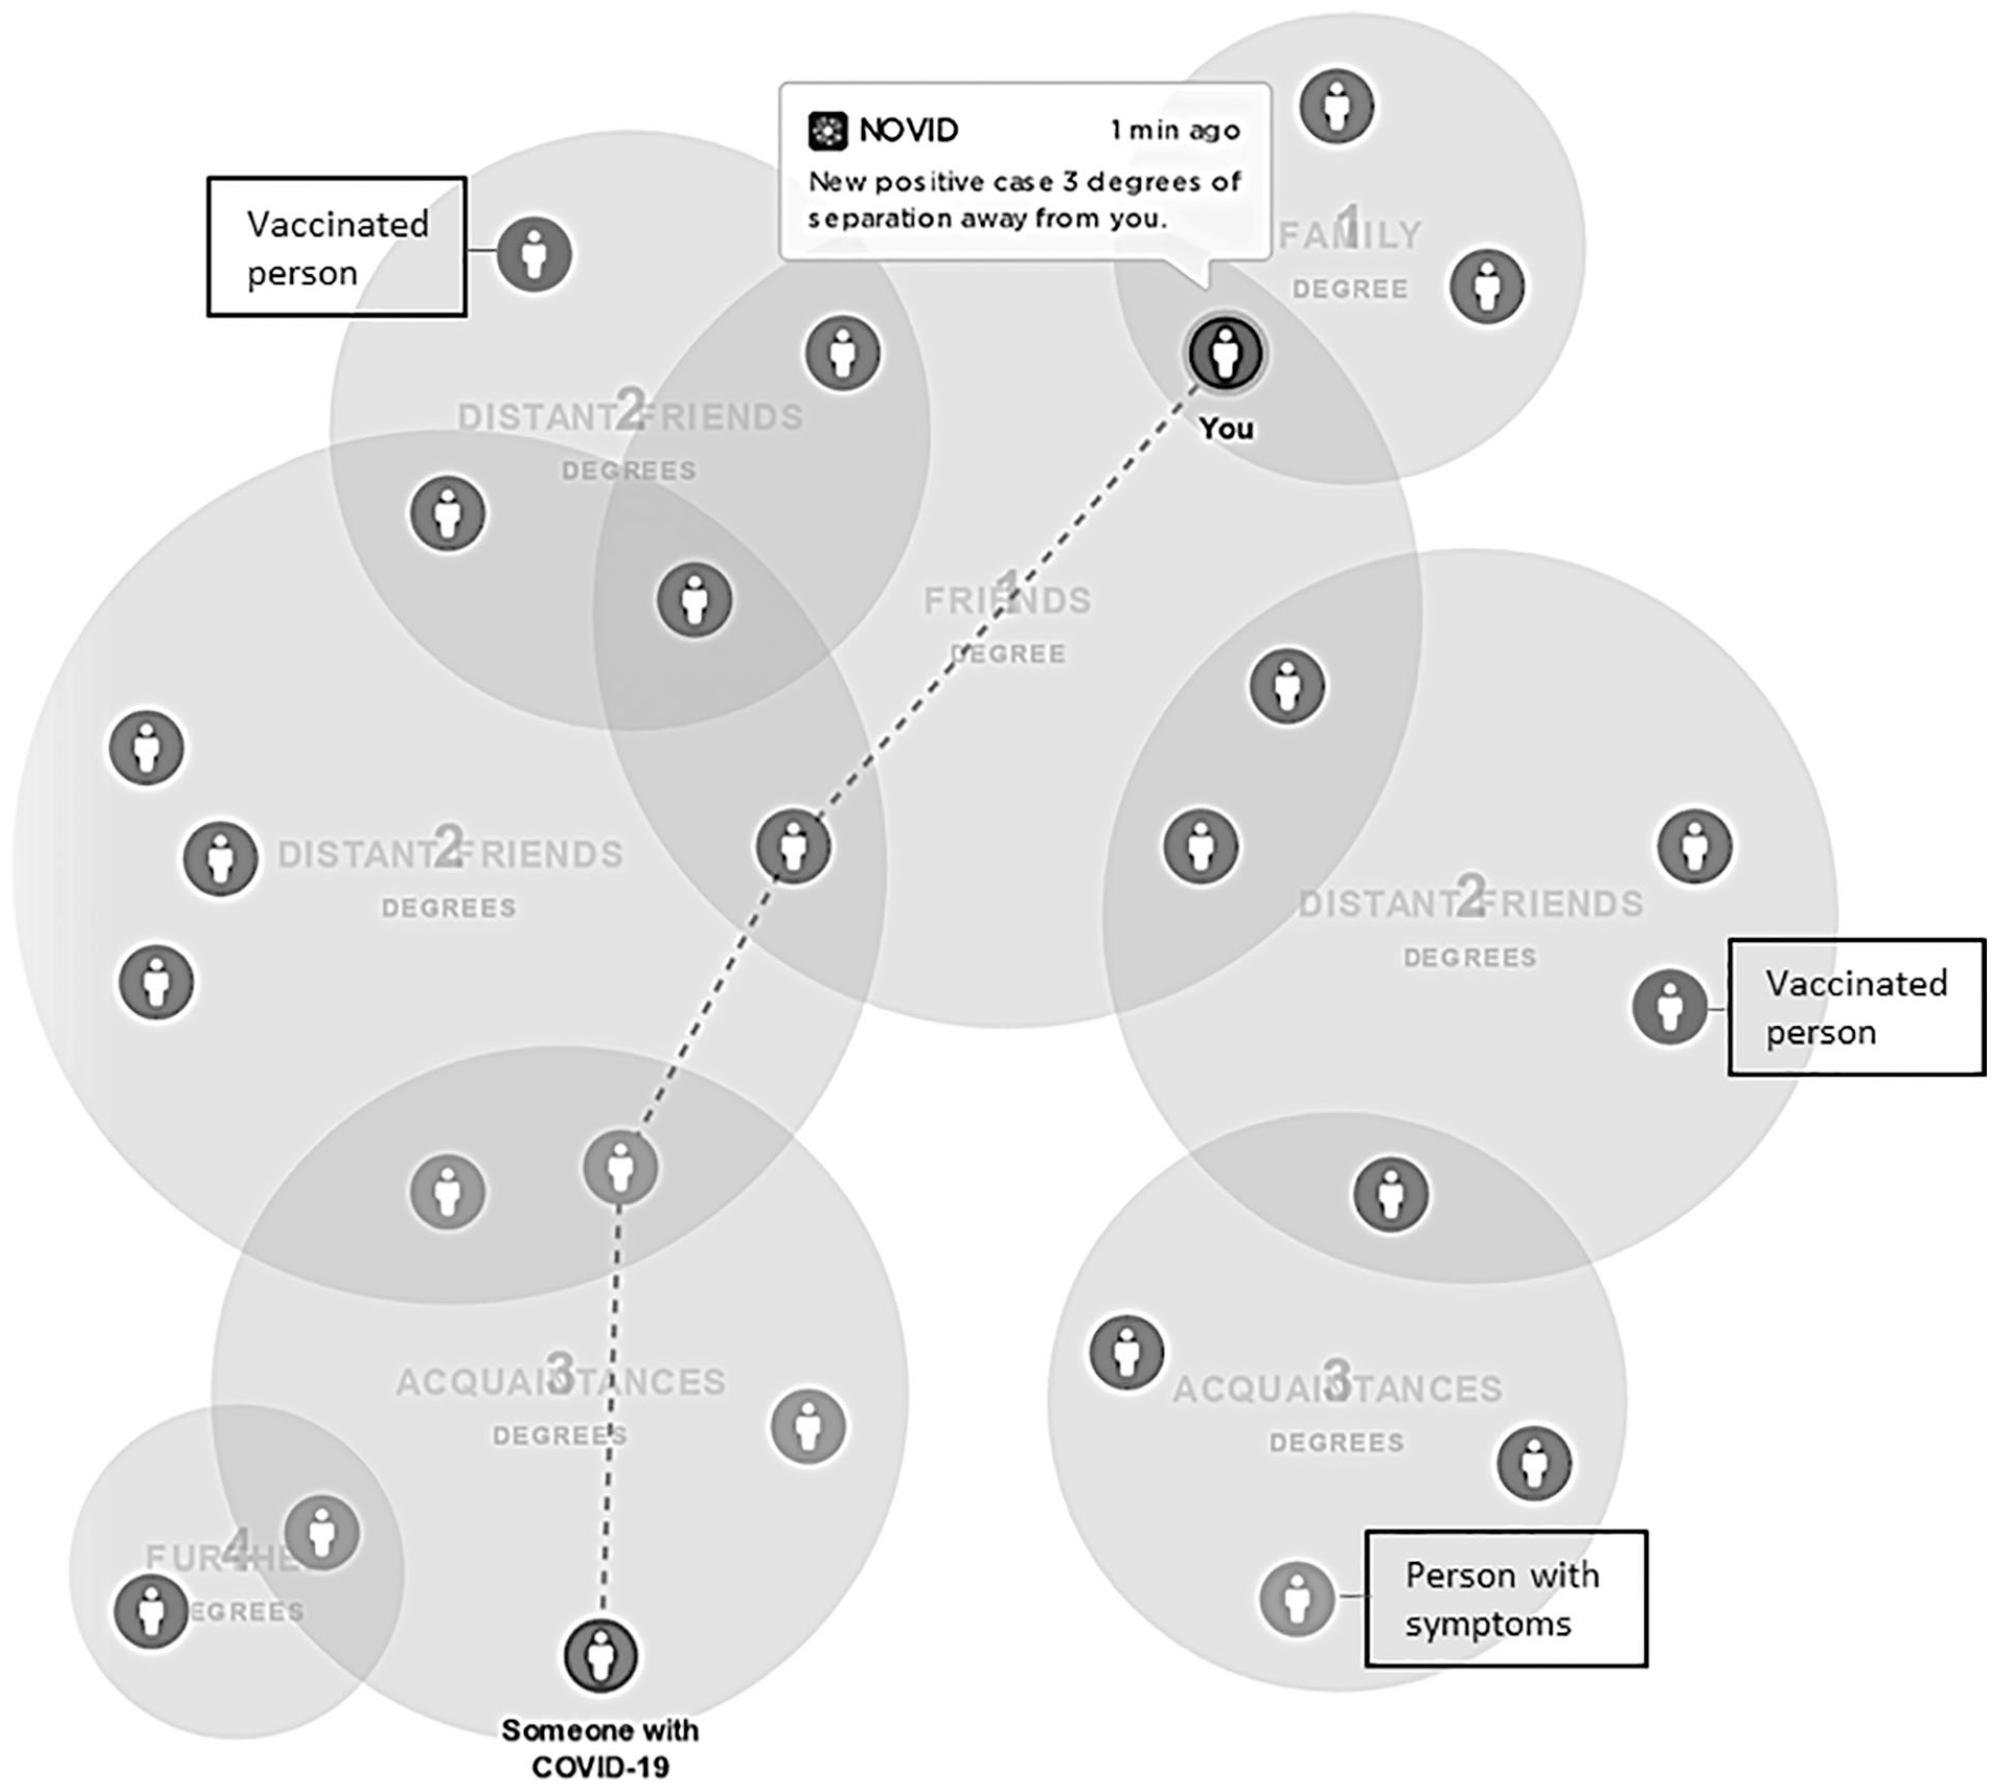
Hypothetical illustration of how NOVID (COVID-19 Radar) informs users about their degrees of separation (ie, network “hops”) from the nearest reported COVID-19 case or exposed contact, Georgia Institute of Technology, 2020. “You” would have 1 degree of separation from your family and friends, 2 degrees of separation from distant friends, 3 degrees of separation from acquaintances, and further degrees of separation (≥4) from others. Within those social networks, individuals may be vaccinated, have symptoms, or even have COVID-19. A key difference from standard exposure notification applications is that NOVID informed the user of exposures to other contacts and to cases >1 degree away (ie, beyond one’s direct circle of contacts). The system also supported labeling users with other self-reported attributes, such as vaccination or symptoms.
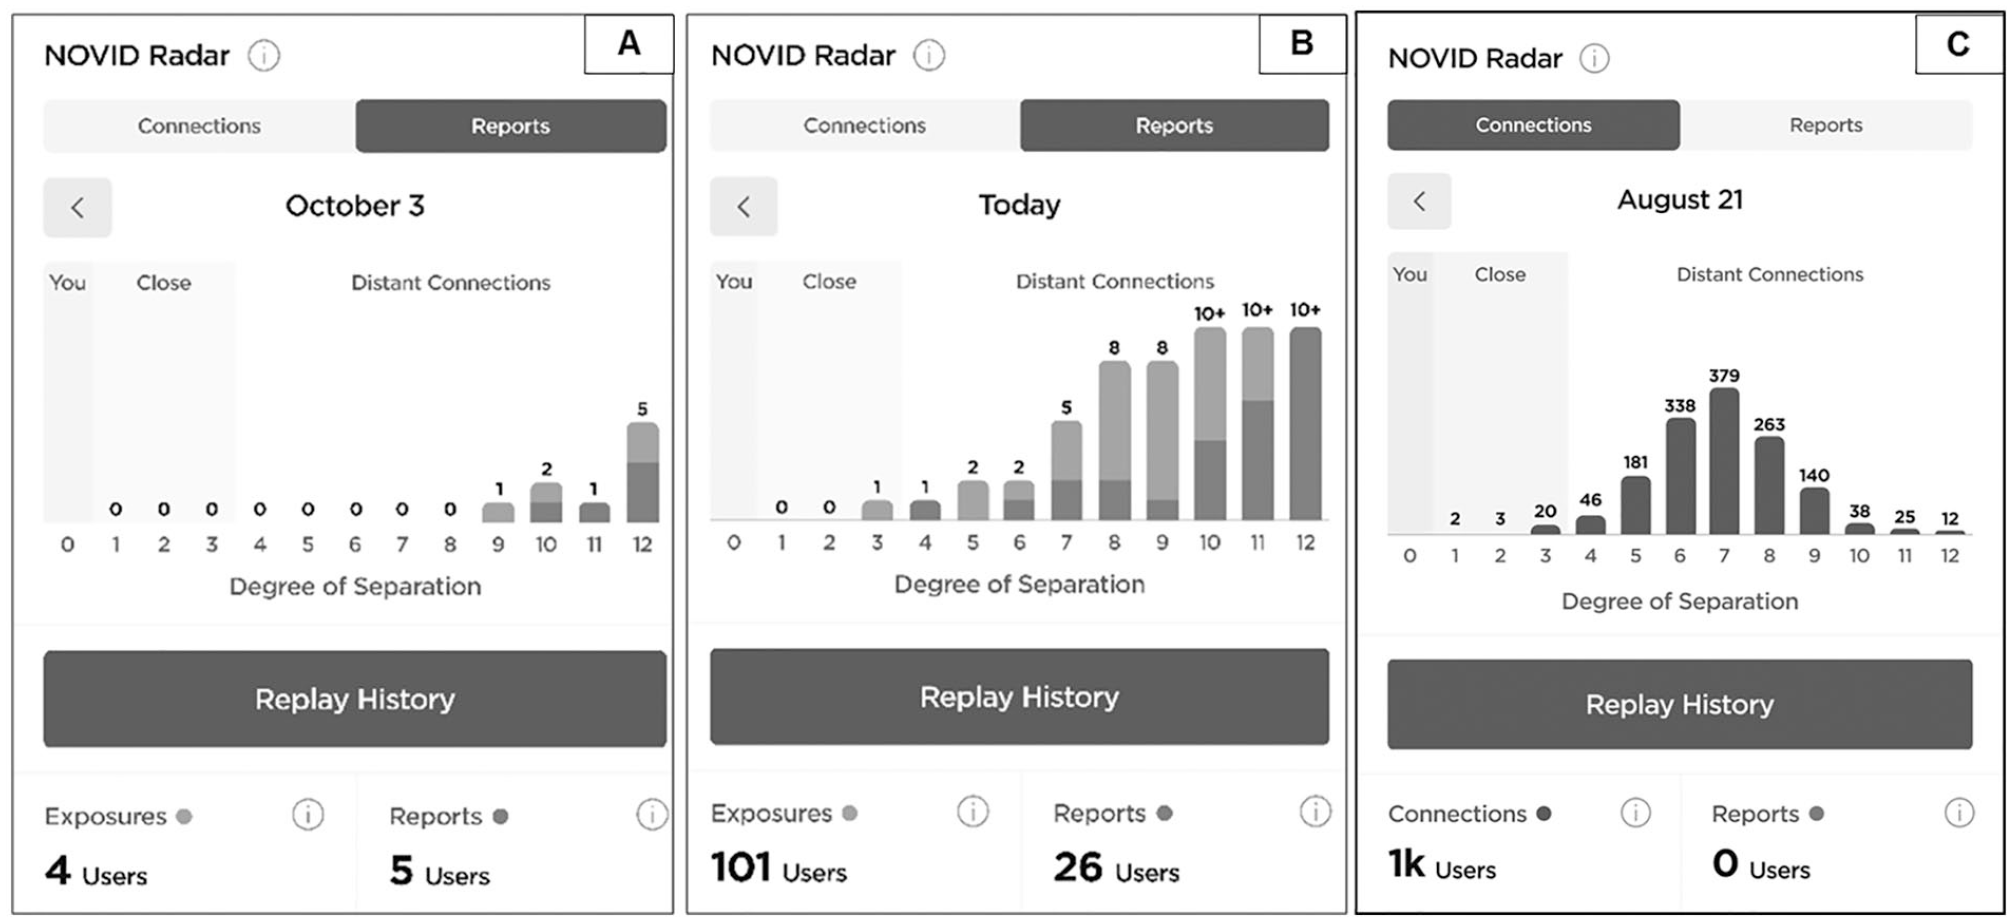
Hypothetical personalized data visualization (“radar”) available to users of NOVID (COVID-19 Radar), Georgia Institute of Technology, 2020. The NOVID smartphone application depicted distribution of degrees of separation to COVID-19 cases and other exposed people in the network. When a NOVID user self-reported recent COVID-19 infection (ie, is a new case) and was 1 degree away, the user received a smartphone alert message and was prompted to open the application. A, On that day, all cases reported in the past 14 days were ≥10 degrees away. B, On another day, the nearest case was 4 degrees away. C, How NOVID displayed the total number of other NOVID users within 12 degrees of separation in the network for any given day, regardless of their case or exposure status. The “replay history” button allowed the user to see how one’s potential exposure status changed over time, analogous to a weather radar.
NOVID Pilot at Georgia Tech
Georgia Tech piloted NOVID during the 2020-2021 academic year. Classes began August 17, 2020, and final examinations ended May 8, 2021. Students and staff were given campus access to reside, attend courses, use office and laboratory facilities, and attend events such as athletic games. Layered COVID-19 mitigation measures included social distancing, face mask wearing, symptom screening, and weekly surveillance testing. 31 NOVID’s role was to supplement the campus’s conventional contact tracing program.
Before the academic year began, the Georgia Tech Research Institute’s Software Assurance Branch conducted an independent review of the NOVID app. The report, published July 27, 2020, 32 confirmed that NOVID did not collect, use, or store personally identifiable information. Information about the NOVID app was disseminated by a campuswide newsletter on August 17, 2020. 33 The newsletter included Georgia Tech’s community code for the app, allowing users the option to self-identify as part of the Georgia Tech community. This information was reiterated during a town hall event on August 20, 2020. During the winter recess, the Residence Hall Association hung door hangers in dormitories advertising NOVID. Faculty and staff also organized a virtual, public scientific seminar about NOVID on March 1, 2021.
Because NOVID was under active development during the 2020-2021 academic year, some functionality of the app was limited at certain times. The ability to self-report a positive test result or exposure was unavailable on iOS devices until September 9, 2020. The ability of iOS devices to detect the proximity of other iOS devices was unavailable until January 6, 2021, although Android devices were able to connect to iOS devices and to each other. For all devices, local health authority confirmation codes to verify a positive test result or an exposure were unavailable until January 7, 2021.
The institutional review boards at the Georgia Institute of Technology, Carnegie Melon University, and New York University all concluded that this research was exempt because no personally identifiable information was collected or analyzed.
Analysis of NOVID Networks
In our retrospective analysis of the 2020-2021 academic year, the broader Georgia Tech community was defined as 3 groups of NOVID app users: (1) those who voluntarily entered the Georgia Tech community code when installing the app, (2) anyone whose apps ever communicated via Bluetooth with users from that first group, and (3) anyone whose apps ever communicated via Bluetooth with users from the second group. We further defined a more stringent on-campus community as the subset of the Georgia Tech community who, at any time during the academic year, was part of a connected network component consisting of at least 200 Georgia Tech community members during a 2-week period. This definition was intended to reduce the number of off-campus contacts of Georgia Tech community members who were included.
A dynamic network was constructed with anonymous data from these 3 groups. Network connections were defined by pairs of users whose smartphones spent ≥15 minutes within 10 m of each other or ≥3 hours connected to the same Wi-Fi access point. Networks were constructed daily for a 14-day moving window.
We examined connectivity of the NOVID network, including the number of users in network components of ≥12 users and the size of the largest network component (ie, the giant component). We estimated the fraction of the on-campus community actively using the NOVID app by dividing the number of active users by Georgia Tech’s estimate of 12 370 daily students, faculty, and staff on campus. 31 We hypothesized, based on theoretical studies of networks, 34 that even low rates of app adoption would produce network cohesion and enable the COVID-19 radar feature to present meaningful information to users.
Outcomes
Initial NOVID app uptake was rapid (Figure 3), peaking at approximately 3723 total active users in the Georgia Tech community on August 26, 2021. A subset of 1633 users met the more stringent definition of belonging to the on-campus community, representing a lower bound of 13% (1633 of 12 370) and an upper bound of 30% (3723 of 12 370) for app uptake as the academic year began.
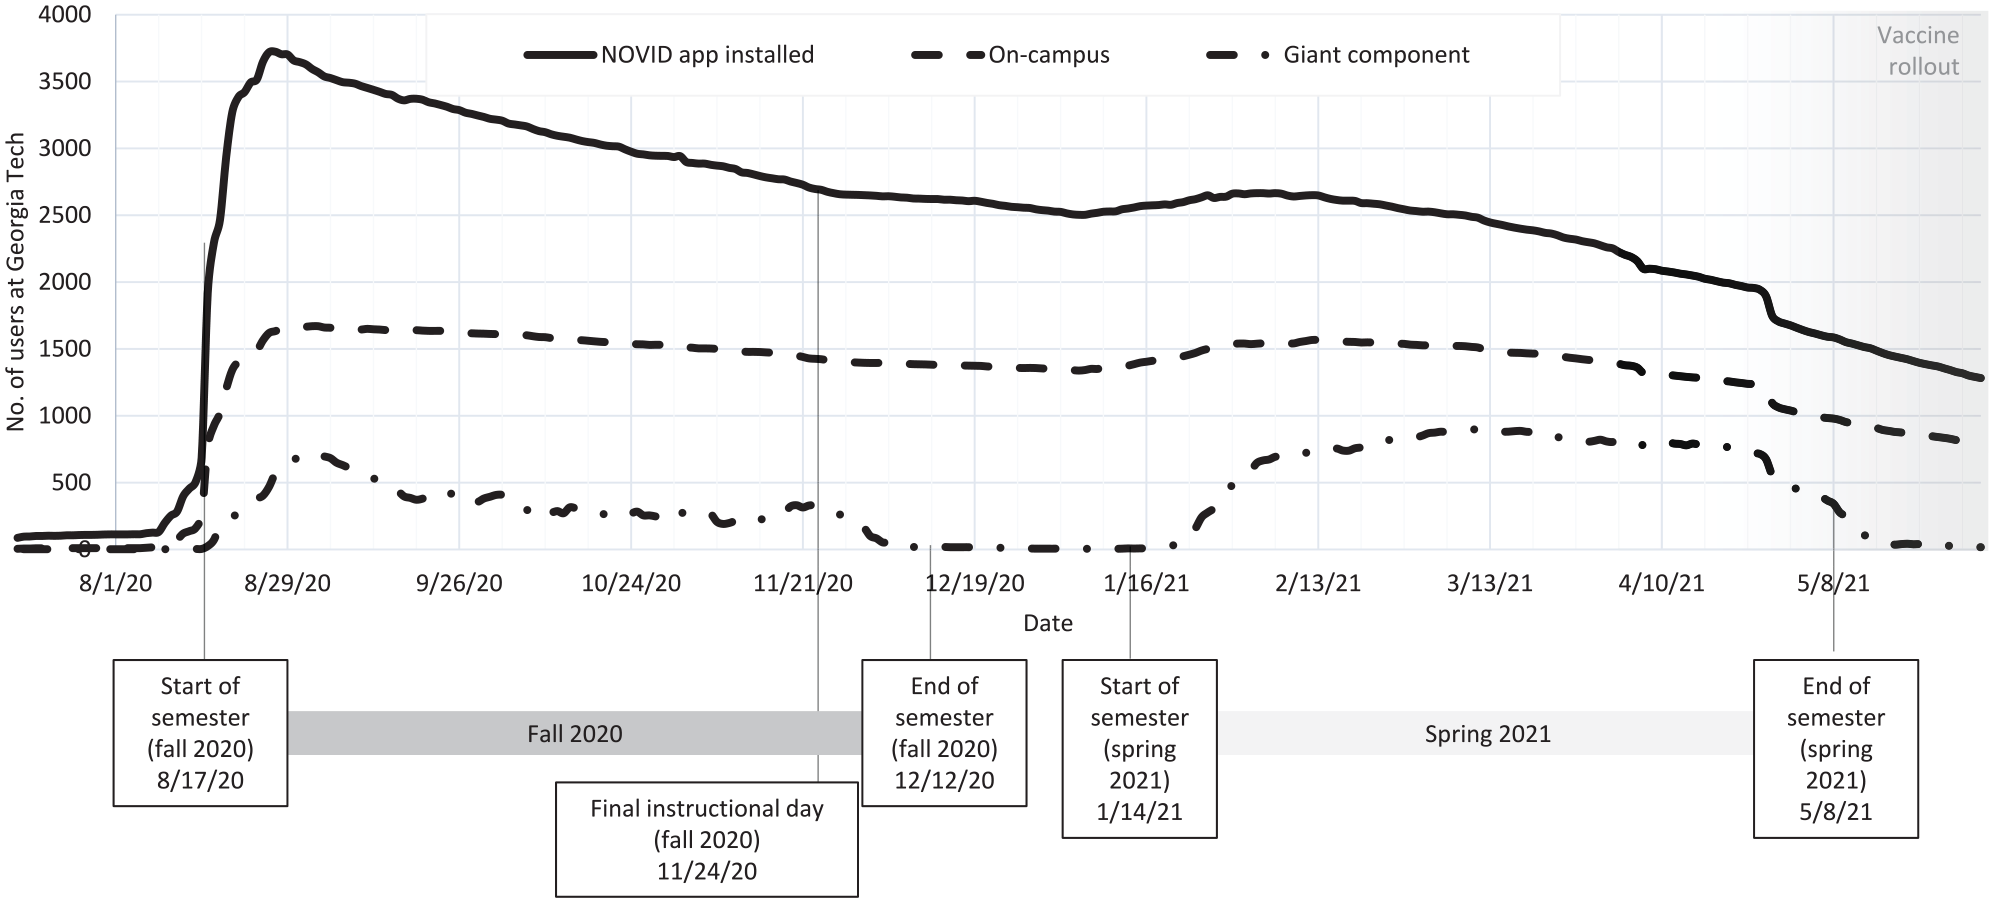
NOVID (COVID-19 Radar) application (app) use at the Georgia Institute of Technology (Georgia Tech), 2020-2021 academic year. On-campus refers to the subset of users in the Georgia Tech community who, at any time during the academic year, was part of a connected network component consisting of ≥200 Georgia Tech community members during a 2-week period. Giant component refers to the subset of users in the largest network component. The final instructional day was moved up to align with the Thanksgiving holiday in anticipation of increased transmission of COVID-19. Vaccine rollout (shaded region) occurred during spring 2021.
As uptake increased, so did network connectivity. The network’s giant component peaked at 710 users on September 2, 2020. During the winter recess, most NOVID users kept their apps installed; however, the giant component disappeared because users traveled off-campus. The return of students for the spring semester caused a modest increase in participation (peaking at 2665 total active users in the Georgia Tech community during February 2-3, 2021) with the subset meeting the more stringent definition of belonging to the on-campus community peaking on February 11 at 1567 users. The giant component rebounded markedly, from a low of 4 on January 4 to a peak of 898 on March 10, which exceeded the fall semester peak.
Lessons Learned
Our analysis and indeed the Georgia Tech pilot itself were limited by technical challenges, especially on iOS devices, which constituted the majority (~70%) of devices used by Georgia Tech students and staff. In the fall semester, network connectivity was reduced for iOS users, so interest in NOVID might have waned. These experiences underscore the need to preemptively develop and pilot digital technologies in preparation for future infectious disease outbreaks, rather than developing and piloting them “on the fly” in the context of an ongoing pandemic.
Despite technical challenges, NOVID achieved relatively high rates of adoption during its pilot at Georgia Tech. Even our lower-bound estimate of 13% adoption of NOVID on Georgia Tech’s campus exceeded typical adoption of EN apps in the United States. 26 NOVID relied on the user connecting to a sizable network of other users. Based on theoretical studies of prototypical social networks, such as the Erdős-Rényi network, 34 we expected that the network nodes would become interconnected even with a small fraction of the on-campus community participating in NOVID. At the start of the 2020-2021 academic year, NOVID network cohesion occurred at approximately 10% adoption. At peak adoption, conservatively estimated at 13%, NOVID was able to connect 60%-70% of on-campus users to a large network of other on-campus users. Network connectivity changed according to behavioral patterns—dissolving, for example, during the winter recess and rebounding in the spring semester—providing reassurance that the network reflected real interactions on campus.
To our knowledge, NOVID was the first app to provide users with a personalized radar depicting social proximity to an infectious disease. It was among the first apps to provide a direct benefit to the users, helping them to avoid exposure rather than notifying them postexposure. NOVID also collected no personal data or location information and used short-term aliases for Wi-Fi networks.
We observed the largest increases in NOVID adoption after administrative announcements, rather than through community efforts such as the student-organized door hanger campaign and the faculty-organized seminar. We expected NOVID uptake to grow throughout the academic year as network cohesion made the app more useful for determining the social proximity of COVID-19. Instead, we observed a gradual decline in active users throughout the fall and only a modest rebound in the spring. Further exploration is needed to understand barriers and facilitators to the use of NOVID and other EN apps.
Footnotes
Acknowledgements
The authors thank Jon Duke, MD, and Alexis Harter, PhD, for their assistance implementing NOVID at the Georgia Institute of Technology and Daniel J. Klein, PhD, and Hao Hu, PhD, for helpful discussions.
Authors’ Note
Po-Shen Loh and Anna Bershteyn contributed equally to this article.
Declaration of Conflicting Interests
The authors declared the following potential conflicts of interest with respect to the research, authorship, and/or publication of this article: Po-Shen Loh declares that he is the chief executive officer and majority owner of Expii, Inc, which developed the NOVID app.
Funding
The authors received no financial support for the research, authorship, and/or publication of this article.