
Abstract
Objectives:
The impact and risk of SARS-CoV-2 transmission from asymptomatic and presymptomatic hosts remains an open question. This study measured the secondary attack rates (SARs) and relative risk (RR) of SARS-CoV-2 transmission from asymptomatic and presymptomatic index cases as compared with symptomatic index cases.
Methods:
We used COVID-19 test results, daily health check reports, and contact tracing data to measure SARs and corresponding RRs among close contacts of index cases in a cohort of 12 960 young adults at the University of Notre Dame in Indiana for 103 days, from August 10 to November 20, 2020. Further analysis included Fisher exact tests to determine the association between symptoms and COVID-19 infection and z tests to determine statistical differences between SARs.
Results:
Asymptomatic rates of transmission of SARS-CoV-2 were higher (SAR = 0.19; 95% CI, 0.14-0.24) than was estimated in prior studies, producing an RR of 0.75 (95% CI, 0.54-1.07) when compared with symptomatic transmission. In addition, the transmission rate associated with presymptomatic cases (SAR = 0.25; 95% CI, 0.21-0.30) was approximately the same as that for symptomatic cases (SAR = 0.25; 95% CI, 0.19-0.31). Furthermore, different symptoms were associated with different transmission rates.
Conclusions:
Asymptomatic and presymptomatic hosts of SARS-CoV-2 are a risk for community spread of COVID-19, especially with new variants emerging. Moreover, typical symptom checks may easily miss people who are asymptomatic or presymptomatic but still infectious. Our study results may be used as a guide to analyze the spread of SARS-CoV-2 variants and help inform appropriate public health measures as they relate to asymptomatic and presymptomatic cases.
After the emergence of SARS-CoV-2 in Wuhan, China, in late 2019,1,2 scientists quickly discovered the virus could be transmitted through asymptomatic hosts.3,4 However, estimates of the percentage of asymptomatic cases from different studies have varied greatly, from as low as 30% to as high as 76.5%.5-9 In addition, these estimates were limited by the availability of case reports and longitudinal data,10,11 and they did not comprehensively distinguish between presymptomatic and asymptomatic cases.
Some systematic reviews have used meta-analysis to estimate secondary attack rates (SARs) and relative risk (RR; also called risk ratio) for asymptomatic and/or presymptomatic index cases. Most relevant is the work by Buitrago-Garcia et al, 10 who estimated an RR of 0.35 (95% CI, 0.10-1.27) from 5 studies for transmission from asymptomatic index cases (compared with symptomatic index cases) and an RR of 0.63 (95% CI, 0.18-2.26) from presymptomatic index cases. In another systematic review, Thompson et al 12 estimated SARs of 0.14 (95% CI, 0.10-0.17) for symptomatic index cases, 0.09 (95% CI, 0.05-0.14) for presymptomatic index cases, and 0.02 (95% CI, 0.01-0.03) for asymptomatic index cases. However, the studies were heterogeneous in defining asymptomatic and presymptomatic cases, follow-up for close contacts, and exposure location—which the authors showed can significantly affect transmission rates. Madewell et al 13 estimated SARs of 0.180 (95% CI, 0.142-0.221) for symptomatic index cases and 0.007 (95% CI, 0-0.049) for asymptomatic and presymptomatic index cases among household and family contacts, but again, the studies were heterogeneous and had small sample sizes (only 7 total secondary cases). Some additional studies found that asymptomatic cases are generally less transmissible,14-16 but others showed that approximately half of secondary transmissions happen during the asymptomatic or presymptomatic phase of a primary index case,17,18 contributing to undetected spread.19,20 Although asymptomatic and symptomatic cases have shown similar viral load, 21 the impact of symptomatic or asymptomatic status on transmissibility is less understood.22-26
With a cohort of 12 960 students and 1592 confirmed COVID-19 cases during our study period at the University of Notre Dame, our study used a rich longitudinal dataset that followed the student population for 103 days in fall 2020. This study measured SARs and RRs of SARS-CoV-2 transmission from asymptomatic and presymptomatic index cases, compared with symptomatic index cases. Our analysis considered daily health checks, COVID-19 test results, and contact tracing interviews to measure transmission. These results may help guide public health practice in the presence or absence of symptomatic cases.
Methods
COVID-19 and University Preparation
When Notre Dame returned to in-person classes in fall 2020, the university implemented a daily self-reported health check, diagnostic testing, intensive contact tracing protocols, quarantine/isolation policies, and regular and required surveillance testing. 27 Despite these efforts, by the last day of the semester (November 20, 2020), 1561 students on campus had received a positive COVID-19 test result.
Inclusion Criteria
We included data according to the following constraints:
People in the dataset were active students (ie, enrolled in an undergraduate, graduate, or professional degree program and registered for ≥1 course) residing in the local area.
Students completed at least 50% of their health checks within the 15-day window centered on their positive test (7 days before the day of the test administration and 7 days after).
The date of a positive test administration was from August 10 (the first day of the fall semester) through November 20 (the last day of the semester).
Symptom Reporting and COVID-19 Testing
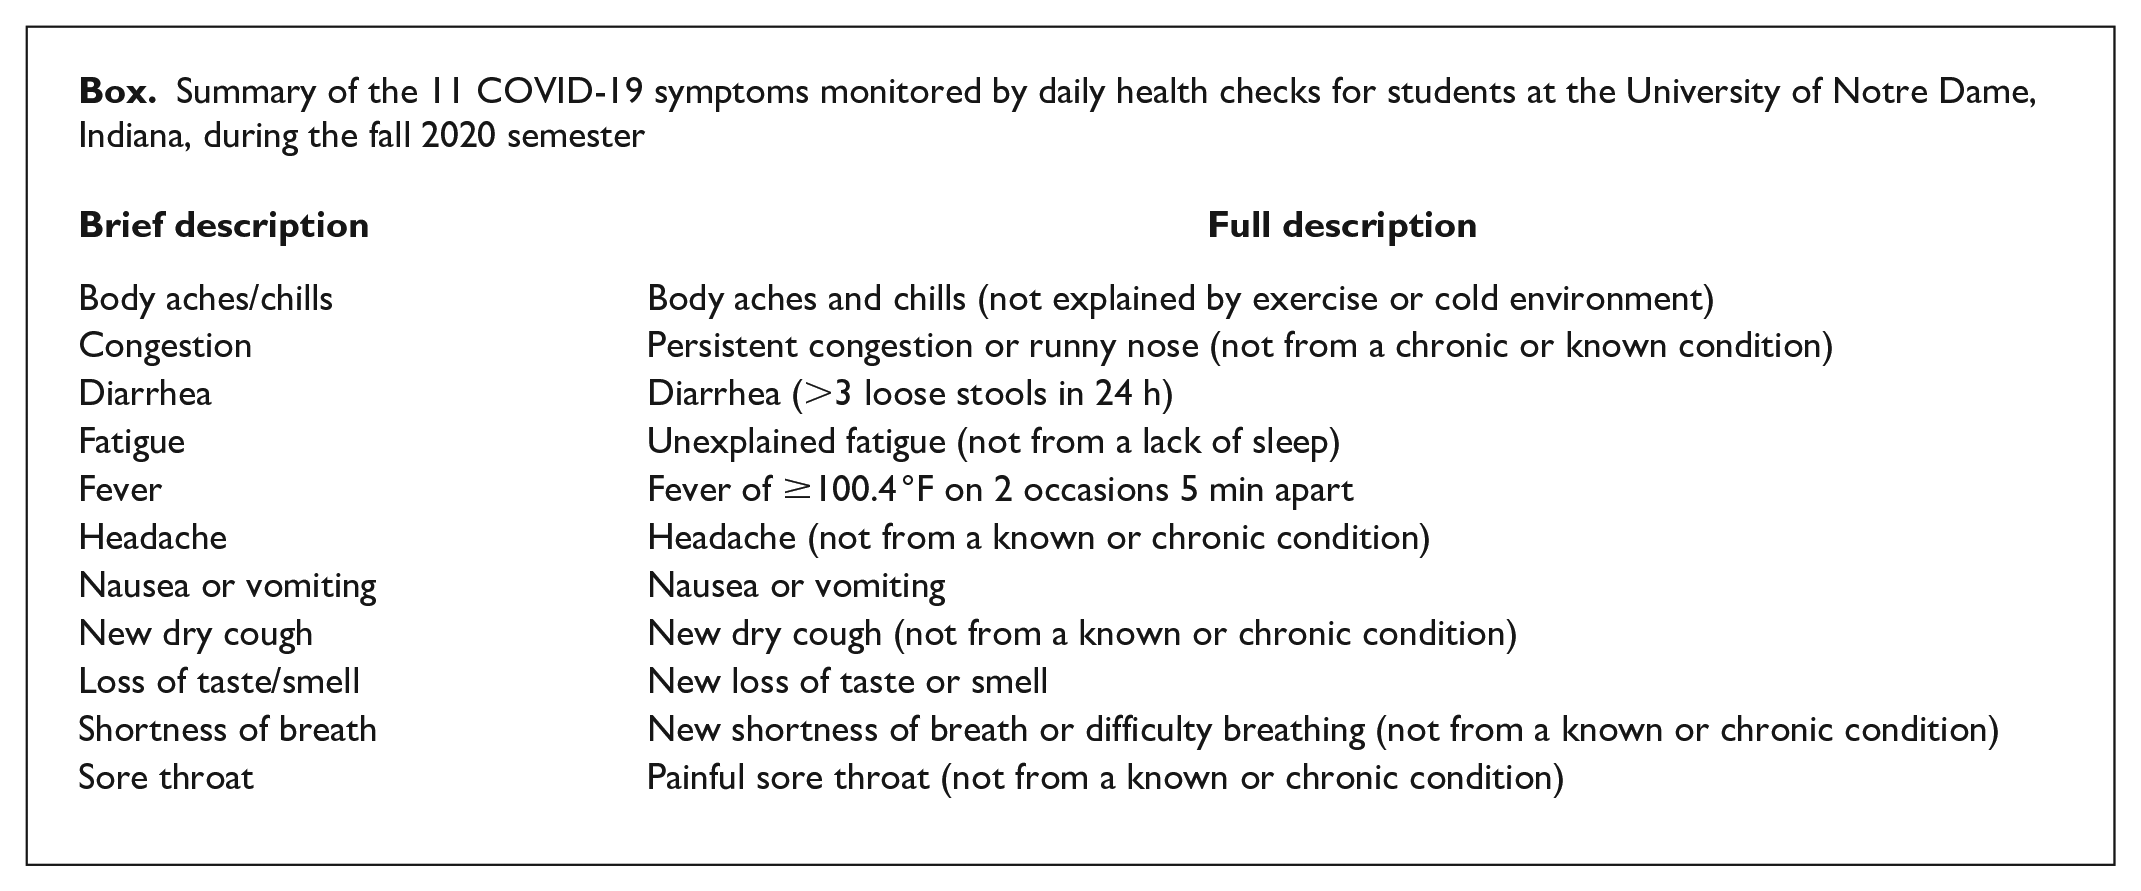
Each student was required to submit electronically a daily health check, documenting whether they had experienced any of 11 symptoms (Box) or suspected they had been exposed to COVID-19. If a student reported exposure to a COVID-19–positive individual, a primary symptom (fever, shortness of breath, or loss of taste/smell), or any other symptoms for 2 consecutive days, the student was scheduled for a same-day testing appointment and administered a Sofia SARS antigen fluorescent immunoassay (Quidel) rapid antigen test. If the antigen test yielded a negative test result, the student was immediately administered a reverse transcription–polymerase chain reaction (RT-PCR) test (performed by a local commercial laboratory primarily using a Roche platform) and temporarily quarantined until the RT-PCR result was returned. Of students who had a negative test result via a rapid antigen test, 8.1% had false-negative test results and received a positive test result via a same-day RT-PCR test.
Summary of the 11 COVID-19 symptoms monitored by daily health checks for students at the University of Notre Dame, Indiana, during the fall 2020 semester
When a test yielded a positive result, the student was instructed to isolate for 14 days. A response team, consisting of clinical and nonclinical personnel, conducted a brief telephone-based contact-tracing interview. Confirmed close contacts were informed of exposure (without revealing the identity of the index case), instructed to quarantine, and administered an antigen test. If the test produced a negative result, the close contacts were administered an RT-PCR test, instructed to quarantine, and called for additional tests on days 4 and 7 after exposure. If all test results were negative by day 7, students were released from quarantine.
In addition to testing students who reported symptoms or exposure via close contact, the university introduced surveillance testing to identify asymptomatic or presymptomatic cases. Every day, a statistically driven sample of students was administered an RT-PCR test (using the ThermoFisher TaqPath assay). Students with positive test results were instructed to isolate themselves for 14 days. The number of surveillance tests administered increased during the semester, so some asymptomatic cases likely escaped detection earlier in the semester.
Identifying Asymptomatic and Presymptomatic Students
We considered a person to be asymptomatic if they reported no symptoms within the 15-day window centered on their positive test administration. If they reported any of the 11 symptoms at least once, we considered them to be symptomatic. We subcategorized symptomatic cases as presymptomatic if the student did not report any symptoms in the 7 days before a positive test administration or on the date a positive test was administered (ie, was symptomatic only after a positive COVID-19 test result; Figure 1).
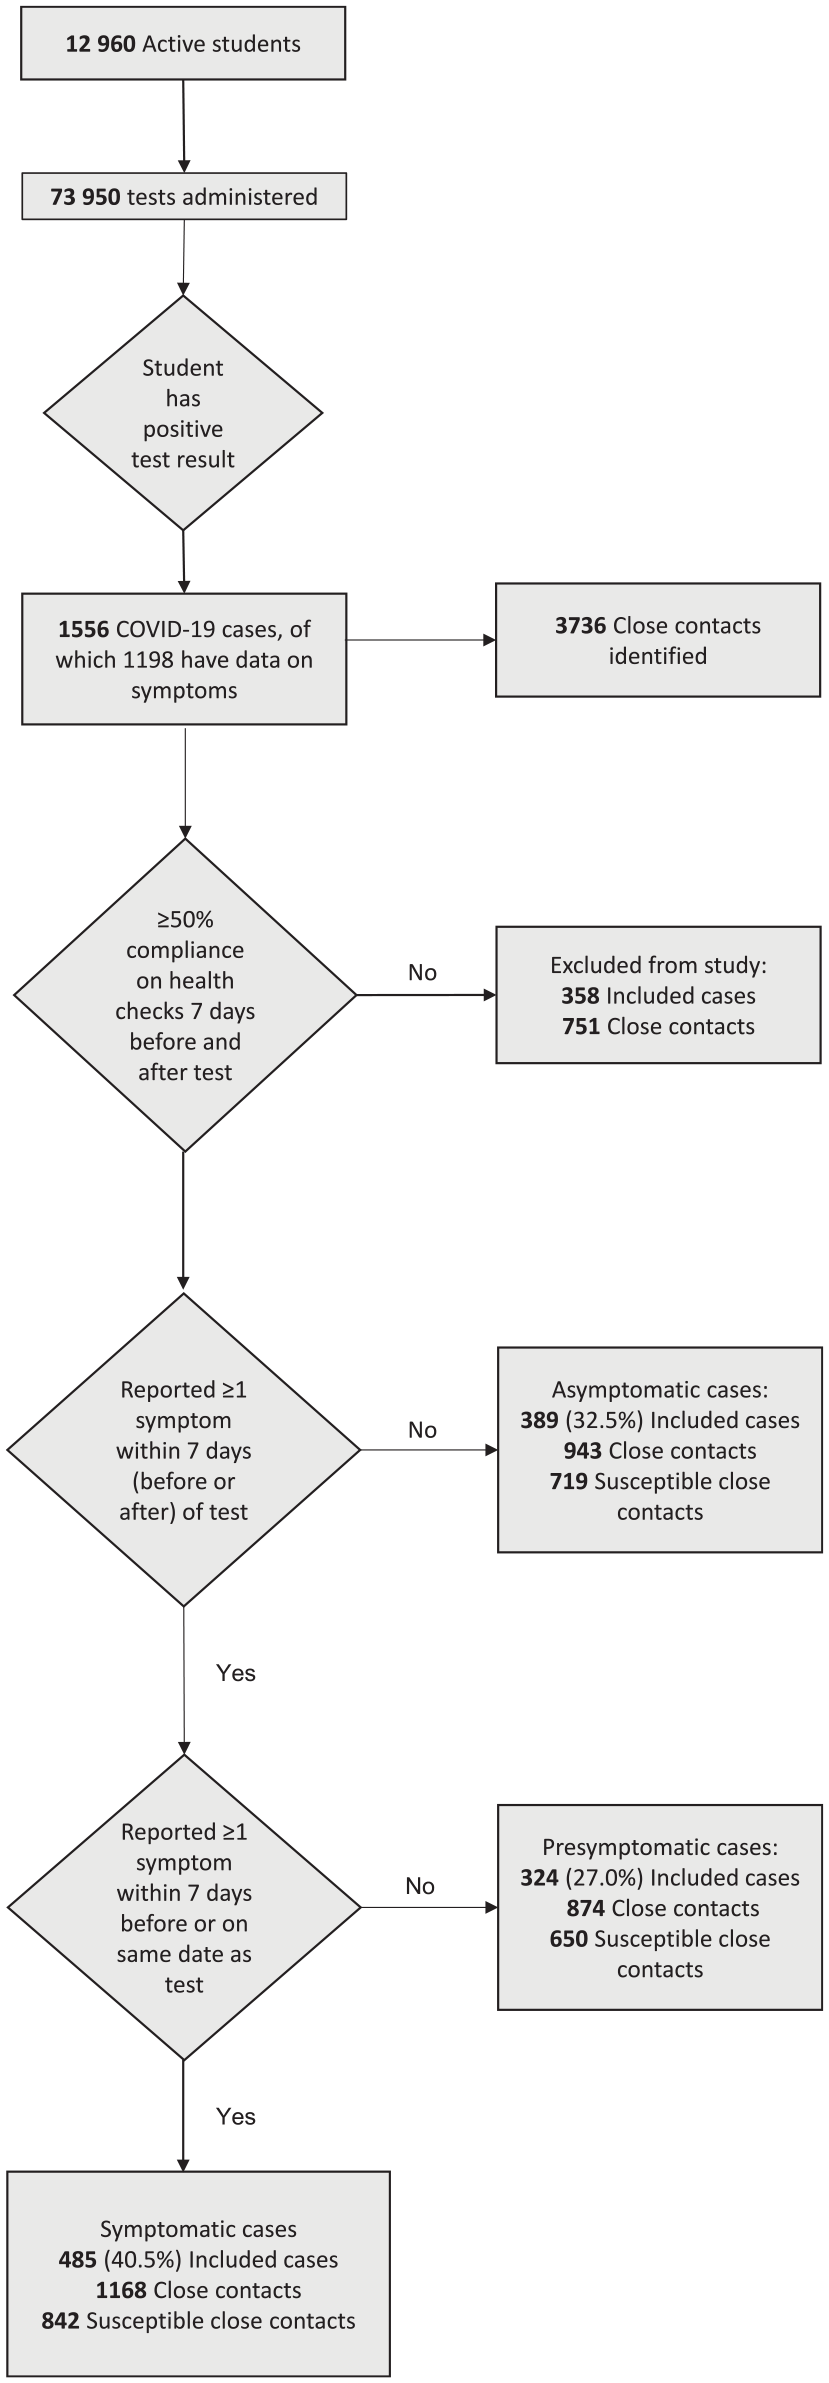
Summary of COVID-19 data collected during fall semester 2020 (August 10–November 20) among students at the University of Notre Dame, Indiana. Each student was required to submit electronically a daily health check, documenting whether they had experienced any of the 11 symptoms or suspected they had been exposed to COVID-19.
Data Linking
Data on demographic characteristics, daily health checks, COVID-19 test results, and close contacts collected by the university were all recorded with unique identification numbers. The data used for analysis were deidentified and linked by using anonymized unique identification numbers.
Transmission and SAR
SAR is commonly used by epidemiologists to quantify the contagiousness of a disease and is defined as the proportion of susceptible people who are infected after being exposed to a COVID-19–positive individual:
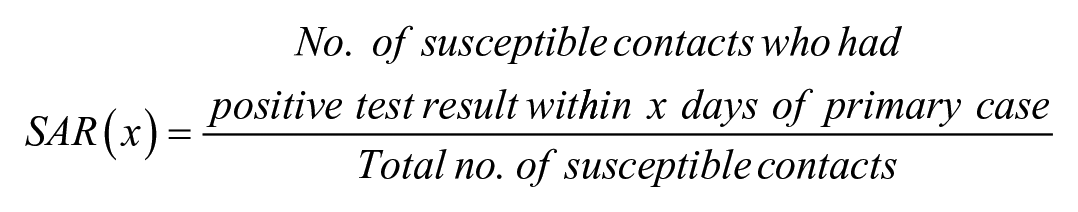
We defined x as the number of days between the index case and the positive test administration of the secondary case. In computing SAR, household members commonly serve as a proxy for susceptible contacts. However, we instead used our contact tracing observations. Although our manual contact tracing process may have missed some close contacts, these false negatives are excluded from both the numerator and denominator and, thus, have less of an impact than false positives on SAR calculation. We defined a susceptible contact as any close contact who had not received a positive test result for COVID-19 before the date of the index case’s positive test administration.
After classifying each index case as symptomatic, presymptomatic, or asymptomatic, we computed SARs by totaling all close contacts who (1) were susceptible and (2) were administered a positive test within x days after the index case’s positive test administration and then dividing by the total number of susceptible close contacts. Because it is impossible to determine the true source of transmission in cases of multiple exposure (absent genetic lineage analysis), in the infrequent cases in which a susceptible individual was reported as a close contact of multiple index cases, we attributed that individual to each index case.
To analyze the relationship of individual symptoms to transmission, we tracked the types of symptoms reported by symptomatic students and calculated the percentage of students who reported each symptom. We also tracked the average timing of onset and duration of each symptom. Then, for each symptom assessed (Box), we computed SARs for the students who reported that symptom on each day relative to their positive test result. We compared these SARs with SARs for students who did not report that symptom and used 2-sided Fisher exact tests at the P = .05 level to determine significant differences.
We conducted all analyses by using Python version 3.7 (Python Software Foundation). We used z tests at the α = .05 level to determine significant differences in proportions among the 3 categories of SARs (symptomatic index cases, presymptomatic index cases, and asymptomatic index cases).
The University of Notre Dame Institutional Review Board reviewed the research protocol and its use of deidentified data and determined it to be exempt from human subjects research regulations (approval no. 20-12-6364).
Results
Our sample was composed entirely of university students, most of whom were undergraduates (92%), non-Hispanic White (74%), aged 18-23 years (67%), and living in congregate on-campus housing (60%). Of the 1198 positive cases with data on symptoms, 389 (32.5%) were classified as asymptomatic, 485 (40.5%) as symptomatic, and 324 (27.0%) as presymptomatic (Table; Figure 1; Supplementary Table 1).
Summary of each COVID-19 symptom category, by race and ethnicity and sex, among students with COVID-19 (N = 1198) at the University of Notre Dame, Indiana, fall semester 2020 a
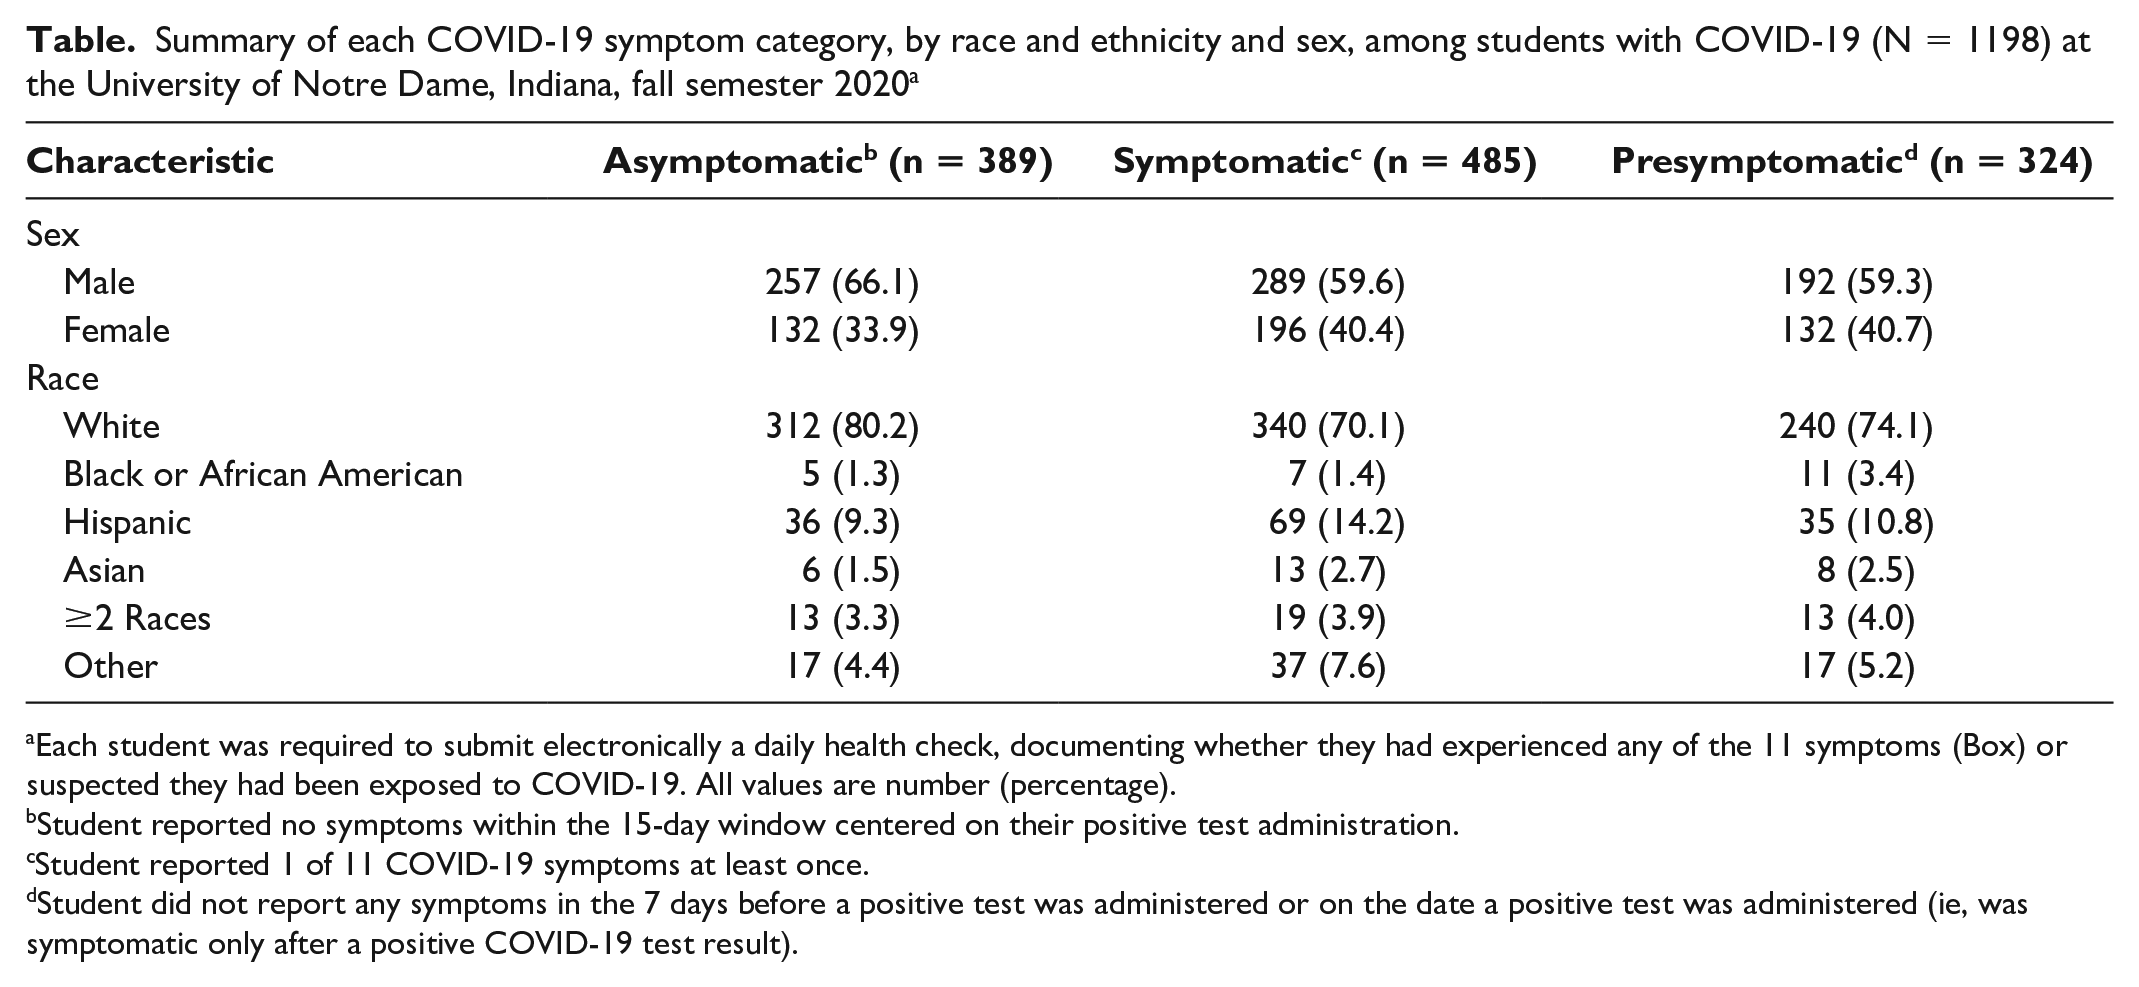
Each student was required to submit electronically a daily health check, documenting whether they had experienced any of the 11 symptoms (Box) or suspected they had been exposed to COVID-19. All values are number (percentage).
Student reported no symptoms within the 15-day window centered on their positive test administration.
Student reported 1 of 11 COVID-19 symptoms at least once.
Student did not report any symptoms in the 7 days before a positive test was administered or on the date a positive test was administered (ie, was symptomatic only after a positive COVID-19 test result).
In the first 4 days after the index case was administered a positive test, the SAR was highest for symptomatic index cases, followed by presymptomatic index cases, and lowest for asymptomatic index cases. After day 4, the SAR for presymptomatic index cases exceeded the SAR for symptomatic index cases, but the 2 values became mostly coincident. All 3 SARs became relatively flat 7 days after the index case’s positive test result.
For all 3 types of cases, after accounting for a 14-day potential transmission window, the SAR leveled off after about day 7 (Figure 2; Supplementary Table 2). The final SAR was 0.19 (95% CI, 0.14-0.24) for asymptomatic index cases, 0.25 (95% CI, 0.21-0.30) for presymptomatic index cases, and 0.25 (95% CI, 0.19-0.31) for symptomatic index cases. We found no significant difference between symptomatic and presymptomatic SAR on day 14 (P = .99); however, symptomatic SAR was significantly greater than asymptomatic SAR (P = .001). The RRs of transmission were 0.75 (95% CI, 0.54-1.07) and 1.00 (95% CI, 0.75-1.38) for asymptomatic cases and presymptomatic cases, respectively, compared with symptomatic cases.
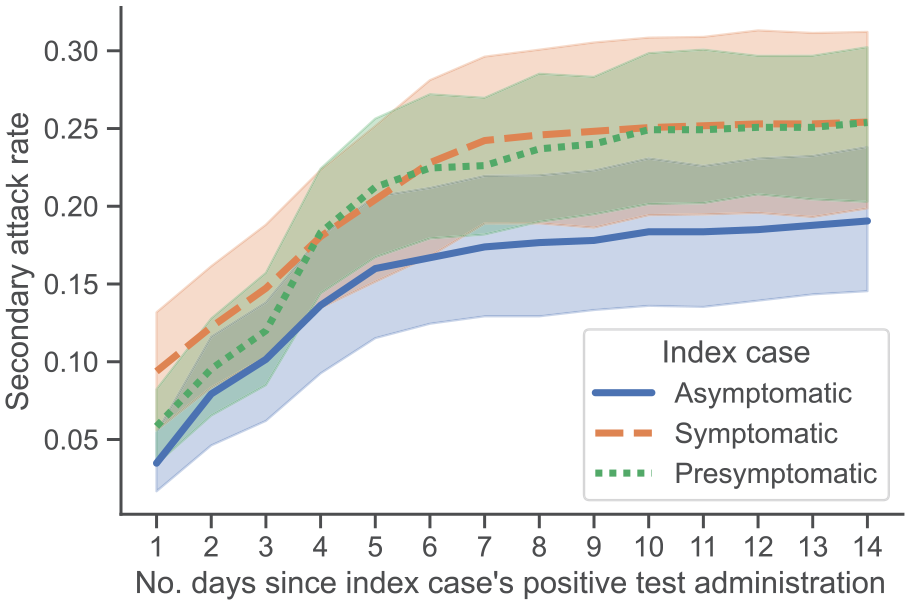
Secondary attack rates (SARs), defined as the proportion of individuals who are infected with COVID-19 after being exposed to a COVID-19–positive individual, calculated for 3 categories of index cases of COVID-19 among students at the University of Notre Dame, Indiana, fall semester 2020 (August 10–November 20). We calculated the SAR at each day for asymptomatic, symptomatic, and presymptomatic cases. Each student was required to submit electronically a daily health check, documenting whether they had experienced any of the 11 symptoms or suspected they had been exposed to COVID-19. Shaded regions indicate 95% CIs.
Symptomatic Cases and Transmission
Of the 1198 cases with data on symptoms, 807 (67.4%) were symptomatic cases; among these cases, we observed significant variety in the timing and symptoms reported. For example, the most-reported symptoms—headache and congestion—were reported by 38.8% and 35.6% of the 1198 cases, respectively. All other symptoms were reported in fewer than 28% of cases. In addition, the most correlated pair of symptoms—fatigue and body aches/chills—produced a correlation coefficient of 0.41. We observed different average onset times and durations of each symptom; 75.2% of cases reported experiencing no symptoms on the day of their positive test administration. This number decreased to 50.2% at 2 days after a positive test administration.
The presence or absence of symptoms affected transmission rates. The difference in day 14 SAR (between people who reported the symptom and people who did not) was significant for some symptoms including fever (P < .001), new dry cough (P = .002), shortness of breath (P = .04), and sore throat (P < .001), and these symptoms were reported shortly after the positive test result (Figure 3). For body aches/chills, the difference in SAR was significant (P = .003), but this symptom was not reported until 4 days after the index case’s positive test result. For all 5 of these symptoms, the SAR stabilized at roughly 30.0%, compared with 25.4% for all symptomatic cases. For all other symptoms, we found no significant difference in SAR.
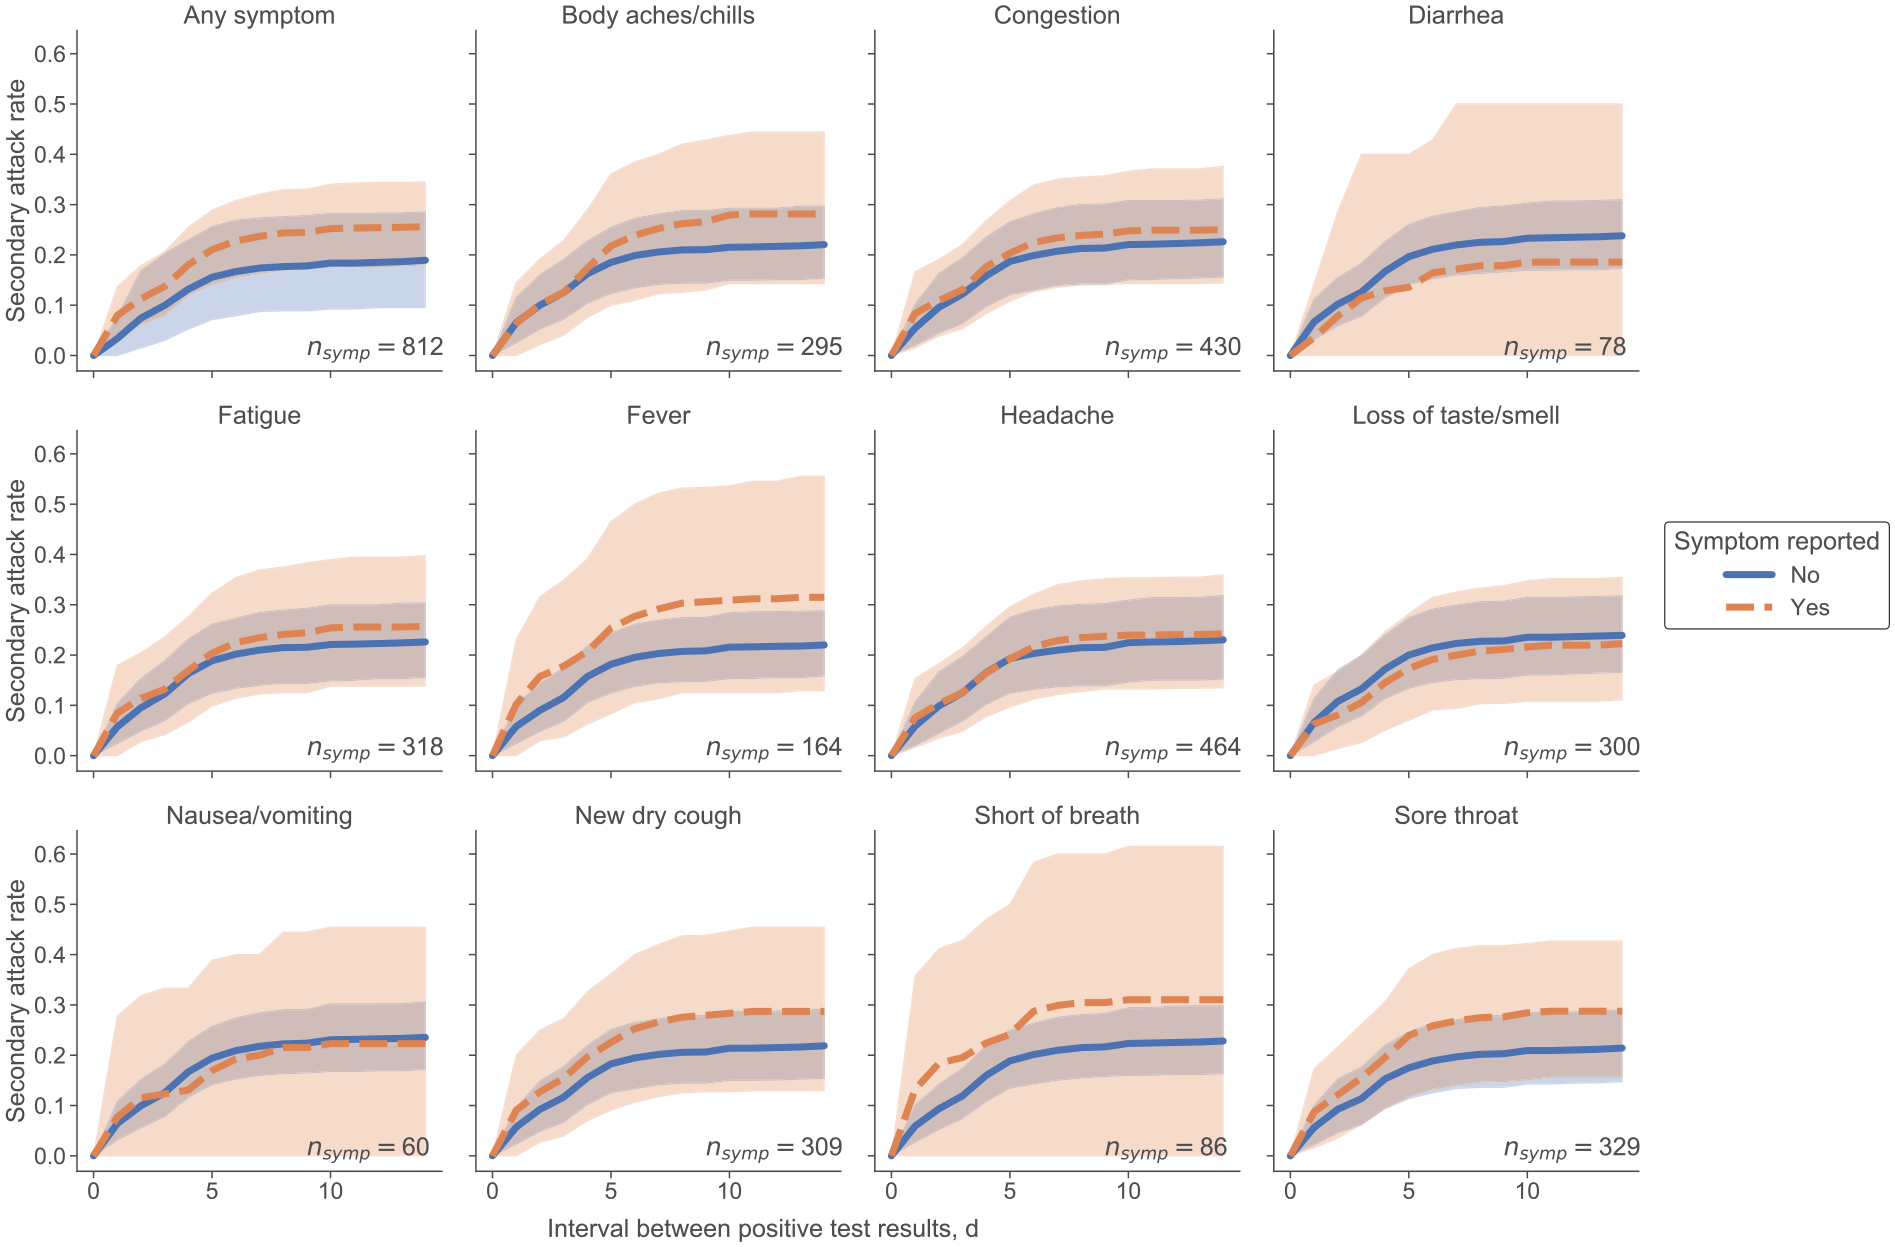
Secondary attack rates (SARs) based on the presence or absence of each reported COVID-19 symptom in the index case among students at the University of Notre Dame, Indiana, fall semester 2020 (August 10–November 20). nsymp is the number of COVID-19 cases in which the student reported the symptom at least once in the 15-day window surrounding their positive test administration. Each student was required to submit electronically a daily health check, documenting whether they had experienced any of the 11 symptoms or suspected they had been exposed to COVID-19. Shaded regions indicate 95% CIs.
Discussion
Our key finding that the RRs of transmission were 0.75 (95% CI, 0.54-1.07) and 1.00 (95% CI, 0.75-1.38) for asymptomatic cases and presymptomatic cases, respectively, compared with symptomatic cases, suggests that prior studies underestimated the transmissibility of asymptomatic and presymptomatic cases,10,12 although we acknowledge that some of the CIs in our study overlap with the CIs in the previous studies. In particular, the meta-review provided by Buitrago-Garcia et al estimated RRs of 0.35 (95% CI, 0.10-1.27) and 0.63 (95% CI, 0.18-2.26) for asymptomatic cases and presymptomatic cases, respectively, compared with symptomatic cases. These estimates were based on the results of 5 studies of asymptomatic transmission and 2 studies of presymptomatic transmission, which relied on a small number of data points and varied widely in their results. For asymptomatic transmission, the lowest RR (0.06; 95% CI, 0.01-0.46) recorded only 1 secondary case among 305 close contacts of asymptomatic index cases, 28 and the largest study—which considered 2644 close contacts of symptomatic index cases—estimated an RR of 0.64 (95% CI, 0.04-10.51) from 0 secondary cases and 91 close contacts of asymptomatic index cases. 29 Chaw et al 30 recorded the highest number of secondary cases—15 among 691 close contacts of asymptomatic index cases—and produced the highest RR (0.78; 95% CI, 0.42-1.46). For presymptomatic transmission, the estimate provided by Buitrago-Garcia et al relied on 2 studies that considered 0 and 2 secondary cases, respectively, among 11 and 299 close contacts of presymptomatic index cases.29,31 The estimates from our study add substantially to the evidence base.
The higher initial SAR for symptomatic index cases is likely due to students getting tested late in their infections and therefore having more time to infect others before being isolated. Among all cases, many students were presymptomatic, which is relevant for designing surveillance testing programs. That all 3 SARs became relatively flat 7 days after the index case’s positive test result has implications for how long contact-traced individuals need to remain in quarantine or isolation. These findings are consistent with the decision of some local health departments to release from quarantine individuals with a negative test result after day 7 or day 10.
In symptomatic cases, some symptoms, such as congestion and headache, manifested early on, whereas other symptoms, such as shortness of breath and loss of taste/smell, manifested later, suggesting that individuals who are experiencing even mild symptoms should exercise caution. However, even the most frequently reported symptoms (eg, headache, congestion) occurred in fewer than half of COVID-19 hosts. The SAR was generally higher if the individual was symptomatic, except cases in which the symptom was diarrhea, nausea/vomiting, or loss of taste/smell. Loss of taste or smell is a commonly cited symptom of COVID-19, although more recent evidence indicates a potential genetic linkage, which is consistent with our finding that it was not associated with increased risk of transmission. 32 We additionally observed that the presence of some symptoms, such as a fever or a dry cough, increased the likelihood of transmission between close contacts by as much as 10%. These results imply that anyone exhibiting fever, body aches/chills, new dry cough, shortness of breath, or a sore throat should exercise caution. However, symptom checks might not provide sufficient details about probability of transmission, especially given COVID-19’s high capability for asymptomatic transmission.
Limitations
Our study had several potential limitations. First, the university setting made the cohort of positive COVID-19 cases relatively homogeneous (predominantly young and White, living in congregate housing). Second, our analysis assumed a closed community and cannot account for intercommunity transmission. Third, our symptom analysis relied on accurate and consistent self-reporting. Although we discarded data from students who were less than 50% compliant with health check completion around the time of their positive test administration, this threshold was arbitrary and cannot fully address other problems such as false-negative test results. Because an individual can be exposed via multiple index cases, they can also be included multiple times in the SAR calculations. For a COVID-19 case with multiple exposures, it is impossible to discard duplicates without knowledge of the true source of transmission. Similarly, students who reported multiple exposures but did not have a positive test result were also double counted. In this study, 224 (12.7%) of 1757 unique susceptible contacts reported exposure from index cases across >1 symptom presentation category (symptomatic, asymptomatic, presymptomatic). Although we explored approaches to eliminate the possibility of overlap, these approaches did not substantially change the results, and we acknowledge that overlap is a source of uncertainty.
COVID-19 Variants
The emergence of new variants complicates the interpretation and application of our results because the types of symptoms experienced by people with COVID-19 and the timing of symptom onset continue to evolve. We are not aware of any published or prepublished estimates of SARs related to the Omicron or Delta variants, and the ability to determine the SAR from population data is limited by an increasing unwillingness to name close contacts or even respond to telephone calls from contact tracers. 33 In a preprint analysis of data collected on National Basketball Association players, among Omicron cases detected ≤1 day after a previous negative or inconclusive COVID-19 test result, 52% were deemed infectious (based on cycle threshold values <30) 5 days after a positive test result, 25% at 6 days after a positive test result, and 13% at 7 days after a positive test result. Among Omicron cases detected >2 days after a previous negative or inconclusive test result, 39% were deemed infectious 5 days after a positive test result, 33% at 6 days after a positive test result, and 22% at 7 days after a positive test result. 34 Although additional work is required to determine the SAR for variants such as Omicron, our study provides both a methodological framework and baseline estimates for SARs.
Finally, SARs may change for new variants of COVID-19, so additional analysis may be required as the virus evolves. In particular, the higher transmissibility and/or virulence of each subsequent major variant of concern—Alpha, Delta, Omicron35,36—may mean that the estimates provided here are less relevant, or perhaps more of a lower bound, in settings where these or additional other variants dominate. However, our estimates of transmission can be integrated with epidemiological models18,37 to better characterize the overall reproduction rate of COVID-19 along with the speed of spread of the variants.
Conclusion
The breadth and variety of COVID-19 symptoms, paired with the variable timing of symptom onset, will continue to complicate our ability to identify and predict definitively who is infected. Our analysis suggests that daily health checks that rely on symptom reporting to determine risk might be unreliable, given that asymptomatic and presymptomatic hosts may be infectious. Our results also suggest that, in the ongoing fight against COVID-19, additional interventions that reduce community transmission should continue to be considered, such as the current recommendations of the Centers for Disease Control and Prevention for wearing face masks, social distancing, and getting vaccinated. 38
Supplemental Material
sj-docx-1-phr-10.1177_00333549221110300 – Supplemental material for Symptomatic, Presymptomatic, and Asymptomatic Transmission of SARS-CoV-2 in a University Student Population, August–November 2020
Supplemental material, sj-docx-1-phr-10.1177_00333549221110300 for Symptomatic, Presymptomatic, and Asymptomatic Transmission of SARS-CoV-2 in a University Student Population, August–November 2020 by Steven J. Krieg, Jennifer J. Schnur, Marie Lynn Miranda, Michael E. Pfrender and Nitesh V. Chawla in Public Health Reports
Footnotes
Acknowledgements
Steven J. Krieg and Jennifer J. Schnur contributed equally to this work. The authors thank Carolina Avendano, PhD, Liz Rulli, MS, and Aaron Lilienfeld, MS, for the University of Notre Dame’s COVID-19 data collection.
Declaration of Conflicting Interests
The authors declared no potential conflicts of interest with respect to the research, authorship, and/or publication of this article.
Funding
The authors received no financial support for the research, authorship, and/or publication of this article.
Supplemental Material
Supplemental material for this article is available online.
References
Supplementary Material
Please find the following supplemental material available below.
For Open Access articles published under a Creative Commons License, all supplemental material carries the same license as the article it is associated with.
For non-Open Access articles published, all supplemental material carries a non-exclusive license, and permission requests for re-use of supplemental material or any part of supplemental material shall be sent directly to the copyright owner as specified in the copyright notice associated with the article.