
Abstract
Objective
Overall trends in rates of fully alcohol-attributable mortality may mask disparities among demographic groups. We investigated overall, demographic, and geographic trends in fully alcohol-attributable mortality rates in Minnesota.
Methods
We obtained mortality data from Minnesota death certificates and defined fully alcohol-attributable deaths as deaths that would not occur in the absence of alcohol. We calculated age-adjusted death rates during 2000-2018 using 5-year moving averages stratified by decedents’ characteristics and geographic location.
Results
Chronic conditions accounted for most of the alcohol-attributable deaths in Minnesota (89% during 2014-2018). Alcohol-attributable mortality rates per 100 000 population increased from an average rate of 8.0 during 2000-2004 to 12.6 during 2014-2018. During 2000-2018, alcohol-attributable mortality rates were highest among males (vs females), adults aged 55-64 (vs other ages), and American Indian/Alaska Native people (vs other racial and ethnic groups) and lowest among people aged ≤24 years and Asian or Pacific Islander people. During 2014-2018, the alcohol-attributable mortality rate among American Indian/Alaska Native people was more than 5 times higher than the overall mortality rate in Minnesota.
Conclusions
Results from this study may increase awareness of racial and ethnic disparities and continuing health inequities and inform public health prevention efforts, such as those recommended by the Community Preventive Services Task Force, including regulating alcohol outlet density and increasing alcohol taxes.
Excessive alcohol use is an important public health concern and is one of the leading causes of preventable death in the United States, contributing to more than 95 000 deaths each year. 1,2 Minnesota has a higher prevalence of alcohol consumption than the nation. In 2019, 60.5% of Minnesota adults aged ≥18 reported drinking alcohol during the past month, compared with 54.1% of adults aged ≥18 nationally; 20.7% of Minnesota adults compared with 16.8% of adults nationwide reported binge drinking (ie, ≥5 drinks on 1 occasion for men, ≥4 drinks on 1 occasion for women). 3 Per-capita consumption of alcohol has increased significantly since 2000 in both the United States and Minnesota. 4,5 In 2018, Minnesotans aged ≥14 years drank about 94 more standard drinks (defined as 14 g of pure alcohol, or 12 oz of regular beer, 5 oz of wine, or 15 oz of distilled spirits) than people aged ≥14 years in the United States. 5
Alcohol consumption contributes to mortality in several ways. This study focused on deaths fully attributable to alcohol use, but alcohol also contributes to other partially alcohol-attributable acute deaths, such as motor vehicle crashes 6 and falls, 7 and chronic conditions such as cancer and heart disease. 8 The Centers for Disease Control and Prevention (CDC) Alcohol-Related Disease Impact application estimates the annual average number of alcohol-attributable deaths for 58 alcohol-related conditions, 15 of which are fully attributable to alcohol (meaning the condition would not occur in the absence of alcohol). Data from the Alcohol-Related Disease Impact application estimates for 2011-2015 indicate that about 37% of alcohol-attributable deaths in Minnesota were from fully alcohol-attributable conditions. 9 Although partially alcohol-attributable conditions contribute more to mortality than fully alcohol-attributable conditions do, monitoring fully alcohol-attributable conditions is useful for assessing changes related to alcohol use, because these deaths are affected by fewer factors besides alcohol than partially alcohol-attributable conditions.
Demographic differences exist in alcohol consumption patterns. National surveys of alcohol use indicate that men consume more alcohol, are more likely to binge drink, and are more likely to have alcohol use disorder (AUD) than women. 10,11 Alcohol consumption and binge drinking typically peak during young adulthood and begin to taper off after age 30. 11 The age one initiates drinking alcohol and the degree to which alcohol consumption decreases as one ages have a large effect on the likelihood of chronic effects of alcohol developing in older age. Earlier initiation of alcohol use is related to AUD and harmful chronic effects of alcohol. 12 -14 Excessive alcohol use among older adults is also important to monitor because it can worsen preexisting mental and physical health problems and can interact with certain medications. 15,16
Historical, cultural, societal, political, and socioeconomic forces have contributed to disparate rates of alcohol use and misuse and the related harms across racial/ethnic groups. 17 -19 In the United States, for example, the prevalence of binge drinking is highest among non-Hispanic White adults, but binge drinking frequency is highest among non-Hispanic American Indian/Alaska Native (AI/AN) adults, and more subtle differences exist between non-Hispanic Black/African American and Hispanic drinking and binge drinking behaviors. 11 AUDs are also most prevalent among AI/AN people compared with other racial and ethnic groups. 19
The demographic disparities in alcohol-attributable mortality at the national level, particularly research indicating disparate effects of alcohol-attributable mortality among AI/AN people, 20,21 indicate a need to explore alcohol-attributable mortality at the state level in Minnesota, because people in Minnesota consume more alcohol than people in the United States on average. 22 The objective of this study was to assess trends in rates of fully alcohol-attributable mortality in Minnesota during 2000-2018. Stratifying mortality rates from alcohol-attributable causes by sex, age, race, ethnicity, and geography may provide a more complete understanding of fully alcohol-attributable deaths in Minnesota than the overall numbers can provide and may help to identify health inequity–related disparities across demographic groups.
Methods
To ascertain fully alcohol-attributable mortality in Minnesota, we examined death certificate data from 2000 through 2018. We included data on deaths among Minnesota residents. In the years when data on out-of-state deaths of Minnesota residents were available and included in the study (2000-2016), 4.1% of fully alcohol-attributable deaths occurred outside Minnesota; however, for 2017 and 2018, because of reporting changes, data were only available for deaths that occurred in the state. We obtained Minnesota population estimates for 2000-2018 from the CDC bridged-race population estimates, and we used them to generate the 2000 US standard population weights for age adjusting. 23
We identified a death as fully attributable to alcohol if the underlying cause of death was 100% attributable to alcohol (including the following International Classification of Diseases, Tenth Revision [ICD-10] codes: F10.0, R78.0, X54, X65, Y15, E24.4, F10.1-9, G31.2, G62.1, G72.1, I42.6, K29.2, K70.0-9, K85.2, and K86.0). 24,25 Because we used the underlying cause of death, not the contributing causes of death, in this study, we did not include T51.0 or T51.9 as was done in another study. 25 We defined chronic liver disease (CLD) as ICD-10 codes K70.0-9; we further investigated CLD deaths as the cause of death responsible for the largest number of fully alcohol-attributable deaths from chronic causes. We combined racial and ethnic categories for Minnesota death certificate records to match the CDC bridged-race population estimates, including 4 non-Hispanic categories: White, Black or African American (referred to as Black), AI/AN, or Asian or Pacific Islander. To assess ethnicity, we categorized decedents as Hispanic or Latino or not Hispanic or Latino. For geography, we divided the state into 2 regions: (1) the densely populated 7-county metropolitan area centered on Minneapolis and St. Paul and (2) Greater Minnesota, which is more rural than the 7-county metropolitan area, has several increasingly urban areas, and encompasses the remaining 80 counties in Minnesota. 26
We calculated crude fully alcohol-attributable mortality rates for Minnesota and for each demographic/regional group, expressed as deaths per 100 000 population, and then calculated age-adjusted mortality rates for people aged ≥15 years with weights based on 2000 US standard populations. Furthermore, to generate more robust and reliable death rates than single-year estimates, we calculated 5-year moving averages of the age-adjusted death rates (years shown in graphs are the midpoint of each 5-year period). We conducted all analyses in R version 4.1.0 (R Foundation for Statistical Computing). This study did not meet the federal definition of human subjects research; as such, institutional review board review was waived.
Results
We identified 8543 deaths as being fully alcohol-attributable in Minnesota during 2000-2018. The average annual fully alcohol-attributable mortality rate was 8.0 per 100 000 population during 2000-2004 and 12.6 per 100 000 population during 2014-2018, a 57.6% increase (Figure 1). Chronic fully alcohol-attributable death rates per 100 000 population increased substantially (a 47.8% increase, from 7.6 in 2000-2004 to 11.2 in 2014-2018). During 2014-2018, 10.7% of all fully alcohol-attributable deaths were from acute causes and 89.3% were from chronic causes.
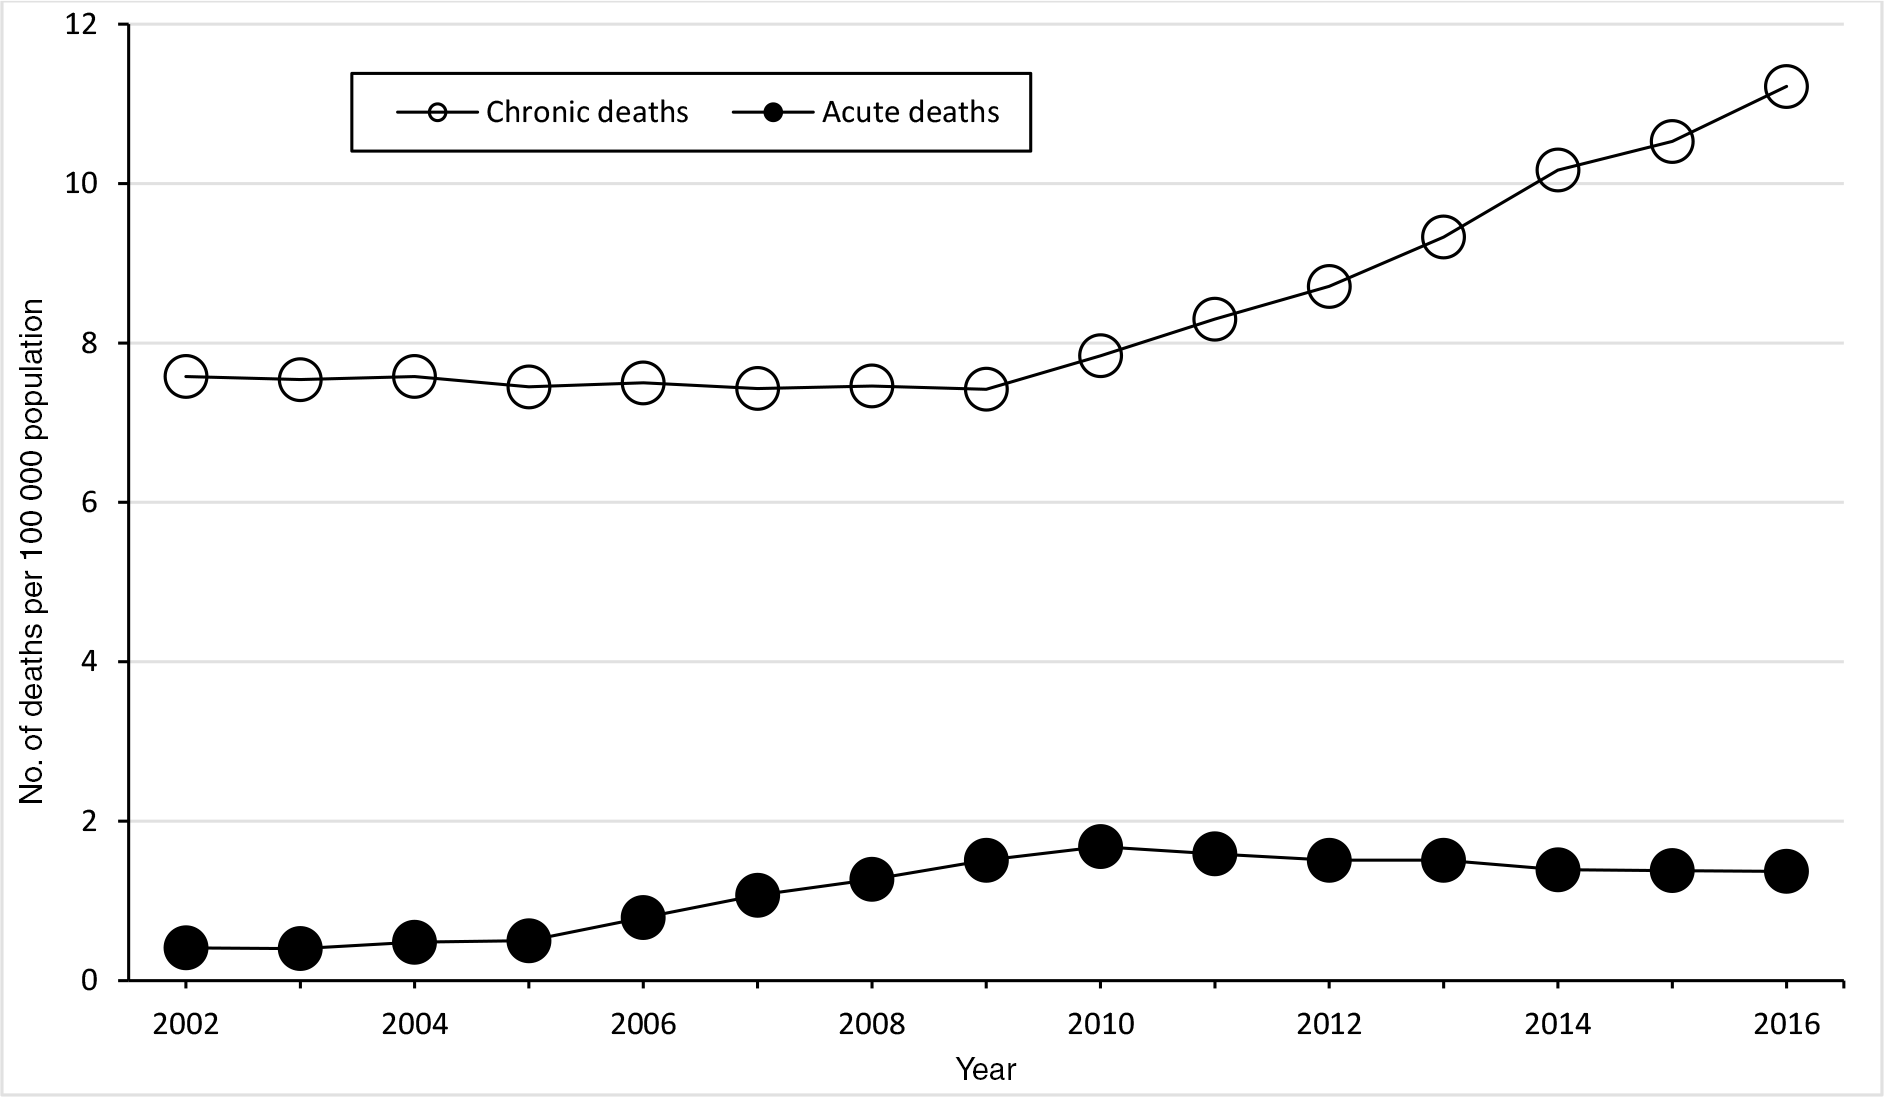
Fully alcohol-attributable age-adjusted mortality rates per 100 000 population in Minnesota, by type of death and year, 5-year rolling mean, 2000-2018. Data source: Minnesota Department of Health.27
Males had a higher rate of fully alcohol-attributable deaths than females in Minnesota (Figure 2). The annual average fully alcohol-attributable mortality rate per 100 000 population among males was 12.4 in 2000-2004 and 17.8 in 2014-2018 (a 43.6% increase). The rate in 2014-2018 was lower among females (7.7), but the relative rate increased more (up 93.1% from 4.0 in 2000-2004).
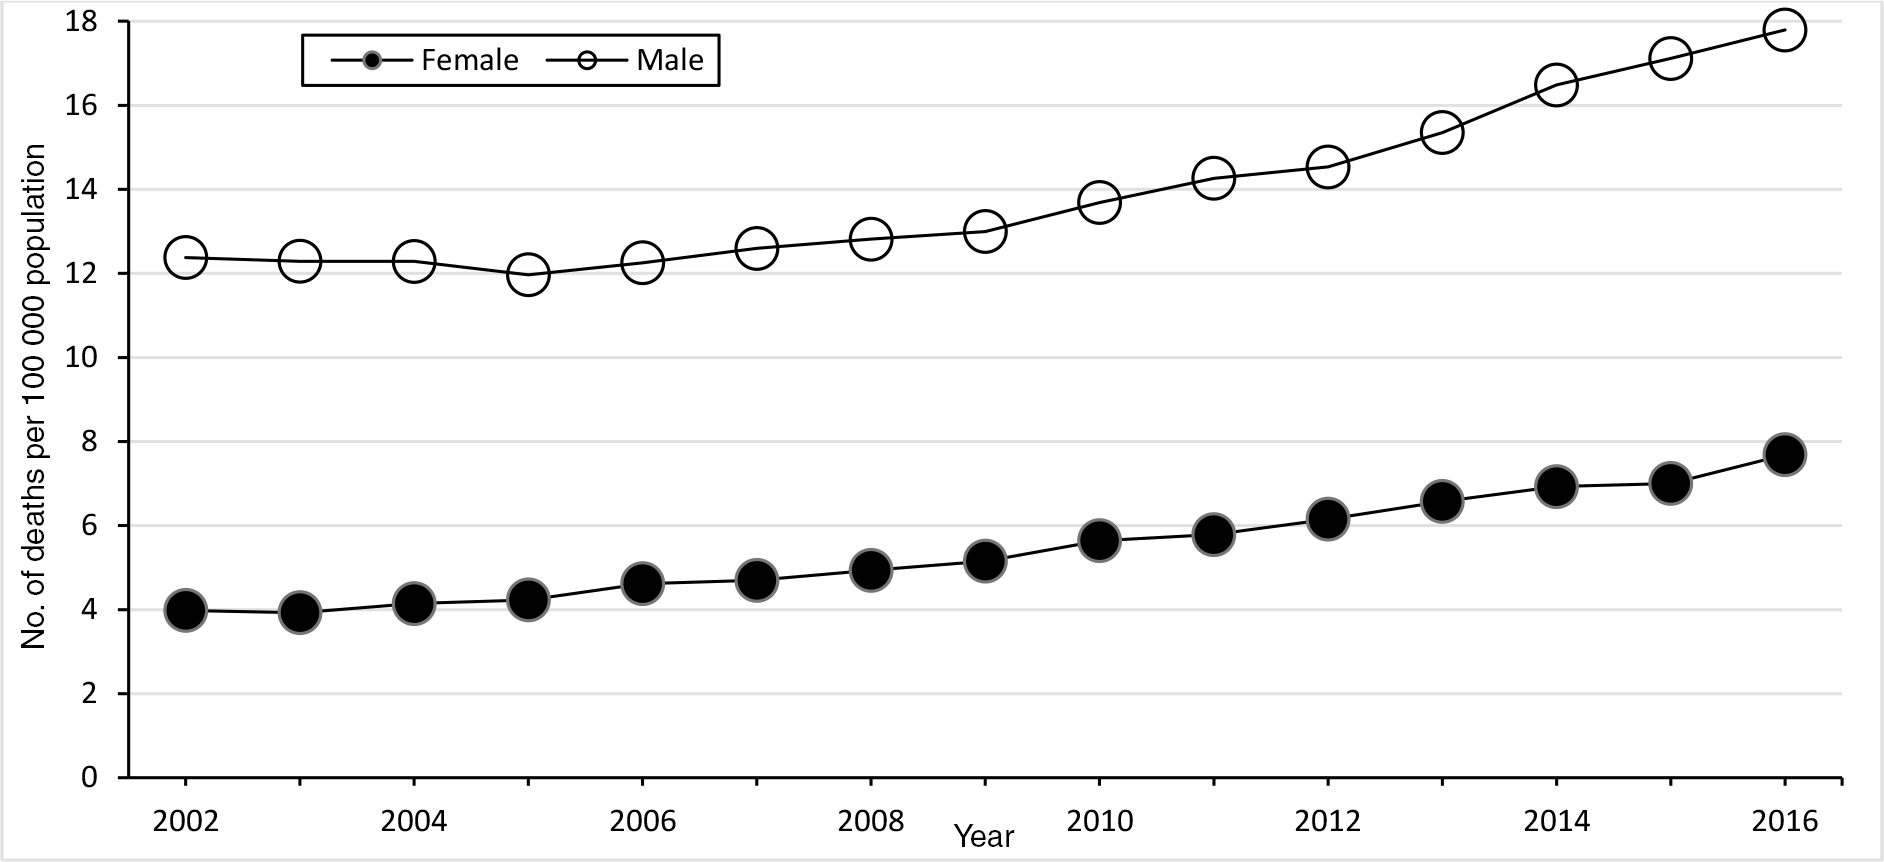
Fully alcohol-attributable age-adjusted mortality rates per 100 000 population in Minnesota, by sex and year, 5-year rolling mean, 2000-2018. Data source: Minnesota Department of Health.27
During 2000-2018, fully alcohol-attributable mortality rates increased for each racial and ethnic group; however, the highest alcohol-attributable mortality rates from 2000-2018 were among AI/AN people (Figure 3). Fully alcohol-attributable mortality rates per 100 000 population among AI/AN people increased from 43.6 in 2000-2004 to 65.3 in 2014-2018 (a 49.8% increase), among Asian/Pacific Islander people increased from 0.2 to 3.1 (a 1450% increase), among Black people increased from 9.1 to 11.2 (a 23.2% increase), and among White people increased from 7.5 to 11.9 (a 58.6% increase). Fully alcohol-attributable mortality rates among Hispanic Minnesotans decreased during the study period, from 21.1 to 13.8 (a 34.8% decrease). However, during 2014-2018, the annual average age-adjusted fully alcohol-attributable mortality rate among Hispanic or Latino Minnesotans was higher than among non-Hispanic Minnesotans: 13.8 versus 12.6 among Minnesotans who identified as non-Hispanic or Latino.
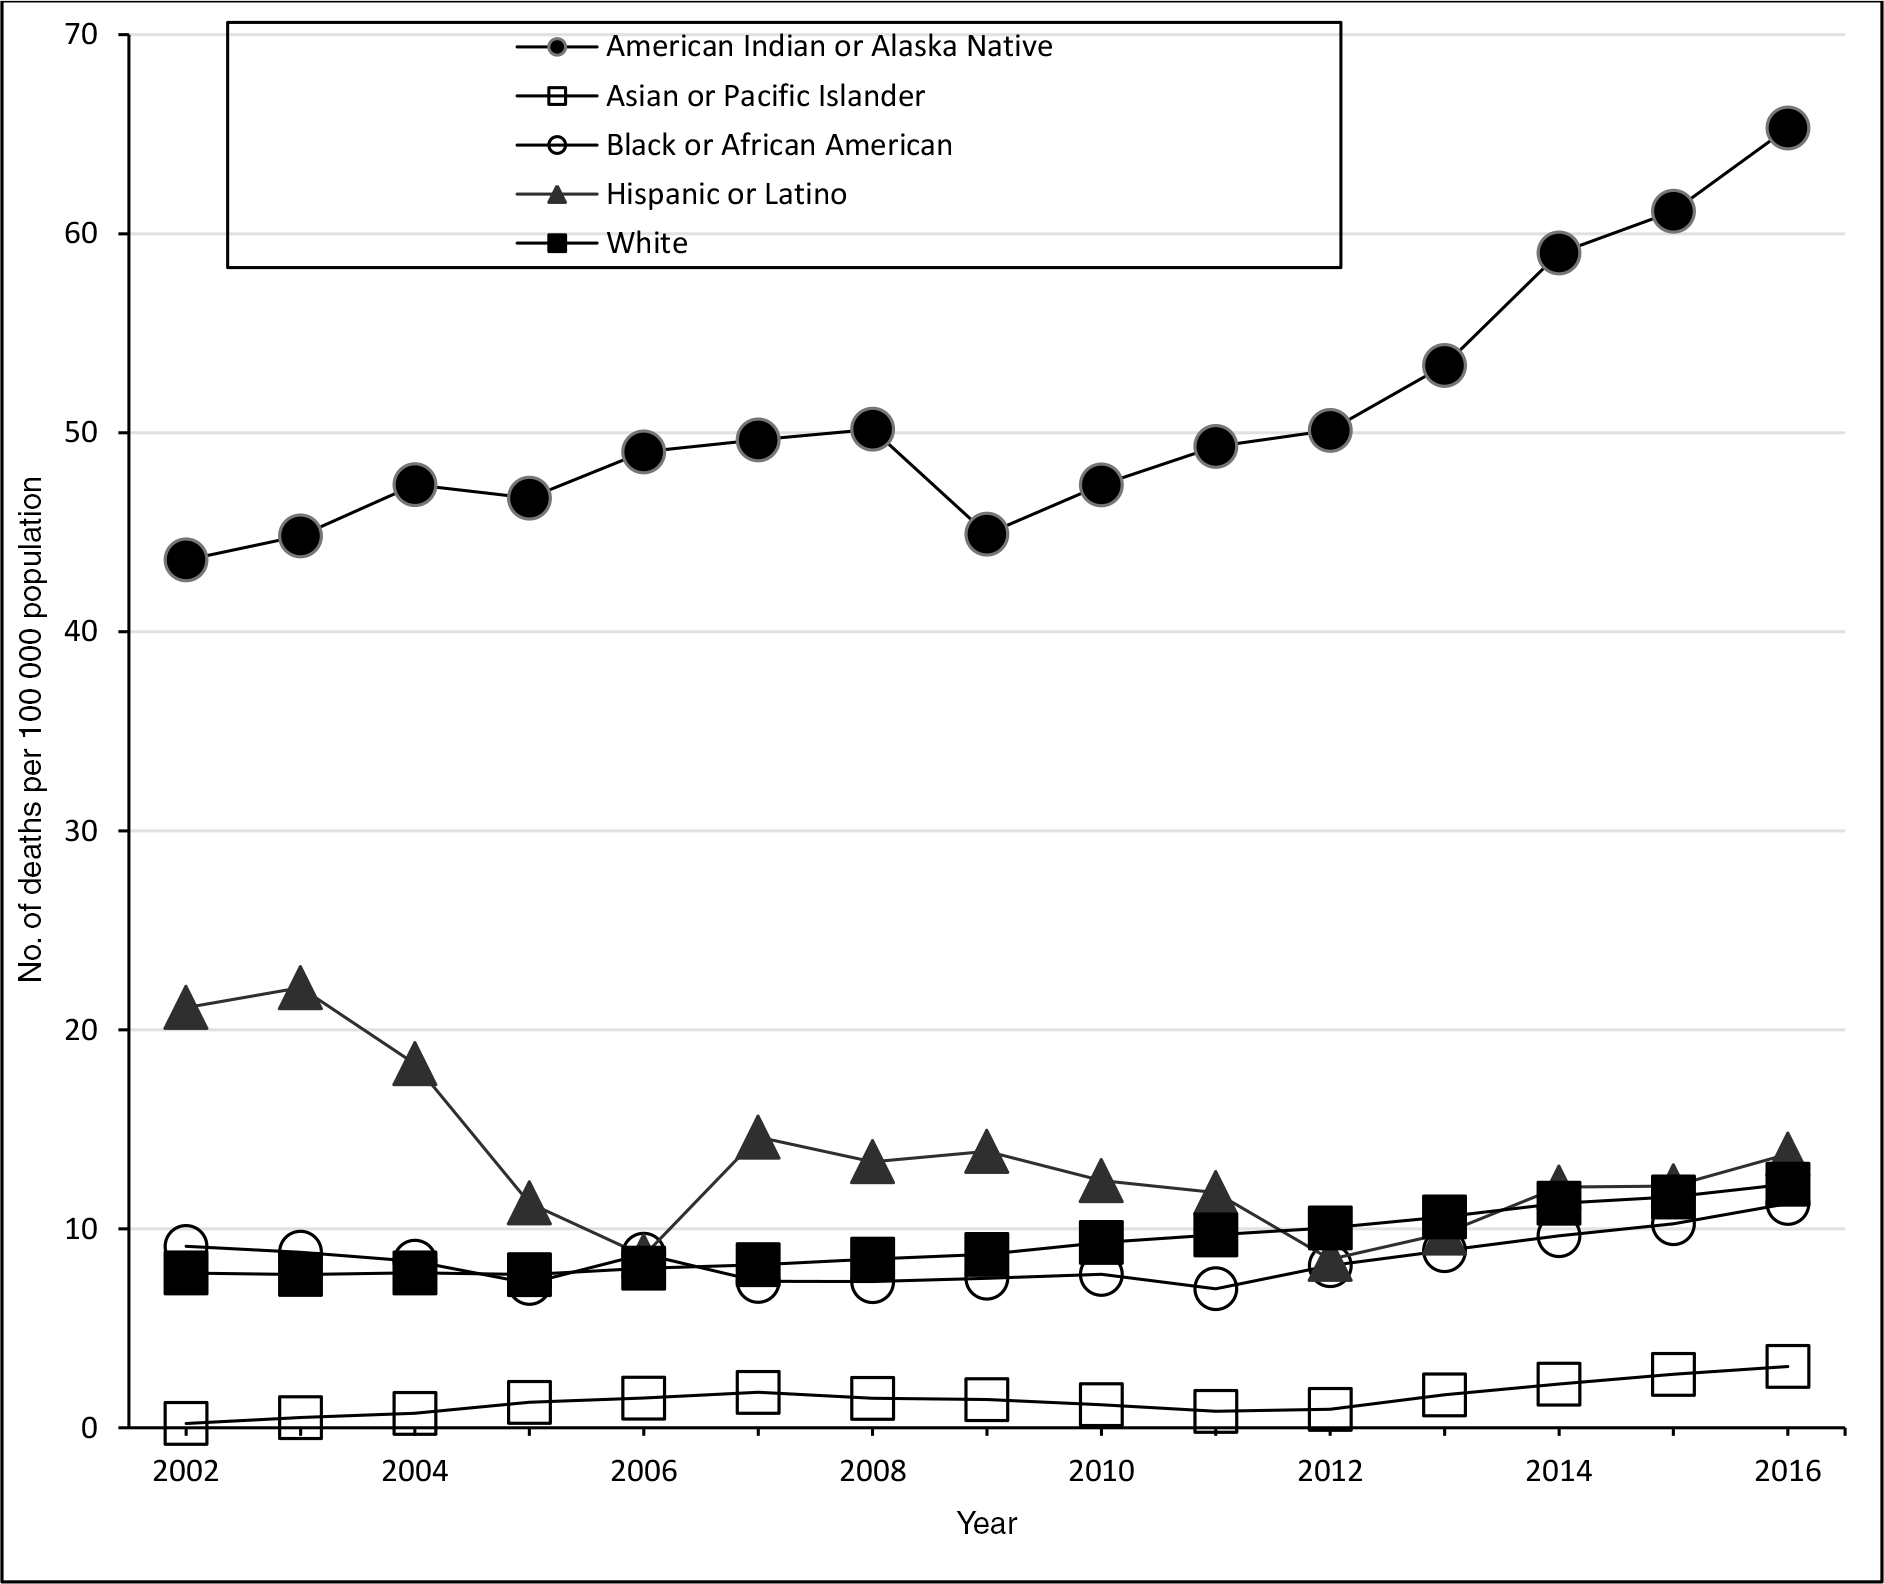
Fully alcohol-attributable age-adjusted mortality rates per 100 000 population in Minnesota, by racial and ethnic group and year, 5-year rolling mean. Data source: Minnesota Department of Health.27
Fully alcohol-attributable mortality rates varied substantially by age (Figure 4). During 2014-2018, the fully alcohol-attributable mortality rate per 100 000 population was highest among adults aged 55-64 (31.0), followed by adults aged 65-74 (24.4) and 45-54 (21.8). In addition to having the highest fully alcohol-attributable mortality rates, people in these age groups also had the highest percentage increases in alcohol-attributable mortality rates. Fully alcohol-attributable mortality rates among adults aged 45-54 increased from 14.5 in 2000-2004 to 21.8 in 2014-2018 (a 50.3% increase); among adults aged 55-64 increased from 17.1 to 31.0 (an 81.3% increase); and among adults aged 65-74 increased from 16.8 to 24.4 (a 45.4% increase). The increase in fully alcohol-attributable death rates was primarily driven by chronic causes. CLD accounted for a growing percentage of fully alcohol-attributable deaths in recent years. CLD accounted for 51.3% of alcohol-attributable deaths during 2000-2004 and 62.0% during 2014-2018.
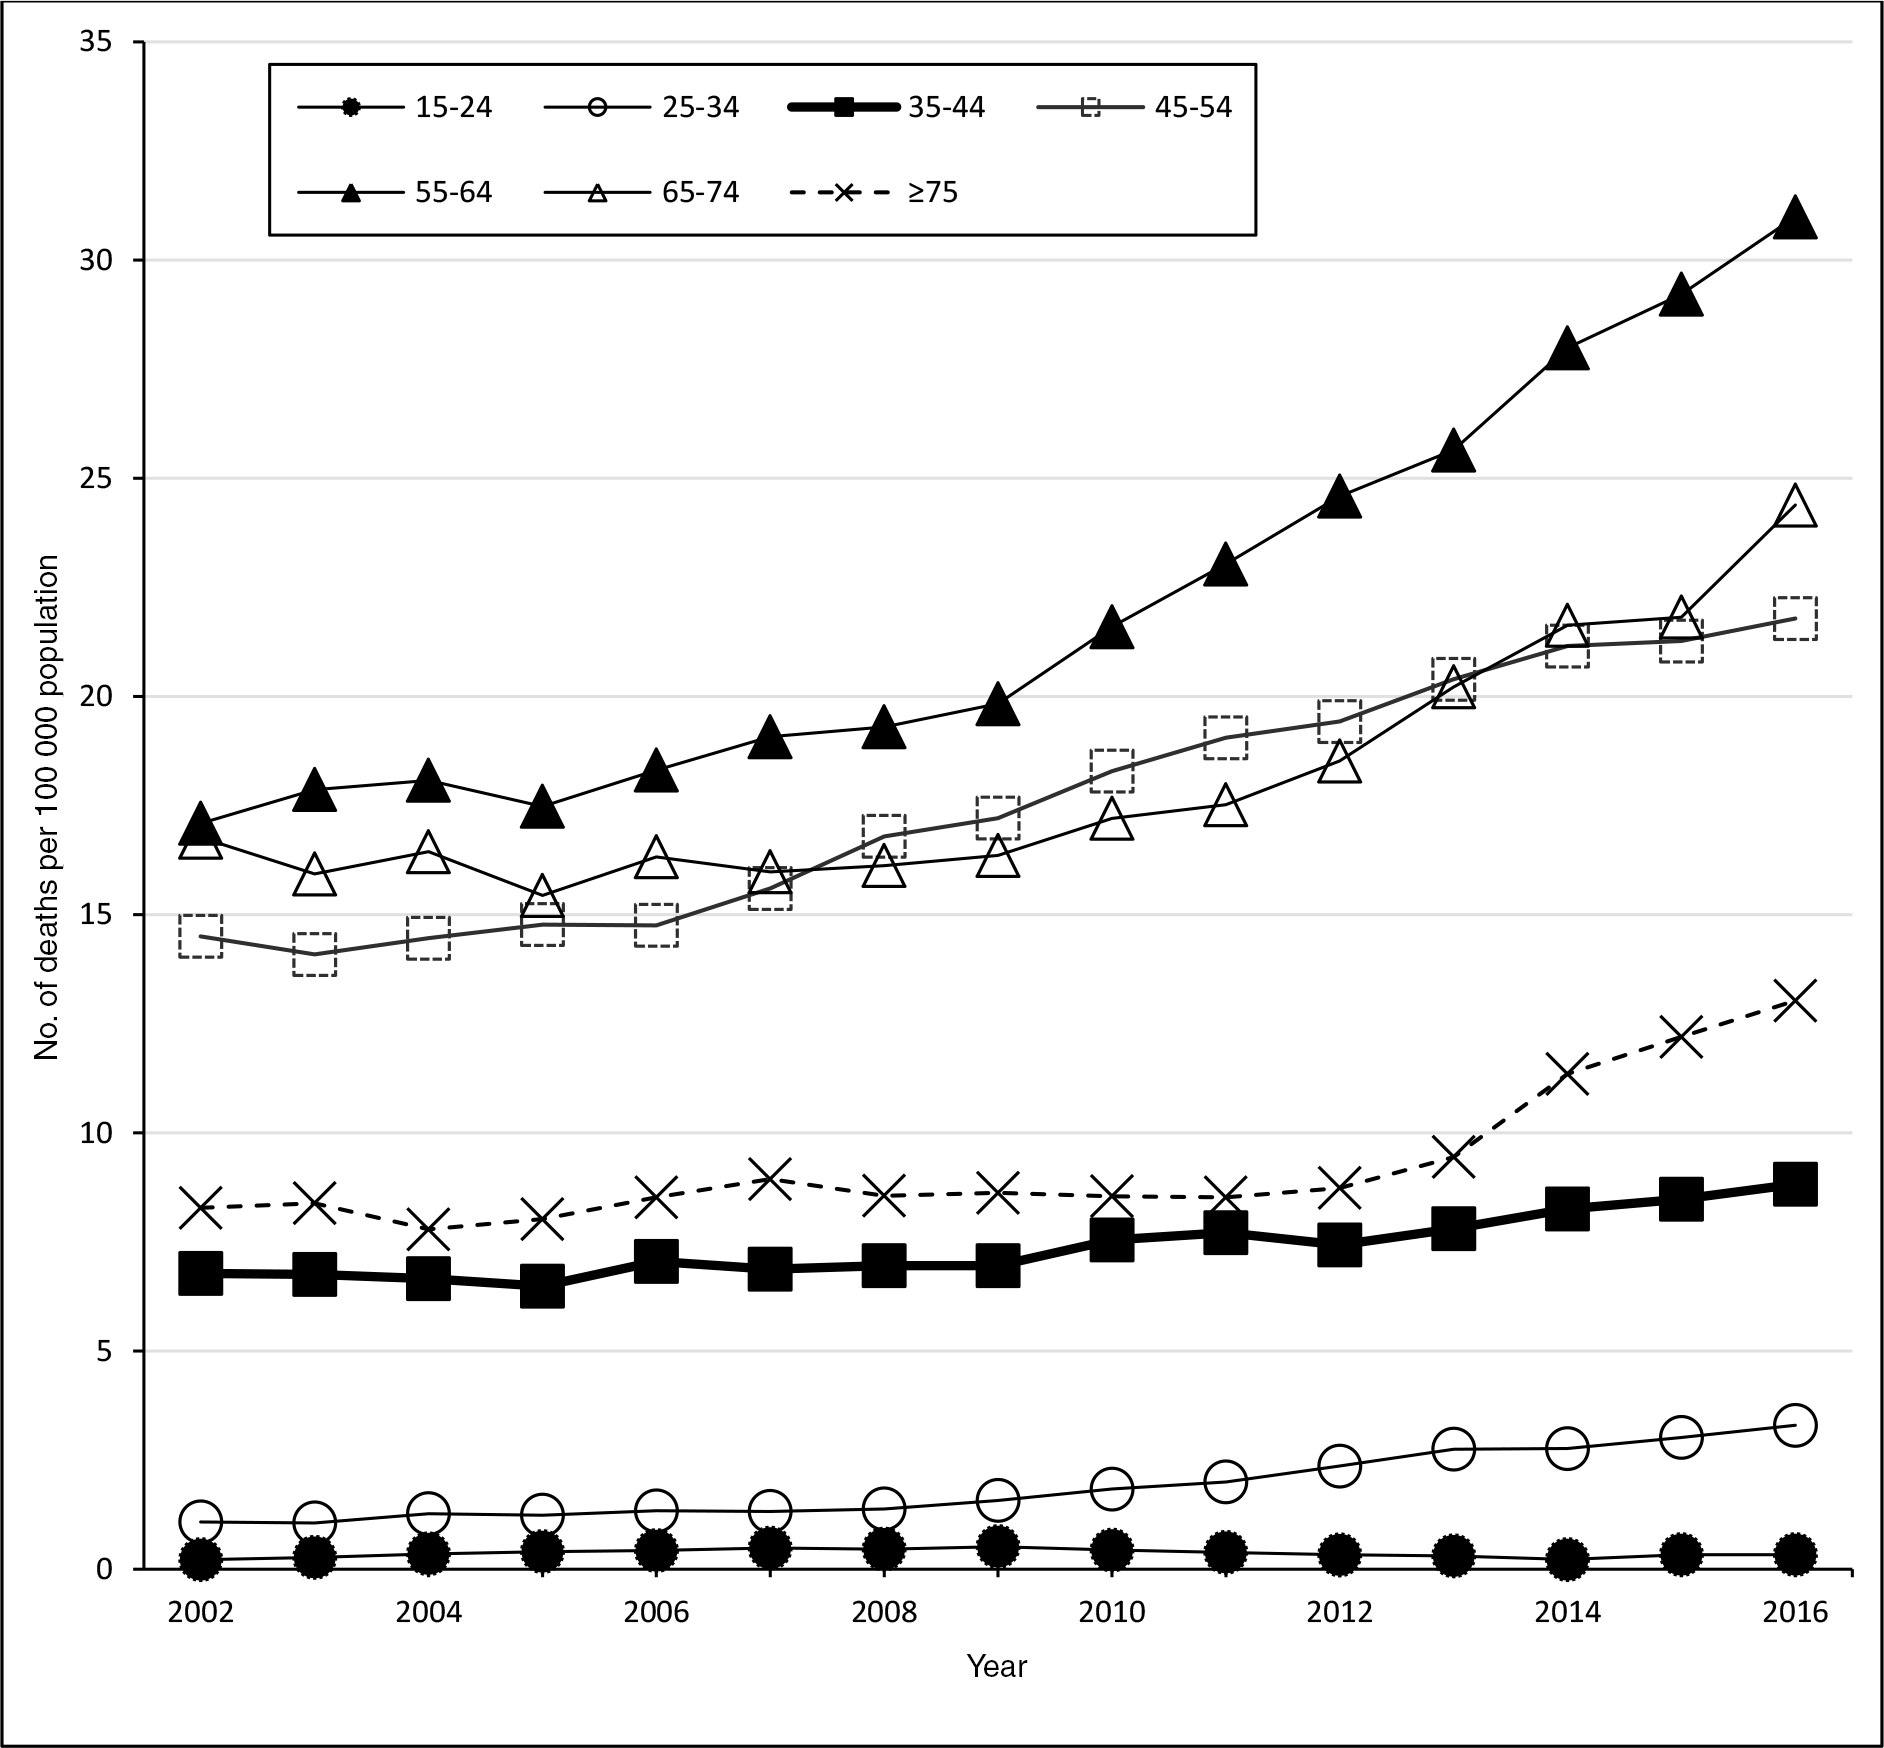
Fully alcohol-attributable mortality rates per 100 000 population in Minnesota, by age and year, 5-year rolling mean. Data source: Minnesota Department of Health.27
Examination of fully alcohol-attributable mortality rates in the 7-county metropolitan and Greater Minnesota geographic areas revealed subtle differences. The fully alcohol-attributable mortality rate per 100 000 population increased from 8.5 during 2000-2004 to 12.4 during 2014-2018 (a 45.9% increase) in the 7-county metropolitan area and increased from 6.7 to 12.7 (an 89.5% increase) in Greater Minnesota (Figure 5).
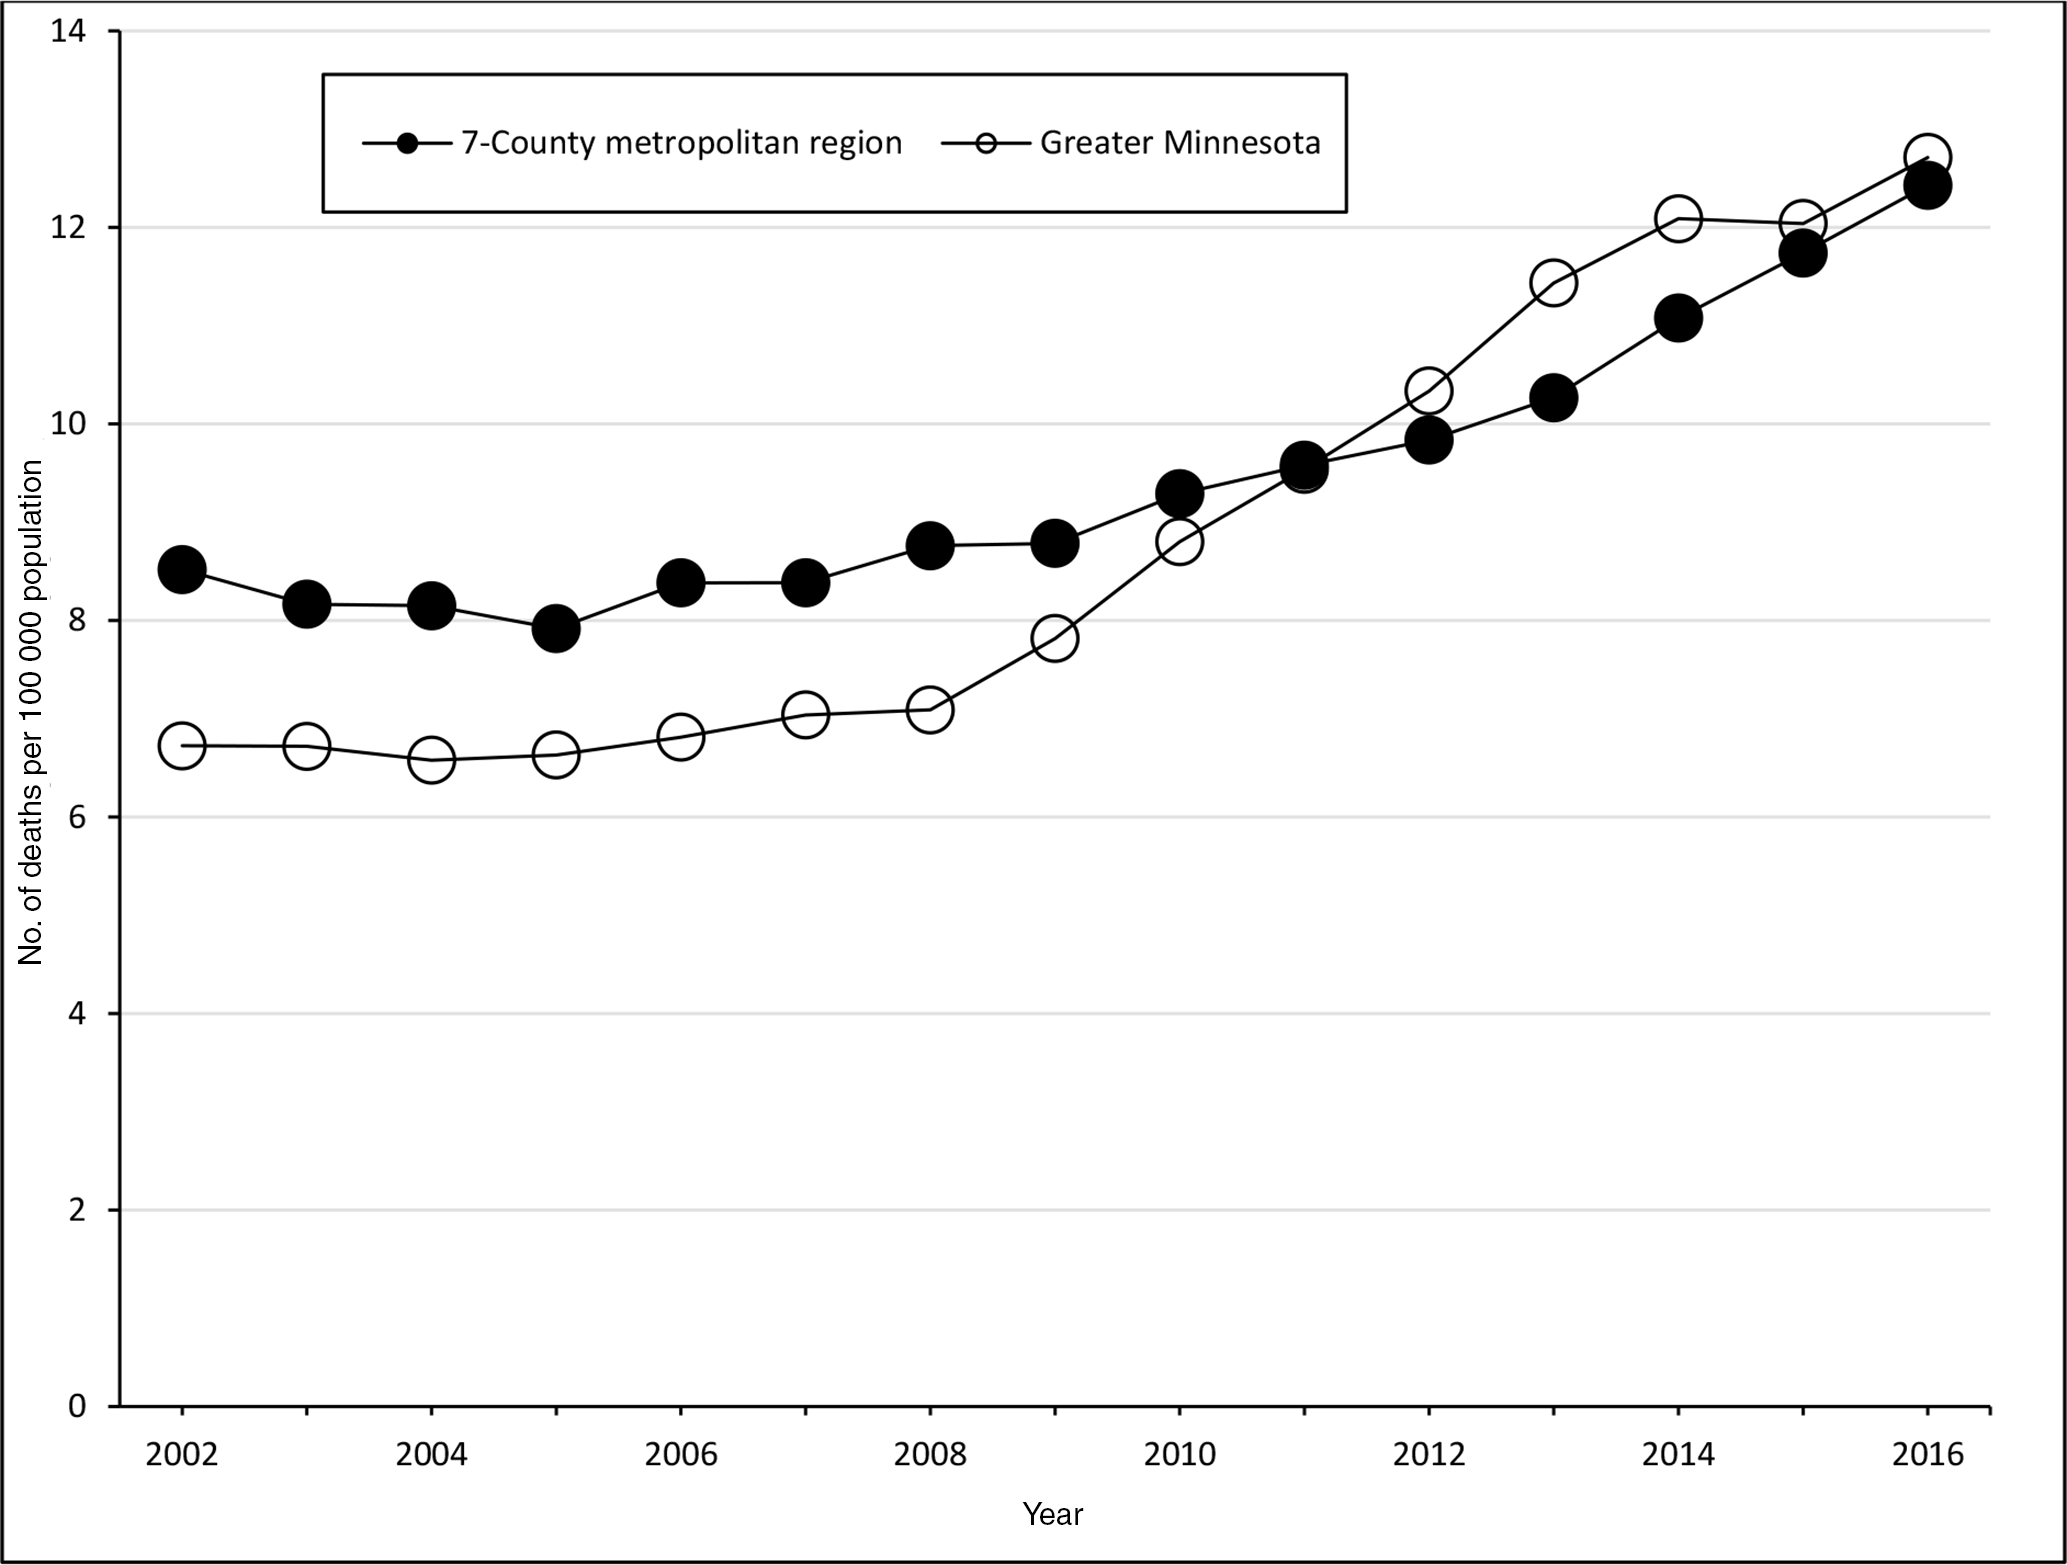
Fully alcohol-attributable age-adjusted mortality rates per 100 000 population in Minnesota, by county type and year, 5-year rolling means. The 7-county metropolitan region includes the 7 counties surrounding Minneapolis–St Paul (Anoka, Carver, Dakota, Hennepin, Ramsey, Scott, and Washington); Greater Minnesota refers to the remaining 80 counties, which tend to be rural. Data source: Minnesota Department of Health.27
Discussion
This study used death certificate records to describe fully alcohol-attributable mortality trends in Minnesota during 2000-2018. Overall, the findings show a 58% increase in mortality rates from fully alcohol-attributable conditions in Minnesota in 2014-2018 compared with 2000-2004 and several disparities in demographic characteristics. Chronic alcohol-attributable deaths accounted for most (89.1% during 2014-2018) of the fully alcohol-attributable deaths and the increasing alcohol-attributable mortality rate. Similar studies at the national level have also concluded that fully alcohol-attributable mortality rates in the United States increased, particularly after 2011. 20,21,27
Consistent with national findings, males in Minnesota had higher fully alcohol-attributable mortality rates than females in Minnesota. 20,21 However, fully alcohol-attributable mortality rates among both sexes increased substantially during 2000-2018 (a 43.6% increase in 5-year moving averages among males and a 93.1% increase among females). The larger increase in fully alcohol-attributable mortality among females may be the result of changing alcohol use behaviors among females, including greater rates of drinking, binge drinking, and AUD than previously reported by females. 10,28,29
According to the US Census, the racial and ethnic composition in Minnesota became more diverse during the study period. 30 We found substantial disparities in fully alcohol-attributable mortality rates by race and ethnicity. Although fully alcohol-attributable death rates increased among all racial and ethnic groups during the study period, the largest increase occurred among the AI/AN population. During 2014-2018, the fully alcohol-attributable mortality rate among AI/AN people was more than 5 times higher than the rate for Minnesota as a whole, and the disparity was also higher than mortality rates observed nationally in similar studies. 25 In addition, since 2009, fully alcohol-attributable mortality rates among AI/AN people increased substantially, whereas mortality rates increased more modestly among all other racial and ethnic groups. This finding is especially troubling, because AI/AN mortality rates are frequently underestimated as a result of racial misclassification upon death. 31 It is important to consider this disparity within the context of persisting health inequities, including socioeconomic conditions and historical trauma related to frontier colonialism throughout American history. These inequities, along with many other factors, contribute to observed health disparities. These traumas have manifested into several risk factors, including poverty, family history of AUD, and availability of alcohol to adolescents in the community. 32,33 Despite the large difference between fully alcohol-attributable mortality rates among AI/AN people and White people, other studies have shown that AI/AN people consume excessive alcohol at rates comparable to White people. 33 -35 Another study found that AI/AN adults reported a prevalence of binge drinking at a similar rate to White adults; however, AI/AN adults who reported binge drinking reported significantly more binge drinking occasions per month and more drinks per binge drinking occasion. 35 In addition, AI/AN populations often live in areas with limited access to health care 36 because of underfunding of the Indian Health Service and mental health/substance abuse treatment services. 37,38 This limited access may be associated with delays in diagnoses for alcohol-related conditions, which could contribute to delays in receiving appropriate care or treatment and, thus, increase the likelihood of adverse outcomes. Engaging culturally trained specialists and community workers to reach communities of color and diverse populations is critical to addressing this disparity.
At the beginning of the study period, the fully alcohol-attributable mortality rates were higher in the 7-county metropolitan area than in more rural Greater Minnesota. However, counties in Greater Minnesota had a larger increase in the fully alcohol-attributable mortality rate from 2000 to 2018; as such, by the end of the study period, the rates were much closer. This finding is similar to findings from national studies, which have shown that although excessive drinking behaviors between rural and urban areas are similar, fully alcohol-attributable mortality rates are higher and are increasing more quickly in rural regions, especially with regard to CLD. 39 -41 This increase in rates of CLD may be the result of lack of access to specialty care providers in rural areas, without which evidence suggests recommended care is less likely to be received. 42
Rising all-cause mortality documented among middle-aged adults in the United States in the 21st century has been largely attributed to so-called “deaths of despair” (typically referring to suicide, drug overdose, and CLD), also referred to as “preventable deaths of substance use and suicide.” 25,27,43 The increased rates of fully alcohol-attributable mortality among adults aged 34-45 observed in our study indicate premature mortality, which is in line with national and global studies that found increasing trends in CLD and other chronic alcohol-attributable deaths. 25,41,44 Furthermore, CLD accounts for most fully alcohol-attributable deaths in Minnesota, and its share of deaths is increasing. Similar to other studies, we found low rates of fully alcohol-attributable mortality among adolescents and young adults. 20,21 This finding can be explained, in part, because young people are less likely than older adults to have been excessively drinking for a long enough time to lead to deaths from chronic alcohol-attributable conditions.
The Community Preventive Services Task Force recommends a number of evidence-based interventions to prevent excessive alcohol consumption and its consequences. 45 Interventions with strong evidence on the effectiveness of decreasing excessive alcohol consumption include increasing alcohol taxes, strengthening dram shop liability, maintaining limits on days of sale, regulating alcohol outlet density, limiting hours of alcohol sales, enhancing enforcement of laws prohibiting sales of alcohol to minors, and implementing electronic screening for excessive alcohol use and brief intervention (which can be administered by health care providers, universities, or communities). Ultimately, coordination among businesses, communities, local public health, and state-level agencies is necessary to enact and enforce the evidence-based interventions suggested by the Community Preventive Services Task Force to decrease excess alcohol use and alcohol-attributable mortality.
Limitations
This study had several limitations. First, we defined fully alcohol-attributable deaths as those with an ICD-10 code that is fully attributable to alcohol as the underlying cause of death. We did not include Minnesota death records that had alcohol-related causes of death listed as a contributing cause of death. Therefore, we did not include deaths associated with alcohol use but not fully attributable to alcohol (eg, some forms of cancer, cardiovascular disease, and unintentional injuries including falls and traffic crashes) in our analysis. Second, it is also possible that decisions made by medical examiners, coroners, or physicians during a death investigation could have biased the records included in our study. Demographic misclassifications may have occurred during the death investigation process, especially for AI/AN decedents. 31 Studies have found that using underlying cause-of-death records (as opposed to multiple cause-of-death records) may underestimate the number of deaths resulting from excessive alcohol use 46 ; however, we chose this method as a more conservative approach to ensure that the deaths included were attributable to alcohol. Third, our estimates were conservative: because of reporting changes, our study included only deaths of Minnesota residents that occurred in the state of Minnesota for the 2017 and 2018 data years; we did not include Minnesota residents who died outside the state for these years. This limitation may have affected the findings that compared mortality rates of Greater Minnesota and the 7-county metropolitan area, because Minnesotans living in rural areas near a larger border city (eg, Sioux Falls, South Dakota; Fargo, North Dakota; Grand Forks, North Dakota) are likely to be transported or seek medical care across state lines. Therefore, the Greater Minnesota mortality rate estimate may have been disproportionately affected by these missing data among Minnesota residents who died outside the state during 2017-2018. Fourth, the results by geographic region in Minnesota (7-county metropolitan vs Greater Minnesota) cannot be interpreted as strictly urban versus rural because some areas of Greater Minnesota are increasingly urban. Finally, because the study period began in 2000, and the death classification system changed from ICD-9 to ICD-10 in 1999, the death classifications in the early years of the study may have been skewed as a result of the change. 47
Conclusions
This study shows that fully alcohol-attributable mortality rates increased in Minnesota from 2000 to 2018, with chronic alcohol-attributable causes counting for most deaths. Although alcohol-attributable mortality rates among males were higher than among females, the rate increase during the study period was greater among females. AI/AN populations in Minnesota had disproportionately high alcohol-attributable mortality rates and increases in mortality during the study period. This study can increase awareness of the growing rates of alcohol-attributable mortality in Minnesota, especially among AI/AN people, and guide the development of culturally competent interventions aimed at addressing this public health concern.
Footnotes
Declaration of Conflicting Interests
The authors declared no potential conflicts of interest with respect to the research, authorship, and/or publication of this article.
Funding
The authors disclosed receipt of the following financial support for the research, authorship, and/or publication of this article: This article was supported by the Centers for Disease Control and Prevention (CDC) of the US Department of Health and Human Services (HHS) as part of a financial assistance award totaling $150 000, with 100% funded by CDC/HHS. The contents of this article are those of the authors and do not necessarily represent the official views of, nor an endorsement, by CDC/HHS or the US government.