
Abstract
Objectives
Influenza infects millions of people each year and contributes to tens of thousands of deaths annually despite the availability of vaccines. People most at risk of influenza complications are disproportionately represented in people incarcerated in US prisons and jails. The objectives of this study were to survey health administrators in Massachusetts county jails about institutional influenza vaccine policies and practices and estimate influenza vaccination rates in Massachusetts jails from 2013 to 2020.
Methods
In April 2020, we administered surveys to the health services administrators in Massachusetts’ 14 county jails to gather information about influenza vaccination policies and delivery practices. To calculate influenza vaccination rates for each facility, we obtained data on influenza vaccine orders from the Massachusetts Department of Public Health for each county in Massachusetts for influenza seasons 2013-2020. We calculated summary statistics for each reporting facility and each year, conducted a Kruskal–Wallis analysis to compare vaccination rates between years, and used a linear regression model to identify predictors of vaccination rates.
Results
Influenza vaccination rates in Massachusetts jails ranged from 1.9% to 11.8%. We found no significant differences in vaccination rates between years. Influenza vaccine ordering and delivery practices varied by jail, and respondents had high levels of confidence in influenza policies and vaccine delivery practices.
Conclusions
Influenza vaccination rates in Massachusetts jails are low, and delivery practices in jails vary. Lack of influenza vaccinations in jails is a gap in health care that needs to be prioritized, especially considering the current COVID-19 pandemic. Further investigations for effective and equitable vaccination in this population should involve people who are incarcerated and people who make influenza vaccine policies in jails.
Despite the availability of an effective vaccine, influenza was associated with an estimated 38 million illnesses and 22 000 deaths in the United States during the 2019-2020 influenza season. 1 Severe influenza outcomes occur more often among people with underlying medical conditions than among people without those conditions and more often in poor communities, which face barriers to accessing preventive health care services, such as vaccinations, than among wealthier communities. 2,3 Carceral settings such as jails and prisons can serve as epicenters of respiratory infection outbreaks, and people who are incarcerated have a higher prevalence of infectious diseases, chronic illnesses, substance use disorders, and mental illness than their peers in the community. 4 -6 The COVID-19 pandemic has heightened awareness of modifiable factors that can prevent transmission of infectious diseases in carceral settings, and efforts to increase decarceration have decreased overcrowding and may help reduce COVID-19 transmission in carceral settings. 7,8
The desire to evaluate and improve influenza vaccination policies, especially in jails, is gaining momentum in the United States. The churn of people in and out of jails, with an average length of stay of 25 days and frequently fewer than 24 hours, contributes to the challenge of addressing the health needs of this population and to the risk of virus transmission from the community into the jails and back into the community. 9 -11 Publicly available research is sparse on influenza prevention and mitigation in carceral settings, and the available data indicate room for improvement. During the 2009-2010 H1N1 influenza pandemic, only 71% of federal prisons, 55% of state prisons, and 28% of jails received any vaccines. 12,13 During the 2009-2010 influenza season, smaller jails were less likely than larger facilities to receive influenza vaccines and have pandemic preparedness plans in place. 12,13 A systematic review of several vaccination types in prisons found seasonal influenza vaccination rates ranging from 36% to 70%, although none of the studies in the review included people in jail. 6
Massachusetts state law requires that county correctional facilities provide preventive medical treatment, including immunizations, to people who are incarcerated. 14 Influenza vaccines are provided free of charge to all 14 county jails by the Massachusetts Department of Public Health. Recognizing the need for more data on influenza vaccine delivery practices and policies in jails, our research team conducted a mixed-methods study to (1) survey health administrators in Massachusetts county jails about institutional influenza vaccine policies and practices and (2) estimate influenza vaccination rates in Massachusetts jails from 2013 to 2020.
Methods
Survey Development and Data Collection
Through the development of a concept map, we identified a goal of addressing equitable, acceptable, and sustainable access to immunizations for a seasonal disease of high impact (influenza). The population of interest was health services administrators (HSAs), who oversee medical operations at Massachusetts’ county jails. Thirteen of 14 Massachusetts counties have a jail and an HSA; Suffolk County has 2 jails and 2 HSAs, for a total of 14 HSAs. The survey consisted of 21 questions: 14 multiple-choice questions, 3 questions asking respondents to position a drag bar along a 7-point Likert scale, 1 question asking respondents to identify a graphed trend, and 3 free-text questions. For the purposes of this study, we tabulated results only for questions that related to policy or delivery practices. We piloted the survey with 3 volunteers, incorporated feedback, and distributed the survey on April 9, 2020. Each HSA received a single email, which included the formal informed consent; after reading the consent document and agreeing to participate, respondents clicked the link that led them to the survey. To protect anonymity, the survey did not ask respondents to name the facility where they worked. We received approval from the Tufts University Health Sciences Institutional Review Board for the survey portion of this research.
Influenza Vaccination Rates
We received an exemption from the Tufts University Health Sciences Institutional Review Board for analysis of influenza vaccine data. County jails estimate their total and monthly influenza vaccine needs in the previous year and then request shipments of influenza vaccine as needed throughout the influenza season. Jails store and handle vaccines onsite, and jail staff members are responsible for administering vaccines to people who are incarcerated. We submitted a request to the Massachusetts Department of Public Health for data on the number of influenza vaccines ordered by each facility and the order date. All vaccine orders were filled in full.
Vaccination Rate Calculation
We estimated the vaccination rate for each facility as the number of vaccines ordered (vaccine order size) in the influenza season divided by the total number of people we estimated to pass through the jails during the period of peak influenza activity (influenza season) 15 :
Vaccination rate (%) = (Vaccine order size/Total number of incarcerated people per influenza season) × 100
We used vaccine order size as a proxy for vaccines administered because no data were available on the number of vaccines administered. To estimate the total number of unique people incarcerated per season, we used the average daily population of each jail as reported in quarterly reports by the Massachusetts Department of Correction and the weekly turnover rate by jurisdictional population from the Bureau of Justice Statistics yearly reports on the Annual Survey of Jails. 10,16 Admission and release data for Massachusetts’ jails were not available at the time of our analysis, so we instead relied on the Bureau of Justice Statistics national weekly inmate turnover rates calculated as the sum of the weekly admissions and weekly releases divided by the average daily population. 10 To estimate the number of weekly admissions for each county in our sample, we considered that the average daily population would remain constant through the influenza season. We therefore approximated that the number of weekly admissions and releases were equal. Using the national turnover data, we estimated the total number of weekly admissions in each county and multiplied by the number of weeks in the given season for total seasonal admissions. To account for the fact that a single person may be incarcerated multiple times during an influenza season, we divided an estimated annual reincarceration rate of 30% by 2 (6 months of influenza season) to get an estimated influenza season reincarceration rate of 15%. 17,18 We determined the length of each influenza season in days according to the start and end dates reported by the Centers for Disease Control and Prevention. 19
Statistical Analysis
We used R version 4.0.3 (R Foundation for Statistical Computing) and RStudio version 1.3.1093 (R Foundation for Statistical Computing) to clean, manage, and analyze influenza vaccination data from the Massachusetts Department of Public Health. Because of the small sample of HSAs and the need to maintain anonymity, we did not match the survey data and the influenza vaccine data. We calculated descriptive and summary statistics expressed as range, median, and interquartile range for vaccination rates at jails in each influenza season. Because the distribution of vaccination rates was skewed, we used the Kruskal–Wallis analysis of variance to test for differences between the median vaccination rates in each influenza season.
We built a linear regression model to identify potential factors associated with increased vaccination rates. We posited that jail size, grouped into small (average daily population, <500), medium (average daily population, 500-999), and large (average daily population, ≥1000), would represent various administrative capacities and, thus, would be related to the ability to vaccinate people who were incarcerated. The model also included the percentage capacity of the facility (the ratio of the average daily population of the facility to its designed capacity listed by the Massachusetts Department of Correction) as an indicator of crowding and the length of the influenza season. 16 We ran the model both including and not including county to adjust for county-level factors that may not otherwise be captured in our limited analysis. We then did an F test to evaluate the contribution of the county to the overall regression model.
Results
Survey of HSAs
Eleven of 14 HSAs responded to the survey. All respondents stated that their facilities offered the influenza vaccine to people who were pretrial, sentenced, or prerelease. When asked whether they offered influenza vaccines to people in US Immigration and Customs Enforcement (ICE) custody, 4 respondents said yes, 1 respondent said no, and 6 respondents did not respond to the question. No respondents noted a delay or barrier in acquiring influenza vaccine. We found differences among jails in policies and practices (Table 1). Only 7 of 11 respondents had personally received the influenza vaccine. Overall, the HSAs sampled were somewhat worried about an influenza outbreak at their jail and were very satisfied with the way that influenza vaccines were provided at their jails. Respondents were not worried about getting influenza from someone who was incarcerated.
Influenza vaccination policies and delivery practices reported by the health services administrators at Massachusetts jails who responded to a survey (N = 11), April 2019 a
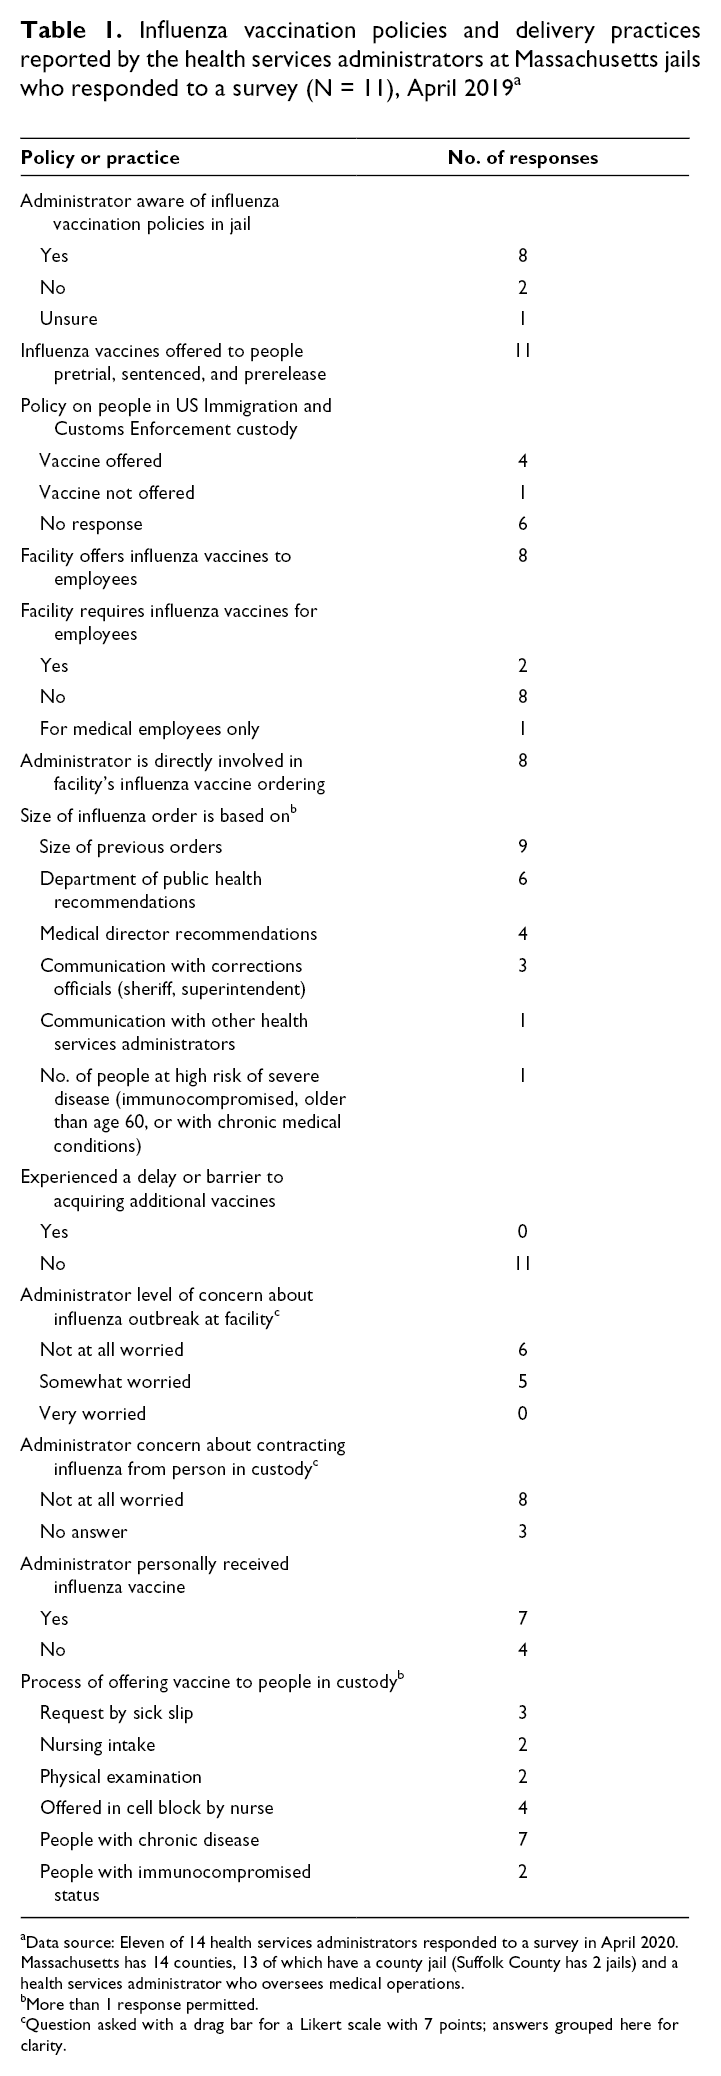
aData source: Eleven of 14 health services administrators responded to a survey in April 2020. Massachusetts has 14 counties, 13 of which have a county jail (Suffolk County has 2 jails) and a health services administrator who oversees medical operations.
bMore than 1 response permitted.
cQuestion asked with a drag bar for a Likert scale with 7 points; answers grouped here for clarity.
The free-text responses indicated satisfaction with influenza vaccination policies and practices. One participant wrote, “The flu process in our department is a smooth process with little to no complaints on an annual basis.” Another wrote there were “many opportunities to receive a flu vaccine while with us.” Another participant identified the challenges involved in administering influenza vaccinations, citing lack of education and people “simply not listening,” and went on to write the following:
[A] lot of the population refuses the flu vaccine stating reasons such as “I need to know what goes in my body,” “That vaccine was made by the government to track/control us.” . . . It is frustrating as a health care provider to ensure their health and safety when they are not open to the education in the first place. Even after an inmate gets the flu, they will still refuse a flu vaccine during the next flu season.
Influenza Vaccination Rates
Influenza vaccination rates ranged from 1.9% to 11.8%; the median vaccination rate each season ranged from 4.9% in both 2016-2017 and 2019-2020 to 6.0% in 2013-2014 (Figure 1). A Kruskal–Wallis test indicated no significant difference in the median influenza vaccination rate of influenza seasons 2013-2014 and each following season up to 2019-2020. Influenza vaccination rates varied among counties; the rates in some counties were almost twice as high as the median rate (Figure 2). When we adjusted for county, the jail size, influenza season length, and percentage capacity were not associated with influenza vaccination rate (Table 2).
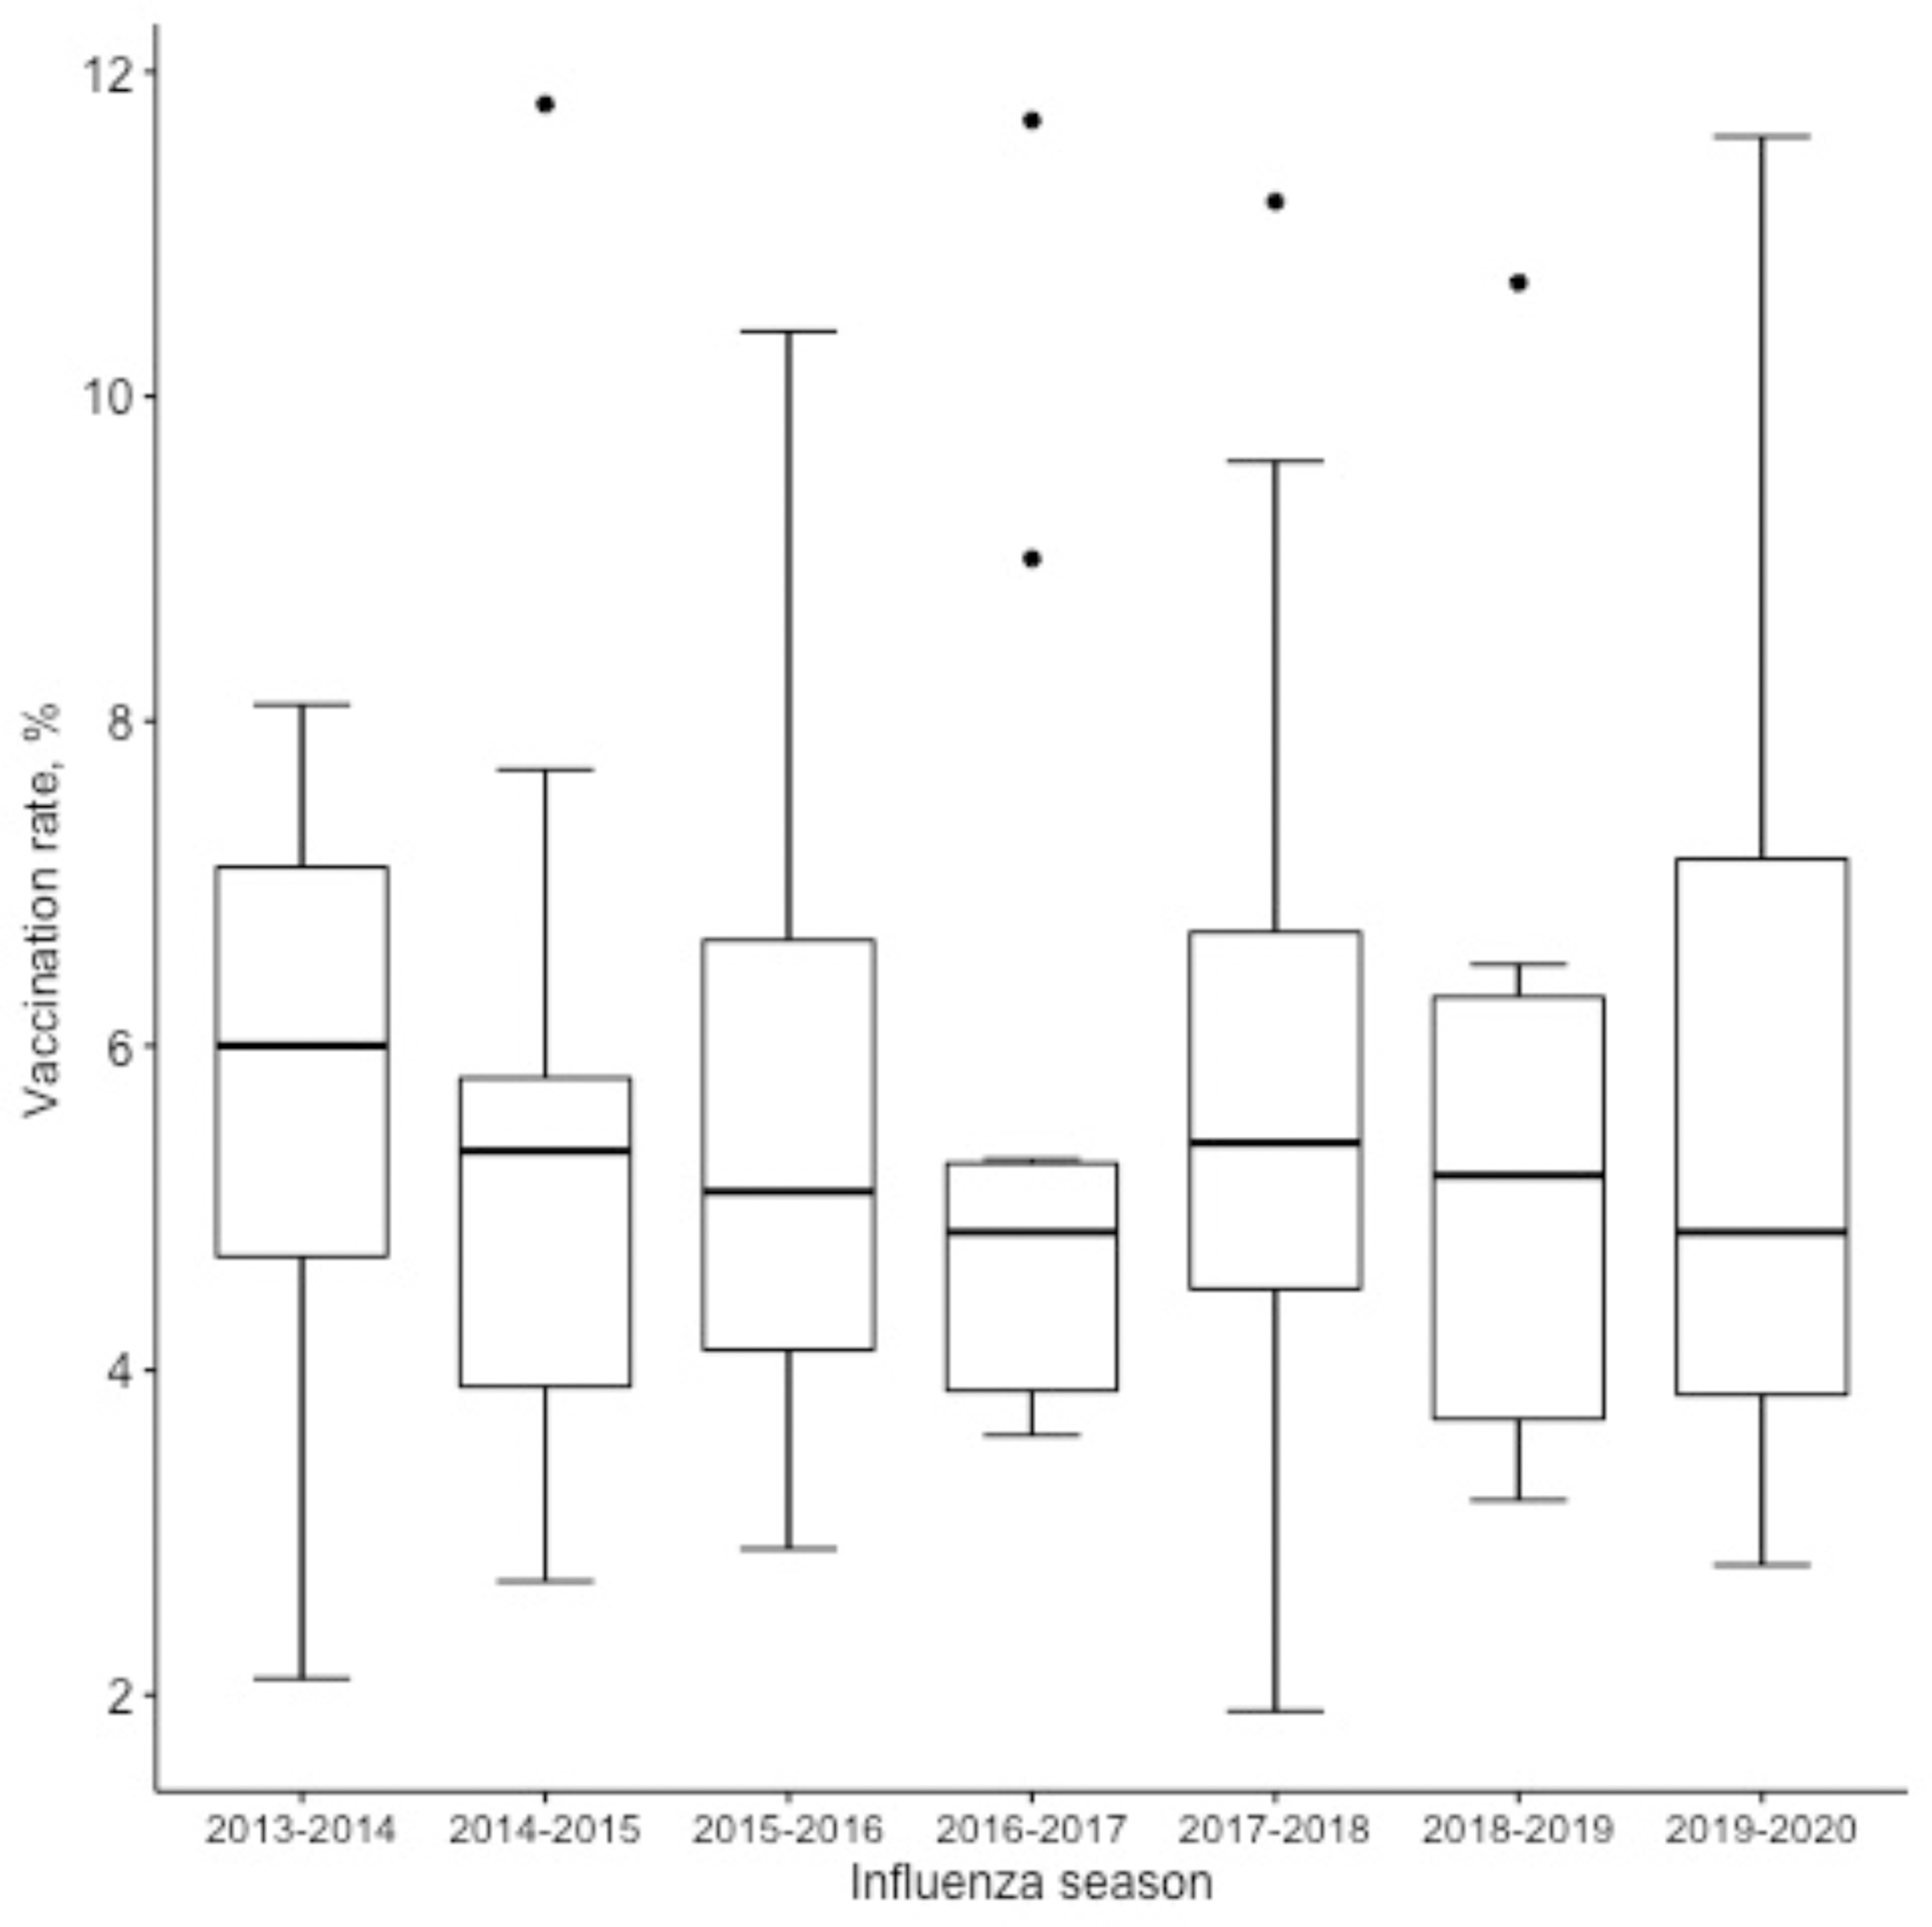
Influenza vaccination rates in Massachusetts jails by influenza season, 2013-2020. The horizontal line in the middle of each box indicates the median; the top and bottom borders of the box mark the 75th and 25th percentiles, respectively. The whiskers above and below the box mark the 90th and 10th percentiles, respectively. The points beyond the whiskers are outliers beyond the 90th percentile. Kruskal–Wallis χ2 = 1.28 (df = 6; P = .97). Vaccination rates calculated using influenza vaccine ordering information from the Massachusetts Department of Public Health for Massachusetts county jails.
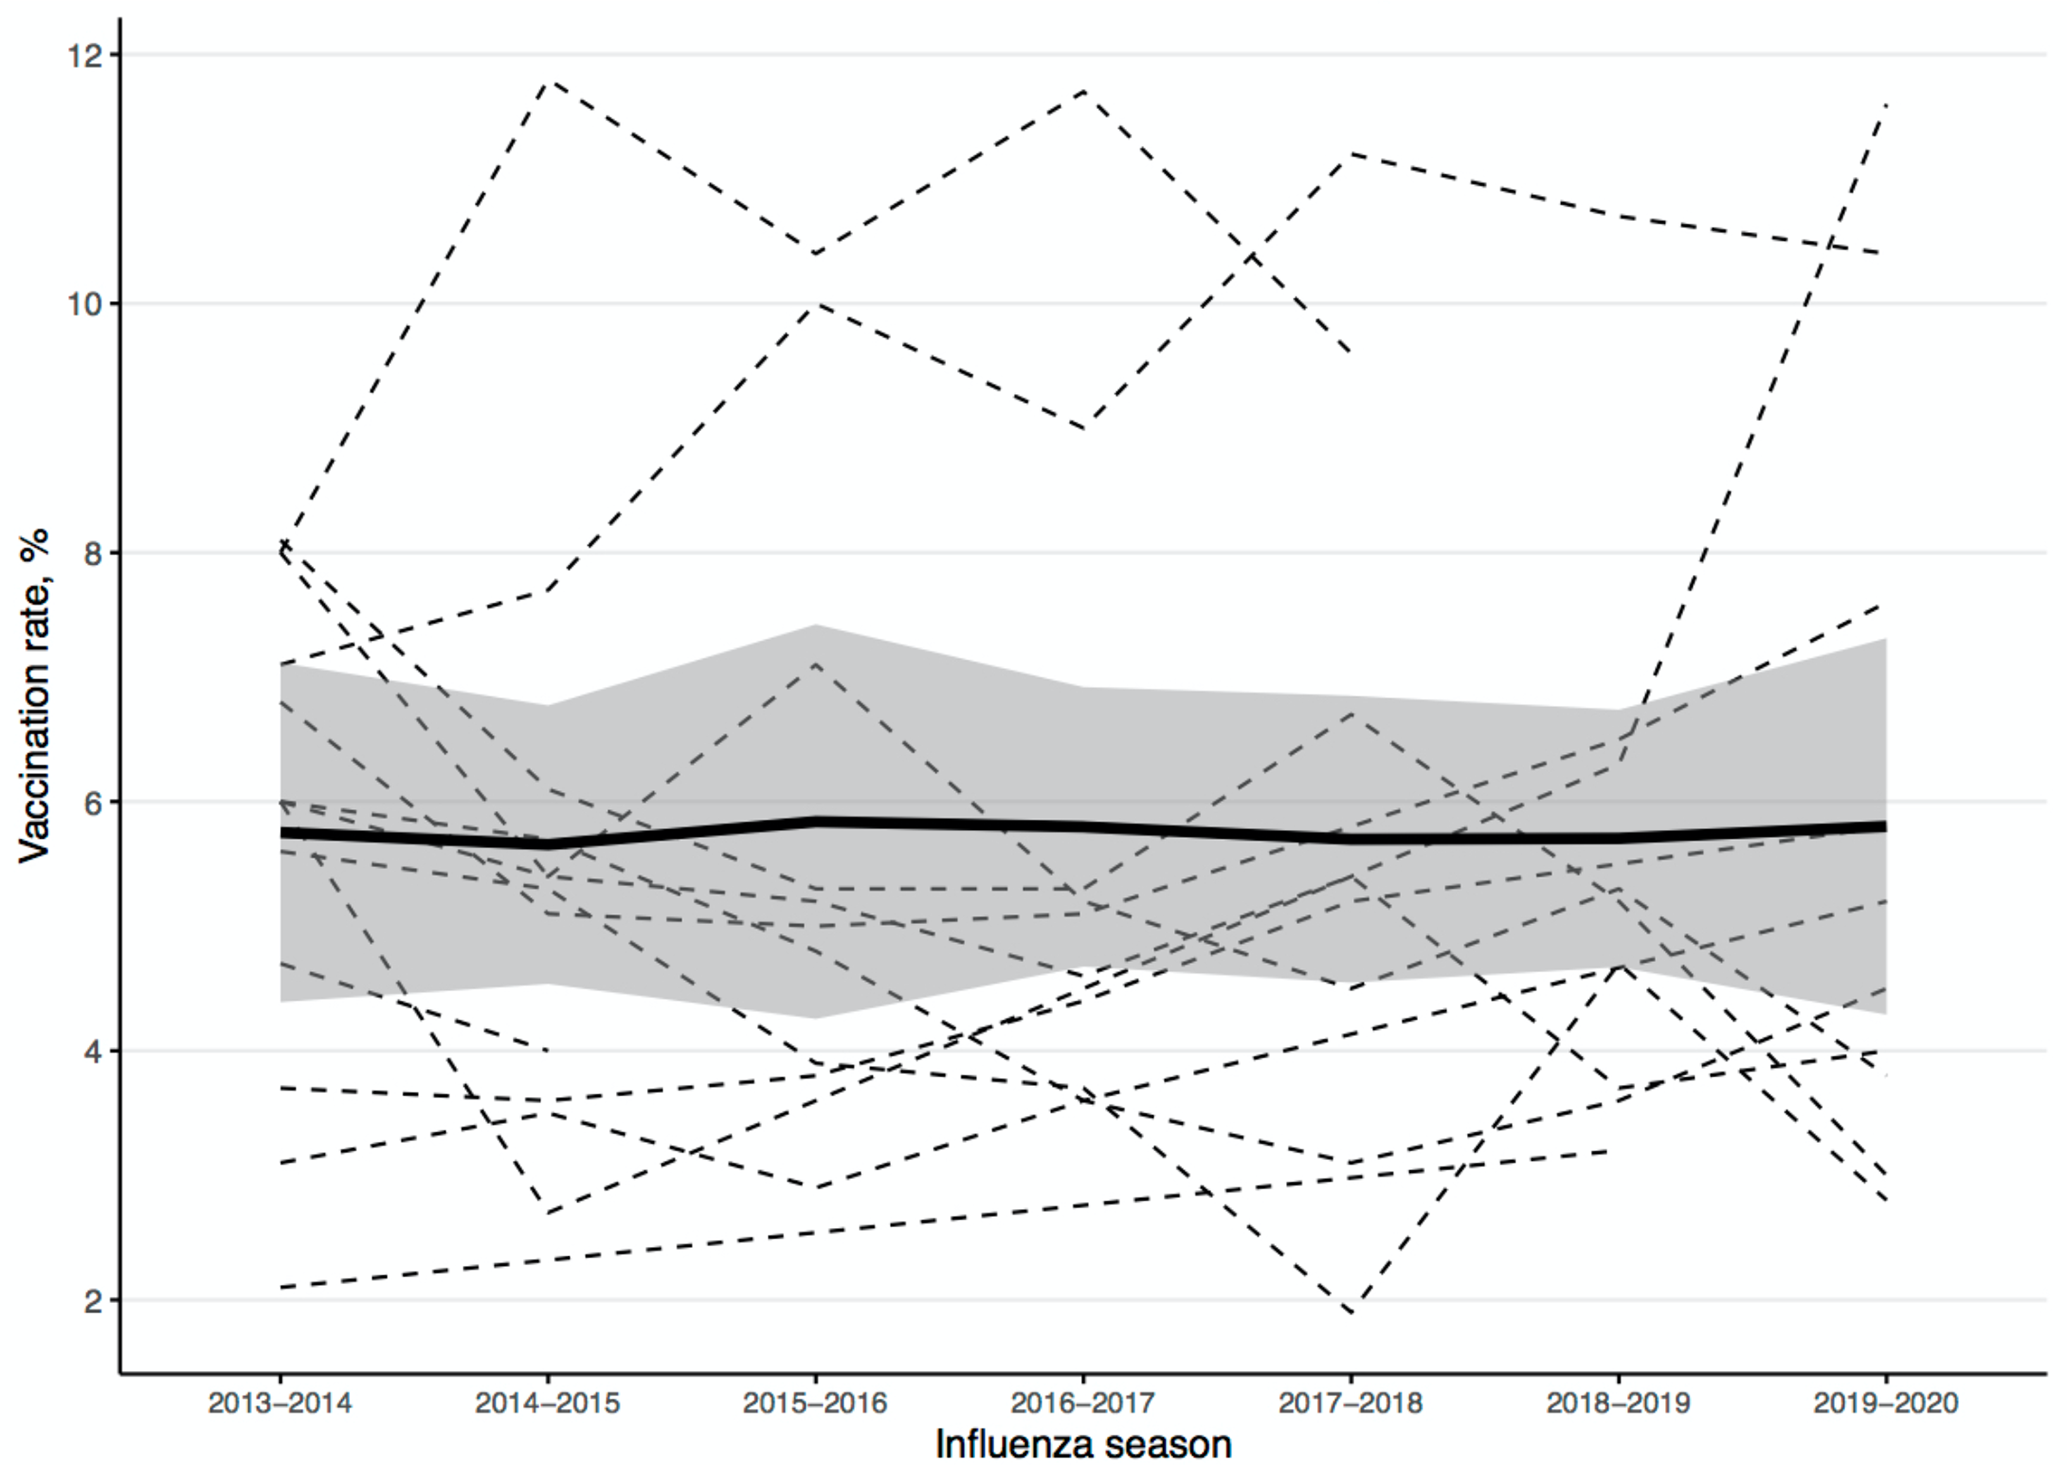
Seasonal influenza vaccination rates in Massachusetts jails by facility, 2013-2020. Each dashed line represents a jail, the thick black line represents locally estimated scatterplot smoothing, and the shadow represents SE. Data were not available for all jails in all years during the study period. Vaccination rates calculated by using influenza vaccine ordering information from the Massachusetts Department of Public Health for Massachusetts county jails.
Linear regression model with and without adjustment for county to identify potential factors associated with increased influenza vaccination rates in Massachusetts county jails, 2013-2020 a
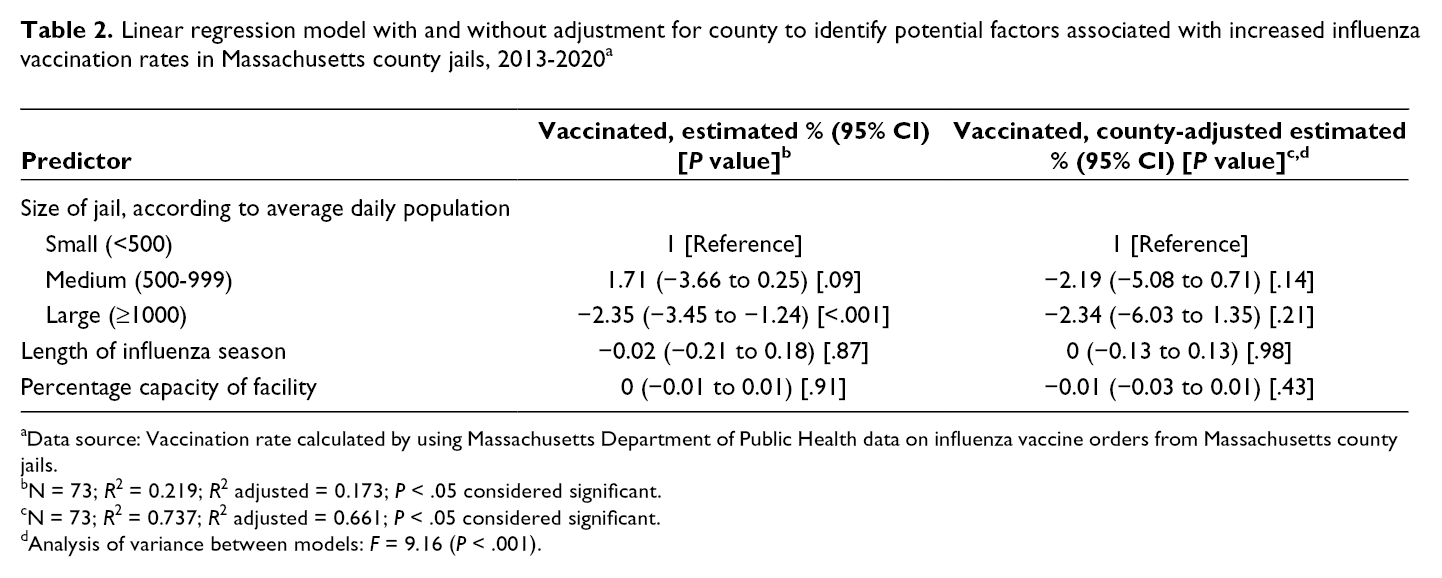
aData source: Vaccination rate calculated by using Massachusetts Department of Public Health data on influenza vaccine orders from Massachusetts county jails.
bN = 73; R 2 = 0.219; R 2 adjusted = 0.173; P < .05 considered significant.
cN = 73; R 2 = 0.737; R 2 adjusted = 0.661; P < .05 considered significant.
dAnalysis of variance between models: F = 9.16 (P < .001).
Discussion
Our analysis estimated that fewer than 10% of people who were incarcerated in Massachusetts jails were vaccinated in each influenza season from 2013-2014 through 2019-2020. We found differences in vaccination rates among the jails, but these differences were not explained by jail size. Survey responses from the HSAs showed overall satisfaction with current influenza protocols but a lack of a universal approach to influenza vaccination across the jail system in Massachusetts. Collectively, our data demonstrate the need for more attention toward increasing influenza vaccination rates for people who are incarcerated in jails.
The robust response for the prevention and mitigation of tuberculosis infections in US jails (screening and isolation protocols) have so effectively reduced transmission of this disease that only 10 cases of tuberculosis were reported in Massachusetts correctional facilities from 2015 to 2020. 20 -24 Other mitigation strategies, including quarantining affected housing units, separating known exposures, distributing personal protective equipment, and screening for symptoms, were implemented during the H1N1 influenza outbreak and the COVID-19 pandemic, although these efforts have yielded less success than the efforts made toward preventing tuberculosis. 7,8,13,25,26 The low rate of influenza vaccination in our study demonstrates a meaningful gap in infectious disease and preventive health care in jails—but this gap can be filled. COVID-19 has highlighted the vulnerability of people who are incarcerated and demonstrated the marked racial and socioeconomic inequities in health outcomes. 7,8,13,27,28 As a result of COVID-19, awareness has increased about how jails and prisons must play a role in public health. This increased awareness and the clear need for action are pushing jail administrators, correctional staff members, health care providers, and credentialing agencies to prioritize improving vaccine coverage among people who are incarcerated. The ongoing distribution of COVID-19 vaccines has also highlighted the need to establish accurate vaccine administration records. Although statewide vaccine administration records were not regularly used for influenza vaccination in jails during the study period, jails are now required to record and report COVID-19 vaccine administration. This process should be replicated with influenza vaccines and other vaccines that are delivered in carceral settings.
Further investigation and immediate efforts at shifting policies, education, and behaviors are also essential for the delivery of a COVID-19 vaccine in addition to improving influenza vaccine coverage in jails and prisons. In Massachusetts, the overall influenza vaccination rate during the 2019-2020 influenza season among adults was 56.8%, one of the highest adult influenza vaccination rates in the United States. 29 Among our survey respondents, all of whom were HSAs, 36% had not received their influenza vaccine. Influenza vaccination rates in the community are suboptimal for several reasons, including low perceived risk of infection and fear of getting sick from the influenza vaccine. 28,30,31 Influenza vaccination rates, vaccine hesitancy, and reasons for nonvaccination differ markedly by race and socioeconomic status. 30 -33 Widespread influenza vaccine hesitancy in the United States has similarly been reflected in COVID-19 vaccine hesitancy among communities of color and among correctional staff members and people who were incarcerated during initial vaccination efforts. 34,35 One recent study in a single Massachusetts jail found that 40% of people who were incarcerated and 80% of jail staff members would be willing to accept a COVID-19 vaccine, and people who were incarcerated and identified as Black were half as likely as their White peers to indicate willingness to accept a COVID-19 vaccine. 36 Given the long, terrible history of systemic racism in health care and in carceral settings in addition to decades of unethical experimentation among people of color and among people who are incarcerated, particular attention to racial disparities is required in further investigations and interventions in carceral settings. 27,28,35 -40
It is also worth noting that 55% of HSAs did not respond to the question of whether influenza vaccinations are offered to ICE detainees. The absence of a response could either be a result of being unsure about an answer or feeling uncomfortable with answering this question. Access to influenza vaccination in this population is of particular importance given reports of death in ICE detention centers and the increased incidence of COVID-19 in detention centers compared with the general community. 41,42
Limitations
Our study had several limitations. First, the primary limitations were the inability to definitively link a vaccine to an incarcerated person and the inability to determine the exact number of people eligible for influenza vaccination. These gaps highlight systemic deficiencies in linking health care and health-related data between community and carceral settings. In the absence of a better alternative, our calculations were based on the expectation that all ordered influenza vaccines were delivered. However, some vaccines may have been ordered and never given, which, in turn, would falsely inflate our estimated vaccination rates. Second, because previous influenza vaccination is not ascertained at admission to jail, we prespecified that all people admitted to jail needed vaccination, given that estimates of vaccination rates in hard-to-reach populations, including people experiencing homelessness and mental illness, vary greatly and tend to be low. 43,44 Third, we could not identify a complete data source reflecting unique admissions or overall admissions to each Massachusetts jail, so we relied on national datasets. In addition, although we factored in incarceration of the same person more than once during a given influenza season, the few existing estimates of reincarceration rates for jails vary greatly. Furthermore, the small number of counties in Massachusetts, the small population of residents overall, and its small incarcerated population, compared with other states, limit the generalizability of our data. Finally, we did not link survey data and influenza vaccination rates and, thus, were unable to assess whether certain influenza vaccination policies or practices were associated with superior or inferior vaccination rates.
Conclusion
To our knowledge, our study is the first assessment of seasonal influenza vaccination policies and influenza vaccination rates in a jail setting. We found low rates of influenza vaccination in Massachusetts jails. Further investigation is needed to assess the content of influenza-related policies and the logistics of vaccine administration in each jail and why these policies have been unsuccessful in achieving high vaccination coverage. It is also necessary to engage the perspective of people who are incarcerated to evaluate barriers to increased vaccine uptake. We also highlighted the need to build data sources to reflect the true vaccination rates in jails and to improve health-related data communication between the community and carceral settings. As we continue with the distribution of COVID-19 vaccines, addressing vaccine delivery mechanisms in jails will be critical to protecting this vulnerable population and the surrounding communities.
Footnotes
Acknowledgments
The authors thank the Massachusetts Department of Public Health for its partnership and support.
Declaration of Conflicting Interests
The authors declared no potential conflicts of interest with respect to the research, authorship, and/or publication of this article.
Funding
The authors disclosed receipt of the following financial support for the research, authorship, and/or publication of this article: This project was supported by grant numbers 1KL2TR002545-01 and K08HS026008-01A from the National Institutes of Health.