
Abstract
Objective
COVID-19 mortality varies across demographic groups at the national level, but little is known about potential differences in COVID-19 mortality across states. The objective of this study was to estimate the number of all-cause excess deaths associated with COVID-19 in Florida and Ohio overall and by sex, age, and race.
Methods
We calculated the number of weekly and cumulative excess deaths among adults aged ≥20 from March 15 through December 5, 2020, in Florida and Ohio as the observed number of deaths less the expected number of deaths, adjusted for population, secular trends, and seasonality. We based our estimates on death certificate data from the previous 10 years.
Results
The results were based on ratios of observed-to-expected deaths. The ratios were 1.17 (95% prediction interval, 1.14-1.21) in Florida and 1.15 (95% prediction interval, 1.11-1.19) in Ohio. Although the largest number of excess deaths occurred in the oldest age groups, in both states the ratios of observed-to-expected deaths were highest among adults aged 20-49 (1.21; 95% prediction interval, 1.11-1.32). The ratio of observed-to-expected deaths for the Black population was especially elevated in Florida.
Conclusions
Although excess deaths were largely concentrated among older cohorts, the high ratios of observed-to-expected deaths among younger age groups indicate widespread effects of COVID-19. The high levels of observed-to-expected deaths among Black adults may reflect in part disparities in infection rates, preexisting conditions, and access to care. The finding of high excess deaths among Black adults deserves further attention.
Keywords
A primary challenge in understanding the public health effects of COVID-19 is determining the number of deaths directly and indirectly caused by the novel coronavirus SARS-CoV-2. Evolving diagnostic criteria, 1 testing supply constraints and the prioritization of tests for living patients, 2 and the challenges faced by overburdened intensive care units 3 posed obstacles to correctly identifying COVID-19 deaths early in the pandemic. The surge in the number of deaths due to COVID-19 likely exacerbated existing rates of errors in death certificates. 4 -6 Although it is not feasible to definitively attribute a death to being indirectly caused by SARS-CoV-2, a substantial number of deaths have likely been due to factors related to COVID-19, such as barriers in obtaining health care 7 and stress and isolation resulting from the pandemic. 8,9
A potentially useful approach to estimate deaths associated with COVID-19 is to use historical all-cause death data to estimate the expected (or counterfactual) number of deaths. The number of excess deaths can then be estimated as the observed number of deaths less the expected number of deaths. This methodology has been used to estimate the number of deaths following natural disasters 10 -13 and deaths due to COVID-19. 14 -20 COVID-19 analyses in the United States found varying levels of excess mortality, but these analyses largely focused on overall mortality at the national level. One exception was a study in Massachusetts that found little difference in excess COVID-19 mortality by sex. 14 National excess death levels were elevated among adults aged 25-44 from January 26 to October 3, 2020, 21 and rates from March to July 2020 were especially high in a region that included New York and New Jersey. 22 To our knowledge, the only study of racial differences in the number of excess deaths during the COVID-19 epidemic was a national analysis that found that excess deaths as a percentage of average deaths were 3 times higher among Black populations than among White populations. 21 That study, as well as a study by the Centers for Disease Control and Prevention (CDC), compared observed deaths in 2020 with the simple average for 2015-2019. 21,23
The objective of our study was to estimate all-cause excess mortality in the context of the COVID-19 pandemic in Florida and Ohio from March 15 through December 5, 2020. Florida and Ohio are the third- and seventh-largest states, respectively, in population size and contain a mix of urban and rural regions. The 2 states had different levels of COVID-19 infections. The states had similar temporal patterns of cases through May 2020, at which point Florida had a surge in the number of new cases that peaked at nearly 12 000 COVID-19 cases per day in late July and then decreased through September. 24 Both states had a wave of cases that began in October 2020 and persisted through the end of our analysis period (December 5, 2020). 24 The relatively large, diverse populations in Florida and Ohio and the differences in their COVID-19 experiences suggest that analyses of these states may offer insight that is generalizable to other states and countries.
We analyzed excess overall mortality, as well as by sex, age, and race, using administrative data. We examined the number of weekly and cumulative excess deaths and estimated expected deaths adjusting for population, secular trends, and seasonality in each state. Our study provides insight into the mortality risk of COVID-19 and improves our understanding of how that risk differs across sociodemographic groups and regions.
Methods
Data
We obtained mortality data from the state departments of health. The Ohio data were obtained on January 8, 2021, from the Ohio Public Health Information Warehouse. 25 The number of deaths were reported by week, sex (male, female), age group (0-19, 20-49, 50-59, 60-69, 70-79, ≥80), and race (Black, White). Data for 2010-2018 were finalized and data for 2019-2020 were provisional. We obtained the data for Florida via a research application to the Florida Bureau of Vital Statistics and provided at the decedent level (unpublished data, Florida Department of Health, December 30, 2020). We aggregated the data for our analysis. We aligned weeks across years based on Morbidity and Mortality Weekly Report weeks, which are assigned by the National Notifiable Diseases Surveillance System. 26
To measure population, we used the 2019 vintage version of bridged-race population postcensal estimates published by the National Vital Statistics System branch of CDC. 27 The US Census Bureau provided the data to CDC. To approximate populations for 2020, for each subgroup we calculated the 2014-2019 compound annual growth rate and applied the rate to the 2019 value.
Statistical Analysis
We performed a weekly time-series analysis in which we used 10 years of historical data to estimate the expected number of deaths in 2020. We defined excess mortality as the number of observed deaths minus the expected number of deaths. We also calculated the ratio of observed deaths to expected deaths, which takes a value of greater than 1 when excess deaths are present.
Our baseline period was the full set of weeks for each year from 2010 through 2019. The observation period began with the week ending March 21, 2020, and ended with the week ending December 5, 2020. The observed number of deaths refers to the actual number of deaths in 2020, whereas the expected number of deaths corresponds to the estimate based on data from the baseline period. Because variation in the number of deaths was greater than the mean, we used an overdispersed log-linear model to estimate the expected number of deaths. The exposure variable was the relevant population. We used annual indicator variables to account for secular trends in the number of deaths, while harmonic variables consisting of 4 Fourier terms adjusted for seasonality. We estimated the model separately for each state for all deaths and by sex, age group, and race. The estimating regression equation for expected deaths was:
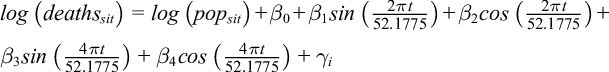
where deaths is the number of all-cause deaths for subgroup s in epidemiological year i and week t.
We modeled the variation in the expected number of deaths via parametric bootstrapping and followed a previous study of excess mortality related to COVID-19. 15 To conduct the parametric bootstrap, from each regression we obtained the asymptotic covariance matrix, which we then used along with the estimated parameter values to specify a multivariate normal distribution to approximate the sampling distribution. We drew 100 samples from this distribution from which we calculated the mean number of deaths for each. We then drew 100 samples from the Poisson distribution of each of these means, resulting in 10 000 samples for each subgroup and week. We estimated the 95% prediction interval bounds as the 2.5th and 97.5th percentile of the distribution.
Because our analysis used data on deceased people, the University of South Florida Institutional Review Board deemed this study exempt from human subjects review. We performed our estimations using Stata SE version 16 (StataCorp LLC). The Ohio mortality data, the population data, and the code used in the analysis are available online. 28 The Florida mortality data cannot be shared under the terms of the data use agreement.
Results
During the observation period, 176 902 all-cause deaths occurred in Florida and 101 919 all-cause deaths occurred in Ohio (Table). The expected numbers of deaths were 151 294 (95% prediction interval, 146 778-154 874) in Florida and 88 545 (95% prediction interval, 85 331-91 512) in Ohio. In both states, the point estimate of the ratio of observed-to-expected deaths was higher for males than for females (1.18 vs 1.16 in Florida; 1.16 vs 1.14 in Ohio). The pattern of ratios by age group was consistent in both states, apart from a substantially lower ratio in Ohio than in Florida for adults aged 60-69 (1.09 vs 1.15). In both states, although the number of excess deaths was highest among older age groups, the ratio of observed-to-expected deaths was highest for adults aged 20-49 (1.21 in Florida; 1.19 in Ohio). The ratios of observed-to-expected deaths were larger for Black people than for White people, with the disparity in Florida (1.30 vs 1.15) being greater than the disparity in Ohio (1.23 vs 1.14).
Cumulative excess deaths in Florida and Ohio, by demographic characteristics, March 15–December 5, 2020 a
aData sources: Florida Bureau of Vital Statistics (unpublished) and Ohio Department of Health. 25
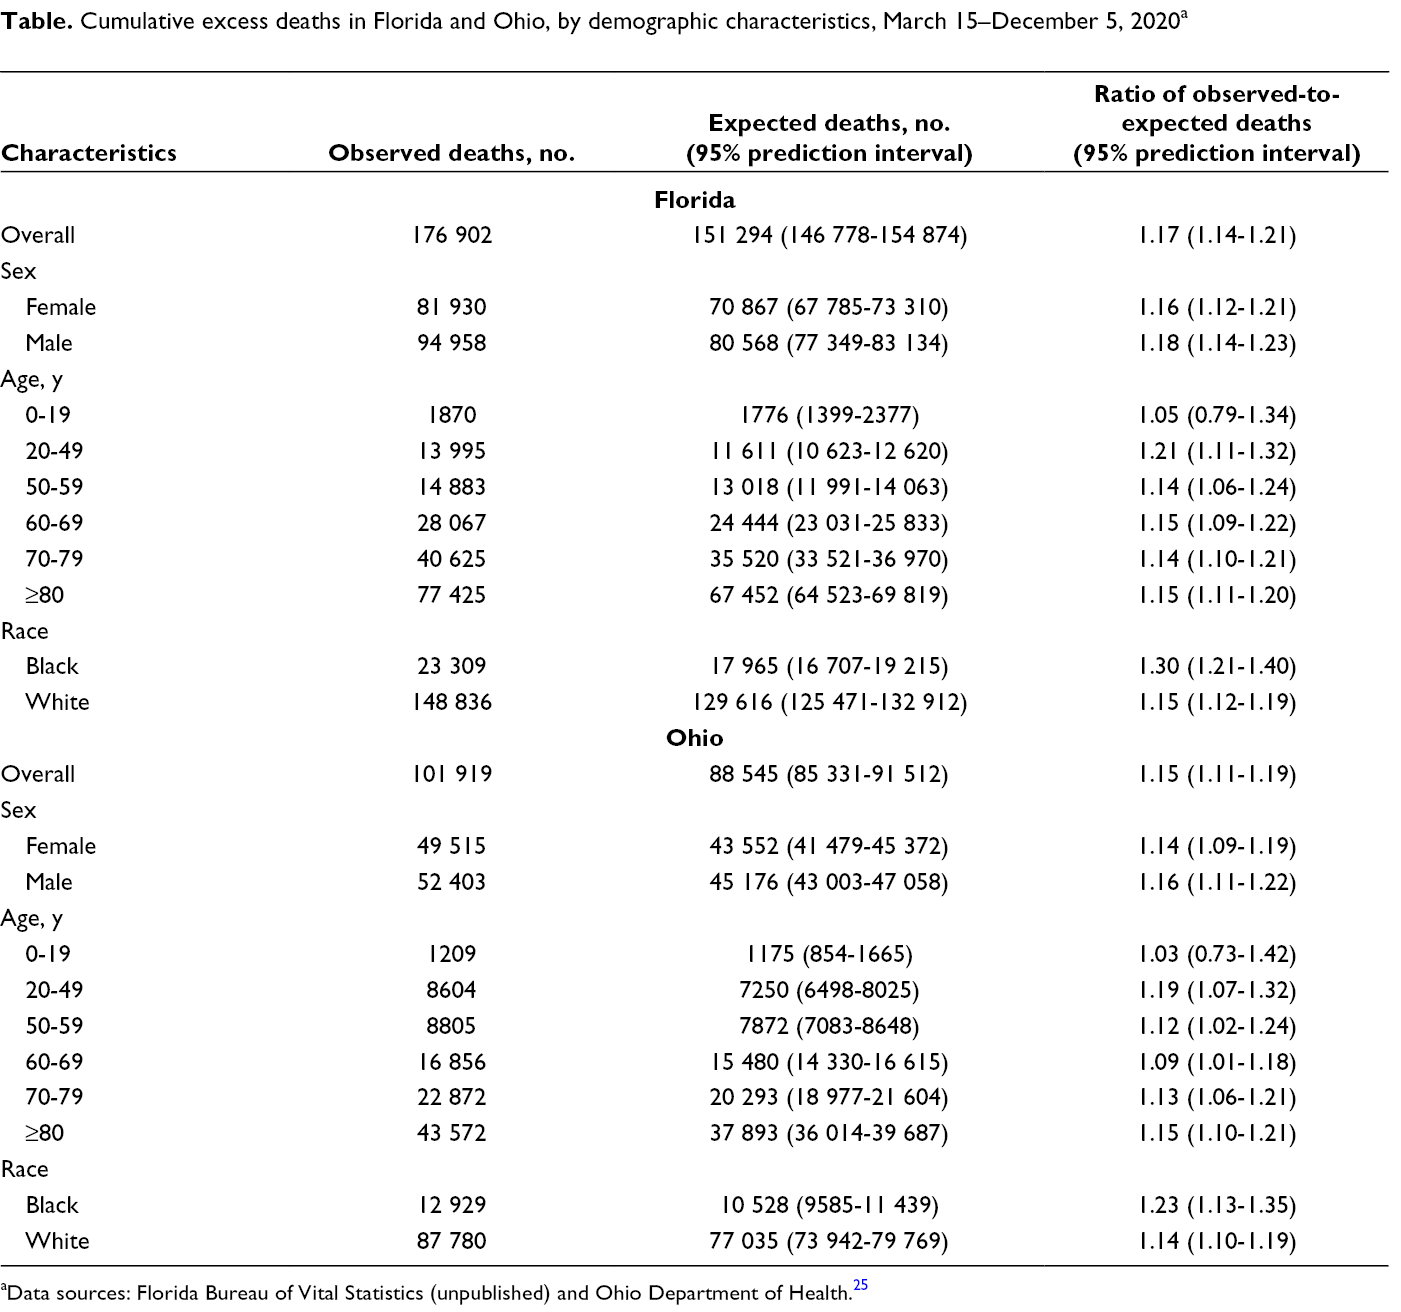
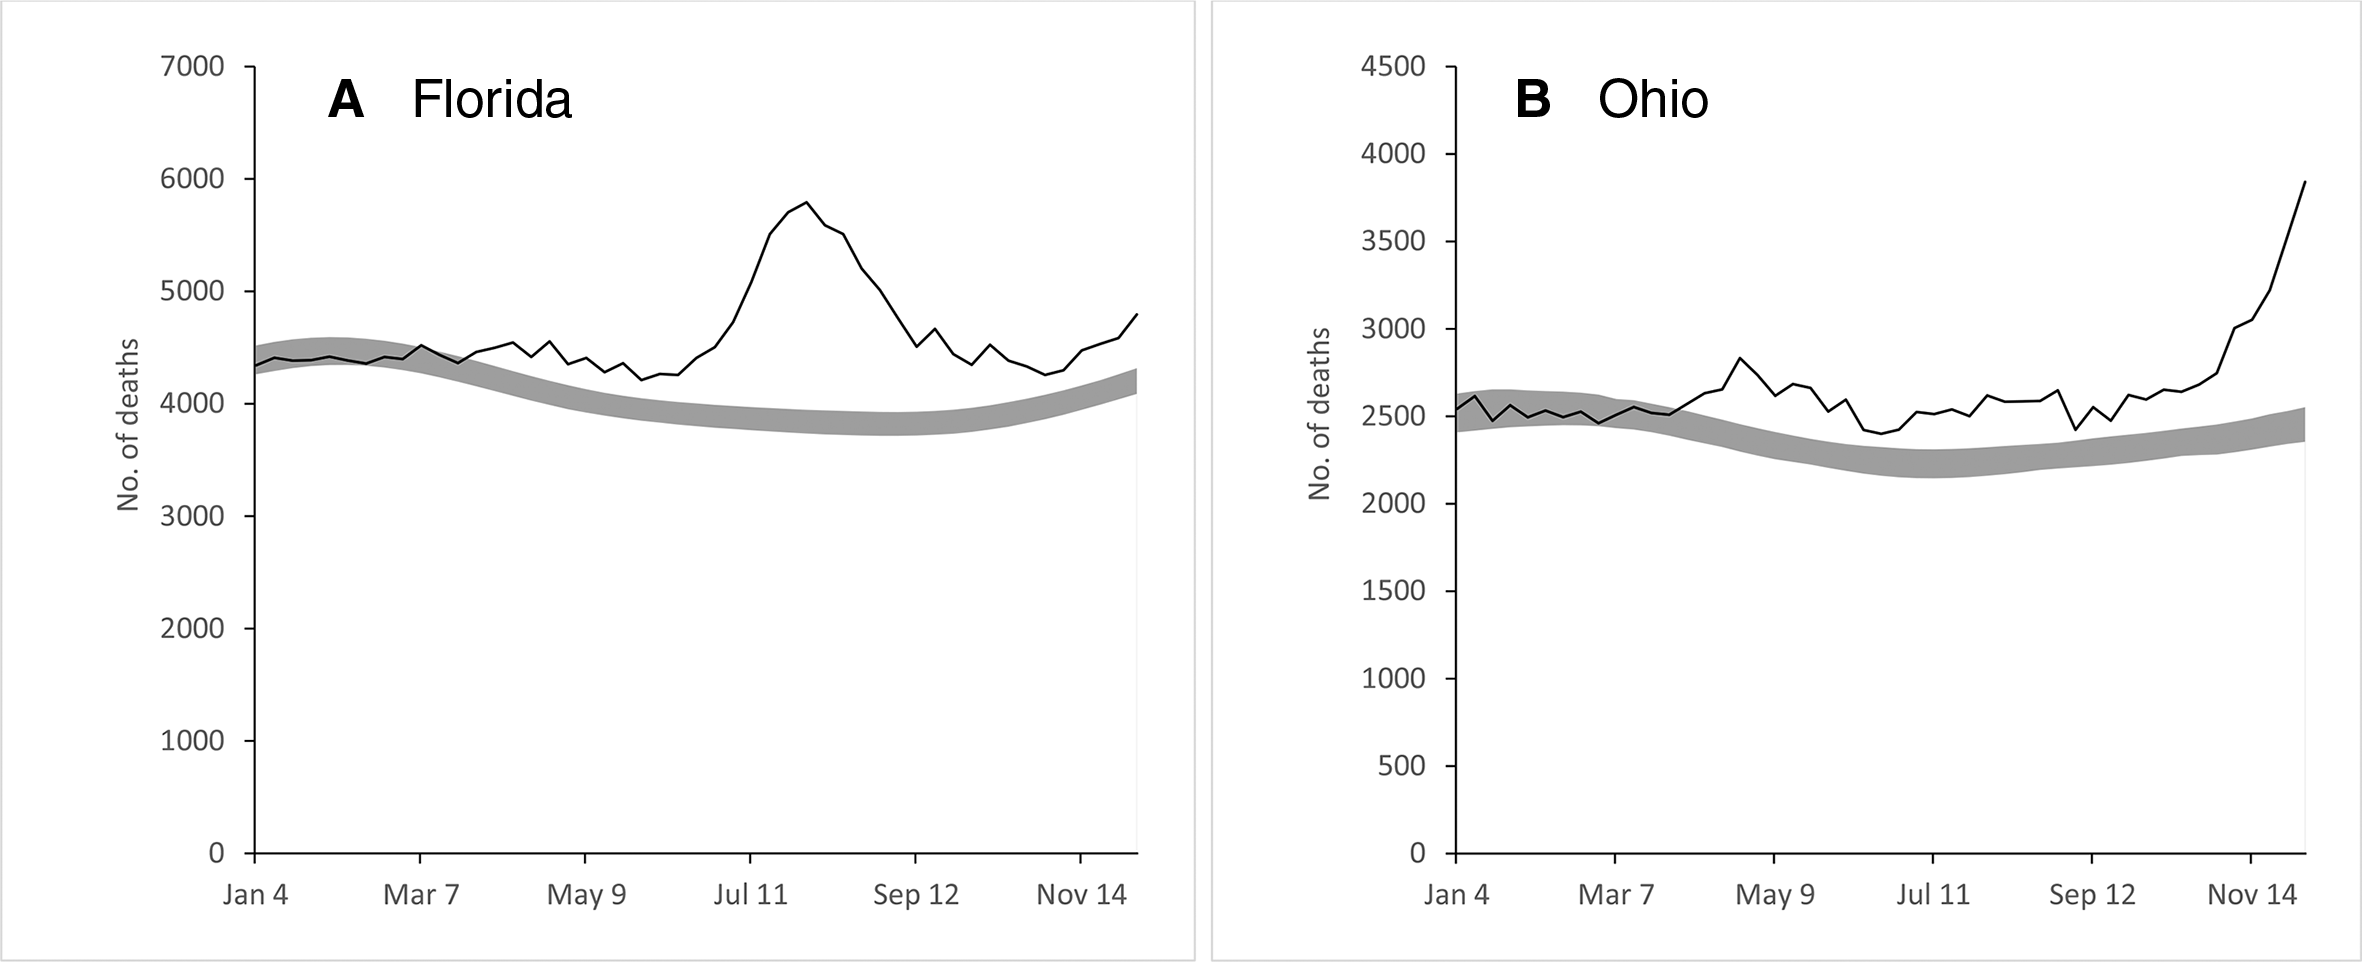
The pattern and timing of excess deaths differed between Florida and Ohio (Figure 1). Although the number of excess deaths in Florida peaked in late July and early August, the number of excess deaths in Ohio was relatively low and consistent through October but then increased at the end of the observation period. The number of excess deaths by sex generally followed the overall graphs, with the graphs for males showing slightly higher numbers of excess deaths throughout the observation period (Figure 2).
Excess deaths among adults aged ≥20 in (
Excess deaths among women aged ≥20 in (
Likewise, the graphs by age group generally followed the overall graphs except for adults aged 20-49 (Figure 3). The number of excess deaths for adults aged 20-49 in Florida was elevated during several weeks before and after the overall peak in Florida. In Ohio, a substantial number of excess deaths for this age group occurred from mid-April through May. In both states, the ratios of observed-to-expected deaths were consistently higher for Black people than for White people (Figure 4). The disparity was especially pronounced in Florida during the summer peak, during which the ratio of observed-to-expected deaths was nearly twice as high in Florida than in Ohio. In Ohio, the ratio of observed-to-expected deaths was higher for Black people than for White people from April 15 through August 31, 2020.
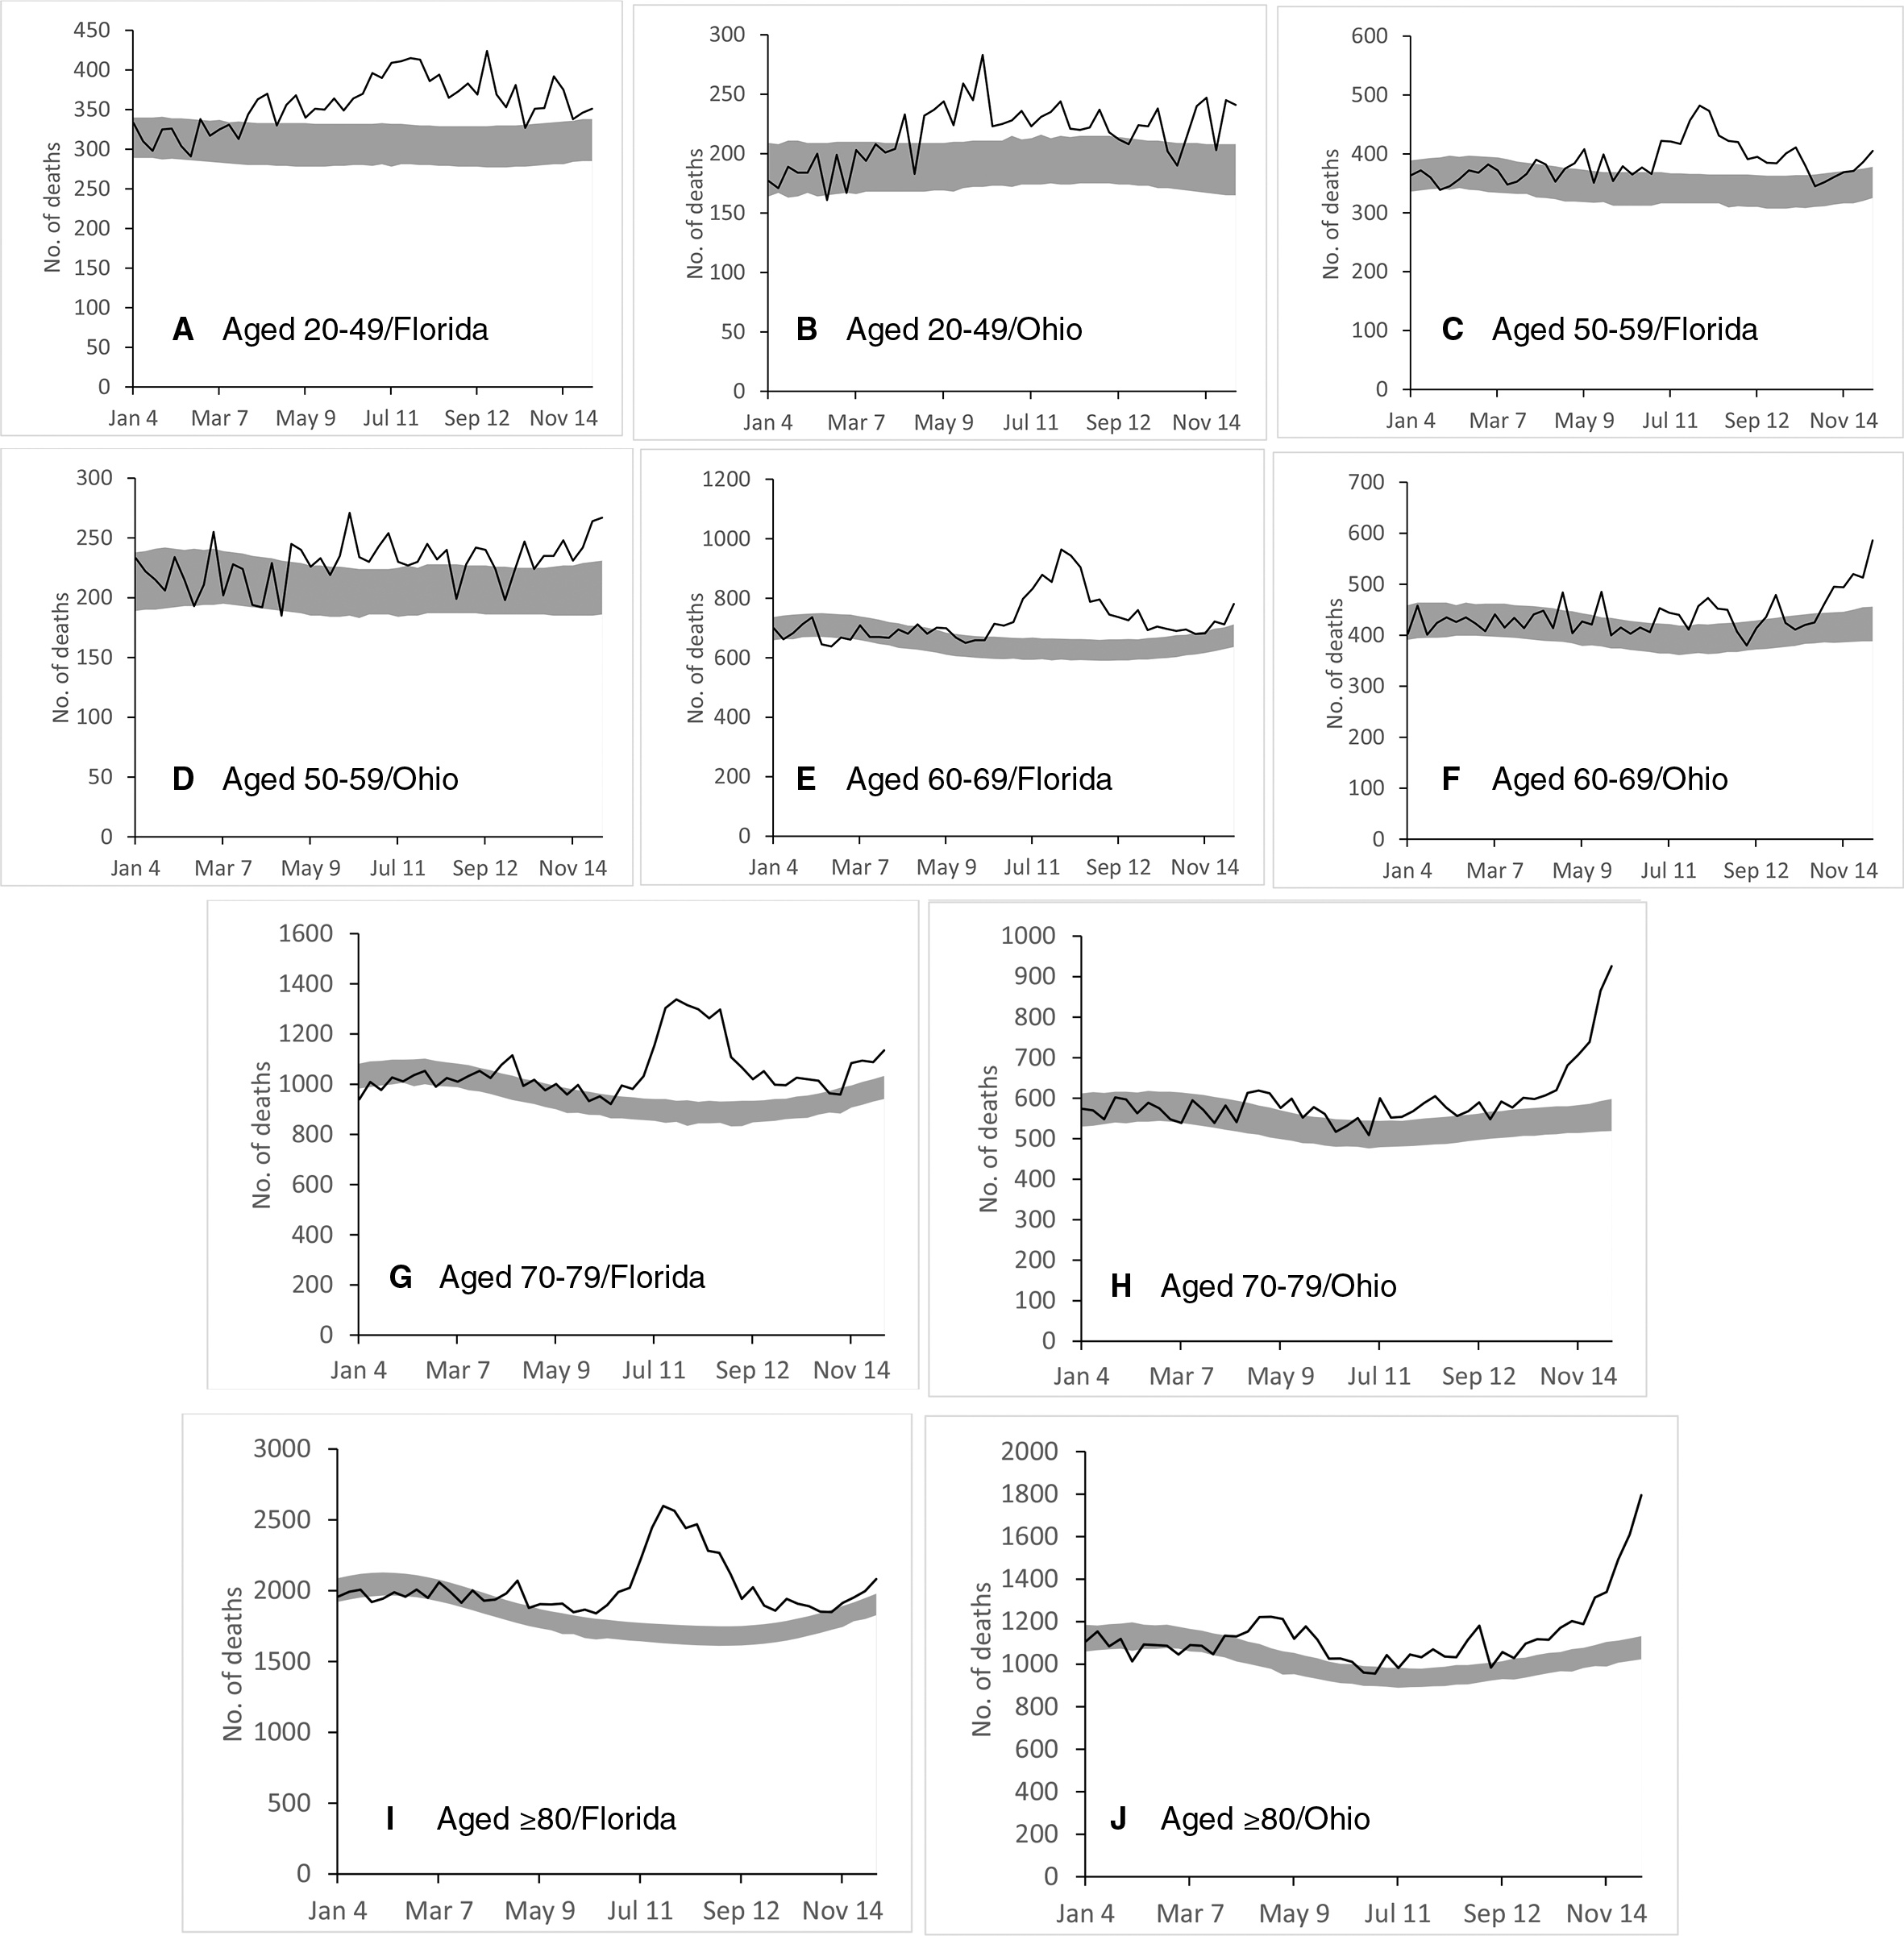
Excess deaths among adults aged 20-49 (
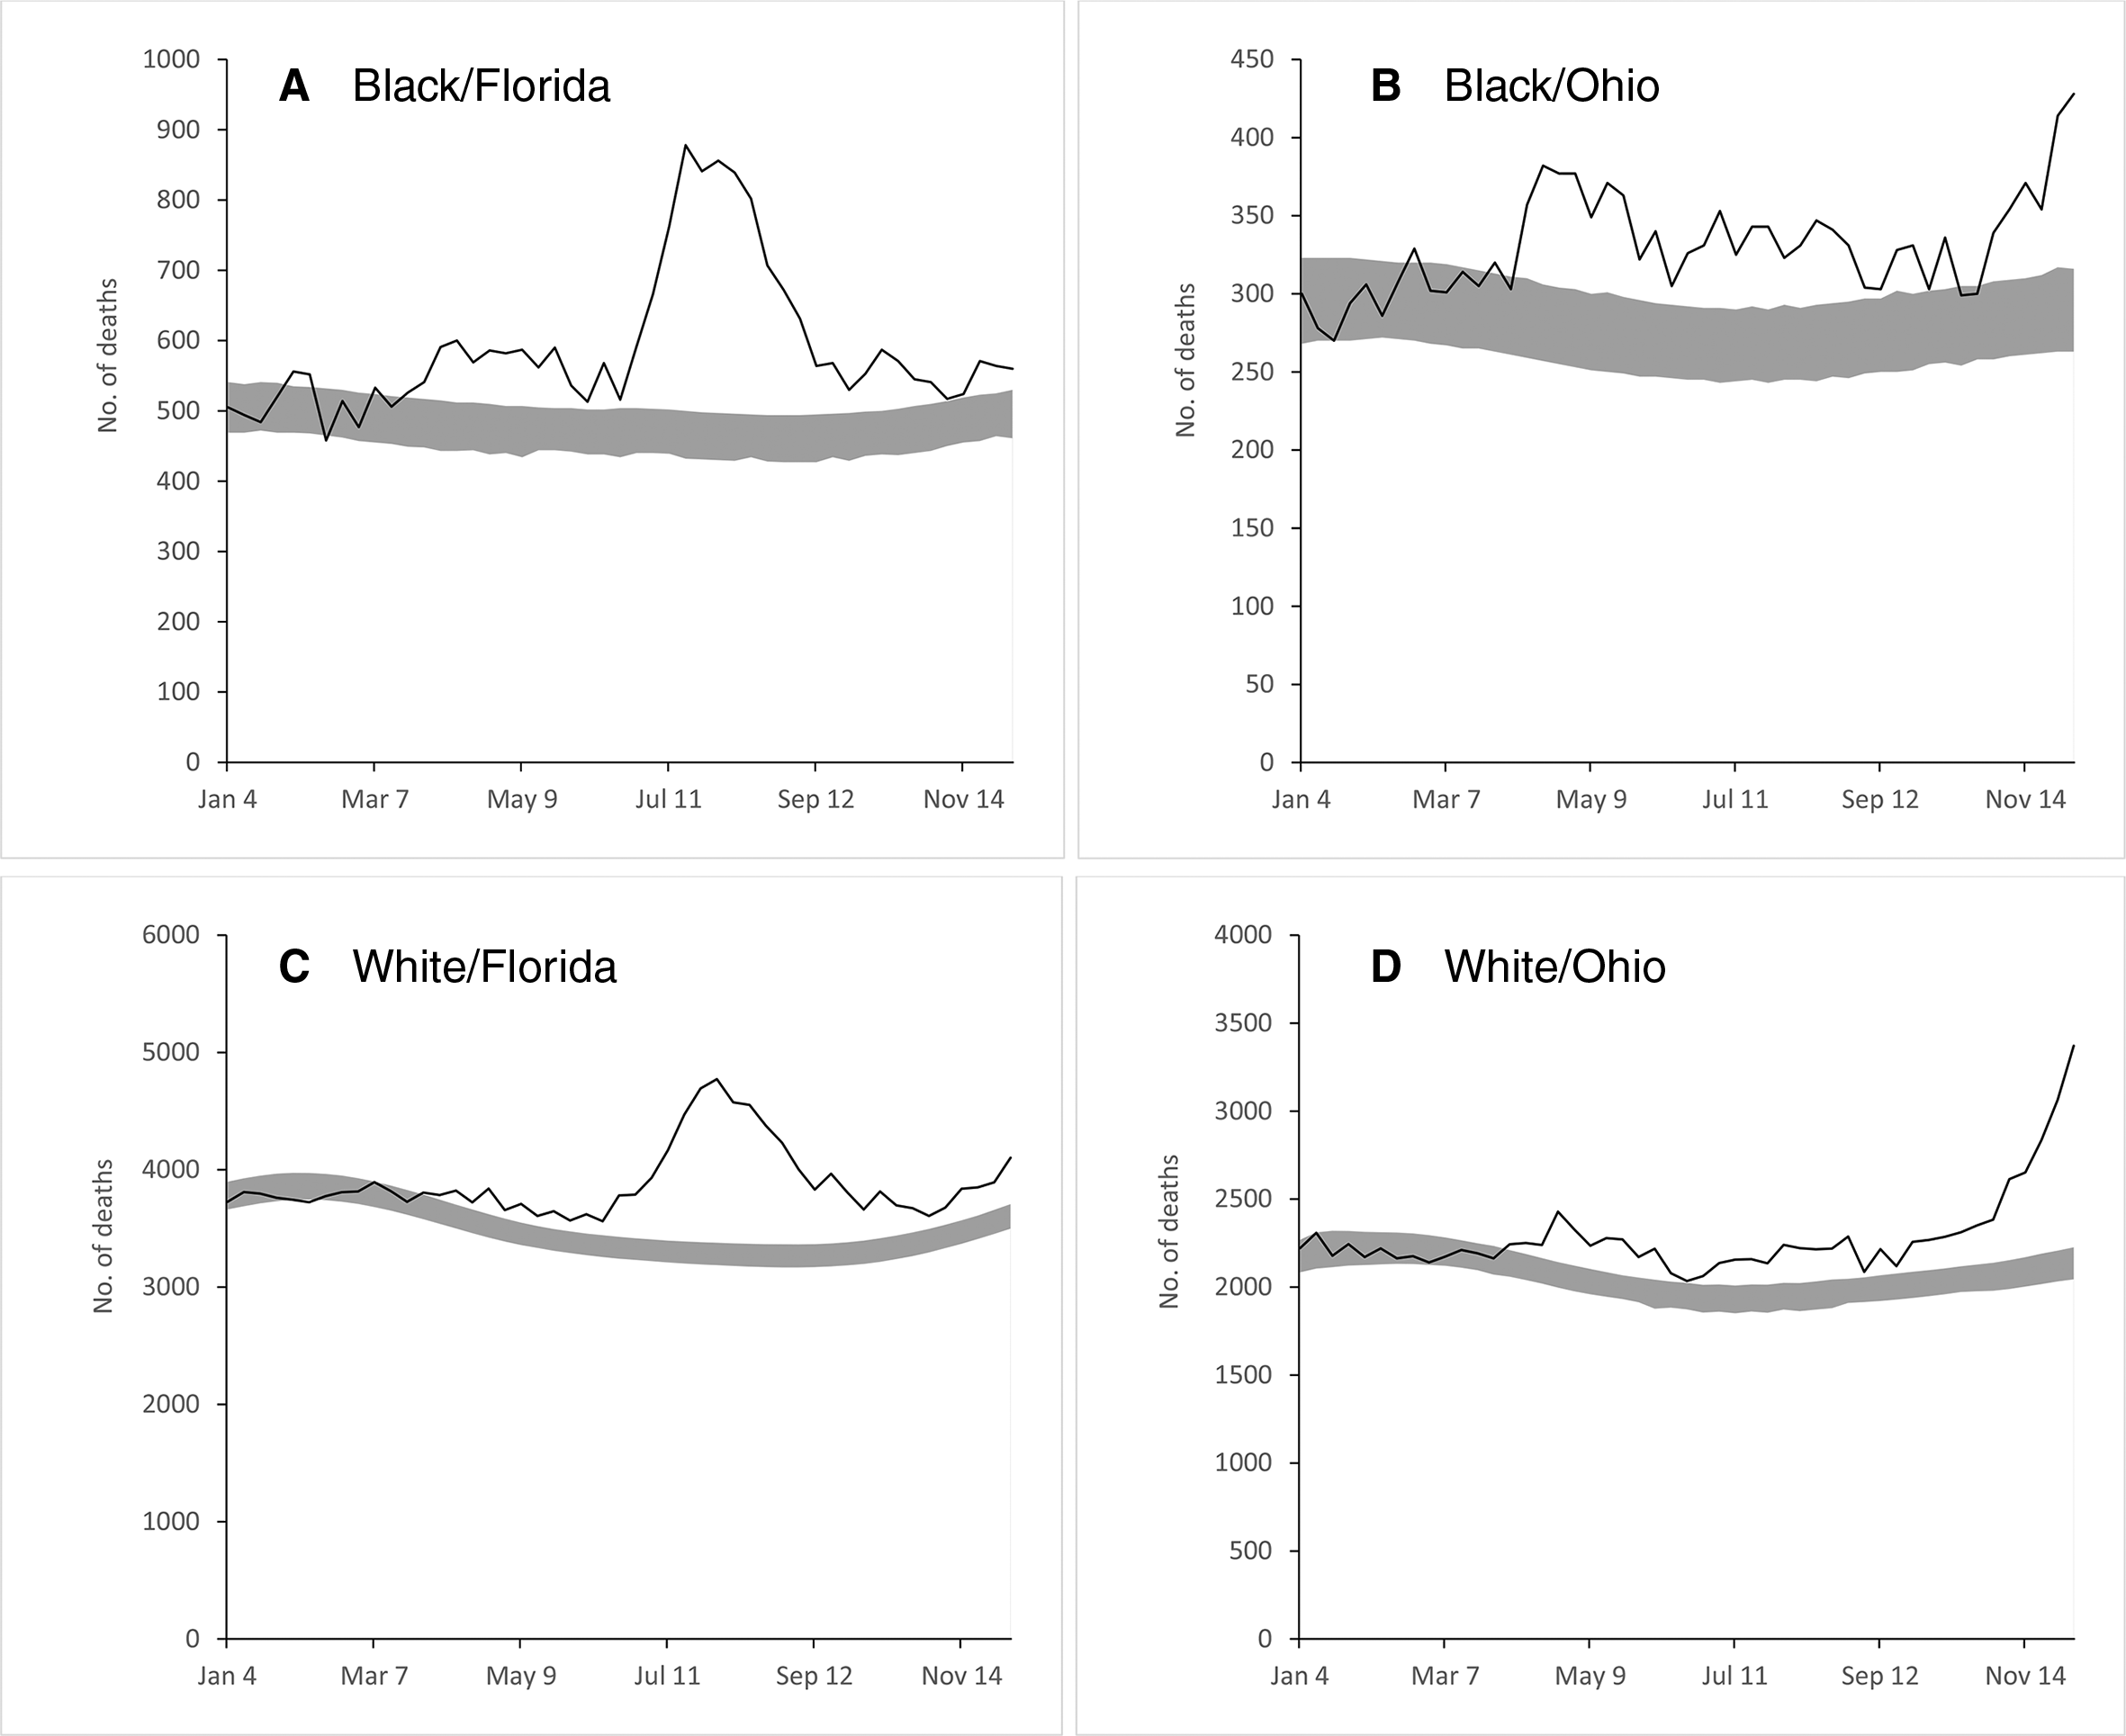
Excess deaths among Black adults aged ≥20 in (
Discussion
We analyzed administrative data and used a rigorous methodology to estimate the number of excess deaths associated with COVID-19 in Florida and Ohio. In our analyses of all deaths, we observed similar ratios of cumulative observed-to-expected deaths but different patterns over time. Among the age groups, adults aged 20-49 had the highest ratios of observed-to-expected deaths in both states. We also found substantial racial disparities in excess deaths in both states, with the disparity in Florida roughly twice as high as in Ohio. The patterns of overall excess deaths that we reported are consistent with estimates from CDC, in which the number of excess deaths in Florida spiked during summer 2020, whereas the number of excess deaths in Ohio increased toward the end of the year. 23 (CDC does not report excess deaths by sex, age group, or race.)
Our analysis demonstrates insights into the variability of excess mortality related to COVID-19 that can be obtained from state analyses relative to national perspectives. Although the cumulative estimates indicate similar patterns in Florida and Ohio, the timing of deaths highlights different experiences. The difference in estimates for the Black population in the 2 states shows that national analyses of COVID-19 mortality may obscure substantial variation.
Our finding that the highest ratios of observed-to-expected mortality were found among adults aged 20-49 is surprising given that COVID-19 is especially deadly for older people but is consistent with studies of excess mortality by age group. 21,22 In Florida, whereas the peak in excess mortality among adults aged 20-49 roughly coincided with the peak across all age groups, excess deaths for this age group began earlier and persisted longer. The peak of excess mortality among adults aged 20-49 in Ohio occurred in late May and early June and corresponded with a period of relatively limited excess mortality in the overall population. The difference in timing of overall excess mortality and excess mortality for this age group suggests the need for further study in determining the factors specific to this cohort.
Our estimates of elevated mortality for Black people are consistent with extensive literature finding poorer health outcomes for people of color compared with White people both generally 29 -31 and specifically in the context of COVID-19. 32,33 The finding that half of the deaths of Black people during Florida’s peak were excess deaths is alarming. Unlike the timing of deaths of adults aged 20-49, the surge in the number of Black decedents in Florida coincides with the peak in excess deaths across all deaths and suggests that COVID-19 was a primary factor. The reasons for the racial disparity are unclear. Findings of higher infection rates among Black people compared with White people in previous studies 34,35 suggest that the elevated numbers of excess deaths could be reduced by targeted mitigation measures. However, the presence of higher infection fatality rates (ie, the probability of dying for a person who is infected) 36 among the Black population 37 indicates that a greater likelihood of preexisting conditions, poorer health care access, discrimination, and inadequate treatment relative to other racial groups may also play a role in the elevated number of excess deaths. Counties with high proportions of Black people have higher rates of uninsured people and higher levels of air pollution than counties with lower proportions of Black people. 34 Compared with White people, Black people tend to have higher rates of employment in industries in which working from home is difficult or impossible. 38 Disparities in the presence of preexisting conditions may also contribute to the elevated ratios of observed-to-expected deaths that we observed in the Black population. 39 Efforts to improve access to health care and address structural issues may be effective in reducing the higher-than-expected number of excess deaths of Black people. Insight may be gained by investigating whether differences in infection rates or infection fatality rates are at least partly responsible for the differences in racial disparities between Florida and Ohio that we observed.
Limitations
Our study had several limitations. First, our analysis was limited to 2, albeit relatively large, states. The public health effects of COVID-19 have varied substantially; as such, our findings do not necessarily apply to all states and other countries. Second, the available data do not definitively identify whether deaths were caused by COVID-19. Third, our mortality data were imperfect because they were current as of January 2021 and deaths may be added to later years. The mortality data were based on the state in which the death occurred rather than the residence of the decedent. Data on state of residence and, relatedly, information on intrastate migration may add insight into the variability of excess deaths. As noted, the 2020 population data had to be estimated. Finally, our estimates are not age-adjusted; estimates that are not age-adjusted have been found to underestimate racial disparities in COVID-19 mortality in other contexts. 40
Conclusions
Although many aspects of COVID-19 mortality are unclear, a rapidly growing literature is improving our understanding of the complexities of COVID-19 deaths. Although our study is specific to Florida and Ohio, given that the states’ populations represent approximately 10% of the national population and are relatively diverse, our findings may improve our understanding of COVID-19 elsewhere. Our approach indicated important differences in the effects of COVID-19 across demographic groups. Although most excess deaths occurred among older age groups, the ratio of observed-to-expected deaths was especially high for young cohorts. We also observed high ratios of observed-to-expected deaths in the Black population, which may reflect preexisting disparities and structural differences faced by this group. Our results may provide information to help craft effective policy and medical responses. Furthermore, the methodology is robust to the imperfect coding of deaths that is common in crisis environments. Policy makers, public health officials, and health care providers may be able to apply our findings to mitigate the destructive effects of COVID-19 and better prepare for future epidemics.
Footnotes
Acknowledgments
The authors thank the Ohio Department of Health and the Florida Department of Health for providing mortality data. The Ohio Department of Health disclaims responsibility for any analyses, interpretations, or conclusions. Any published findings and conclusions are those of the authors and do not necessarily represent the official position of the Florida Department of Health.
Declaration of Conflicting Interests
The authors declared no potential conflicts of interest with respect to the research, authorship, and/or publication of this article.
Funding
The authors received no financial support for the research, authorship, and/or publication of this article.