
Abstract
Objectives
Electronic cigarette (e-cigarette) use has increased steadily in the United States, but little research has examined its prevalence in states comprising Appalachia, a rural region known for high rates of tobacco use. This study assessed lifetime and current e-cigarette use among adults by sociodemographic characteristics, geographic region, and cigarette smoking in Kentucky, with a focus on the Appalachian region.
Methods
We used data from the 2016-2017 Behavioral Risk Factor Surveillance System (BRFSS) surveys to calculate the prevalence of lifetime and current e-cigarette use, and we used weighted multivariable logistic regression analyses to examine the relative influence of other factors.
Results
Among adults in Kentucky, 5.8% (95% CI, 5.2%-6.4%) were current e-cigarette users and 27.0% (95% CI, 25.9%-28.0%) were lifetime users, compared with state medians of 4.6% (95% CI, 4.0%-5.1%) and 21.4% (95% CI, 19.4%-23.5%) for the United States. Multivariable regression models showed similar patterns for all regions: higher prevalence odds of current e-cigarette use among adults aged 18-24, current conventional smokers, and adults unable to work. Generally, Appalachian residents of Kentucky did not have significantly higher rates of lifetime or current e-cigarette use as compared with other non-Appalachian residents of Kentucky. Hispanic residents of Appalachian Kentucky, however, had higher rates of e-cigarette use than Hispanic residents of other regions of Kentucky.
Conclusions
Rates of e-cigarette use were higher in Kentucky than in the United States but were not further elevated in Kentucky’s Appalachian region. High rates of e-cigarette use among Hispanic residents of Appalachia indicate a need to focus future interventions in the region.
Electronic cigarettes (e-cigarettes) were introduced more than a decade ago in the United States, and recent studies 1,2 demonstrate that the prevalence of e-cigarette use has increased rapidly since then. In 2016, lifetime median e-cigarette use in the United States was 22.1%, and the median prevalence of e-cigarette use was higher among males (24.8%) than among females (18.6%). 3 Moreover, current e-cigarette use is most common among young adults, with those aged 18-24 reporting the highest prevalence (7.6%) and adults aged ≥65 reporting the lowest prevalence (0.8%). 2,4 Although the use of combustible cigarettes has declined in recent years, use of e-cigarettes has grown in prevalence. 4,5 In 2014, e-cigarettes became the most commonly used tobacco product among teens and young adults. 6 Use of e-cigarettes, however, still contributes to nicotine addiction and risk of respiratory (eg, chronic obstructive pulmonary disease, lung cancer) and cardiovascular (eg, coronary heart disease, stroke) disease. 7 Furthermore, some e-cigarettes have been found to contain carcinogens and toxins in their aerosols. 8,9
Studies examining e-cigarette use among US populations have mostly described correlates of e-cigarette use and median prevalence for all 50 states and the District of Columbia using datasets that are representative of state populations. 3,10 Information on the use of e-cigarettes is limited in individual states, particularly for states with a high prevalence of cigarette smoking or with substantial Appalachian populations. This lack of knowledge is important because some of the highest rates of smoking, chronic respiratory disease, and cancer in the United States are found in Central Appalachia (Figure), a region that includes portions of Kentucky, West Virginia, Virginia, and Tennessee that have high rates of poverty and a legacy of natural resource extraction that has resulted in poor health outcomes. 12 Furthermore, evidence suggests that Appalachian adolescents and young adults aged 11-19 years commonly use e-cigarettes but do not recognize their potential harm. 13,14
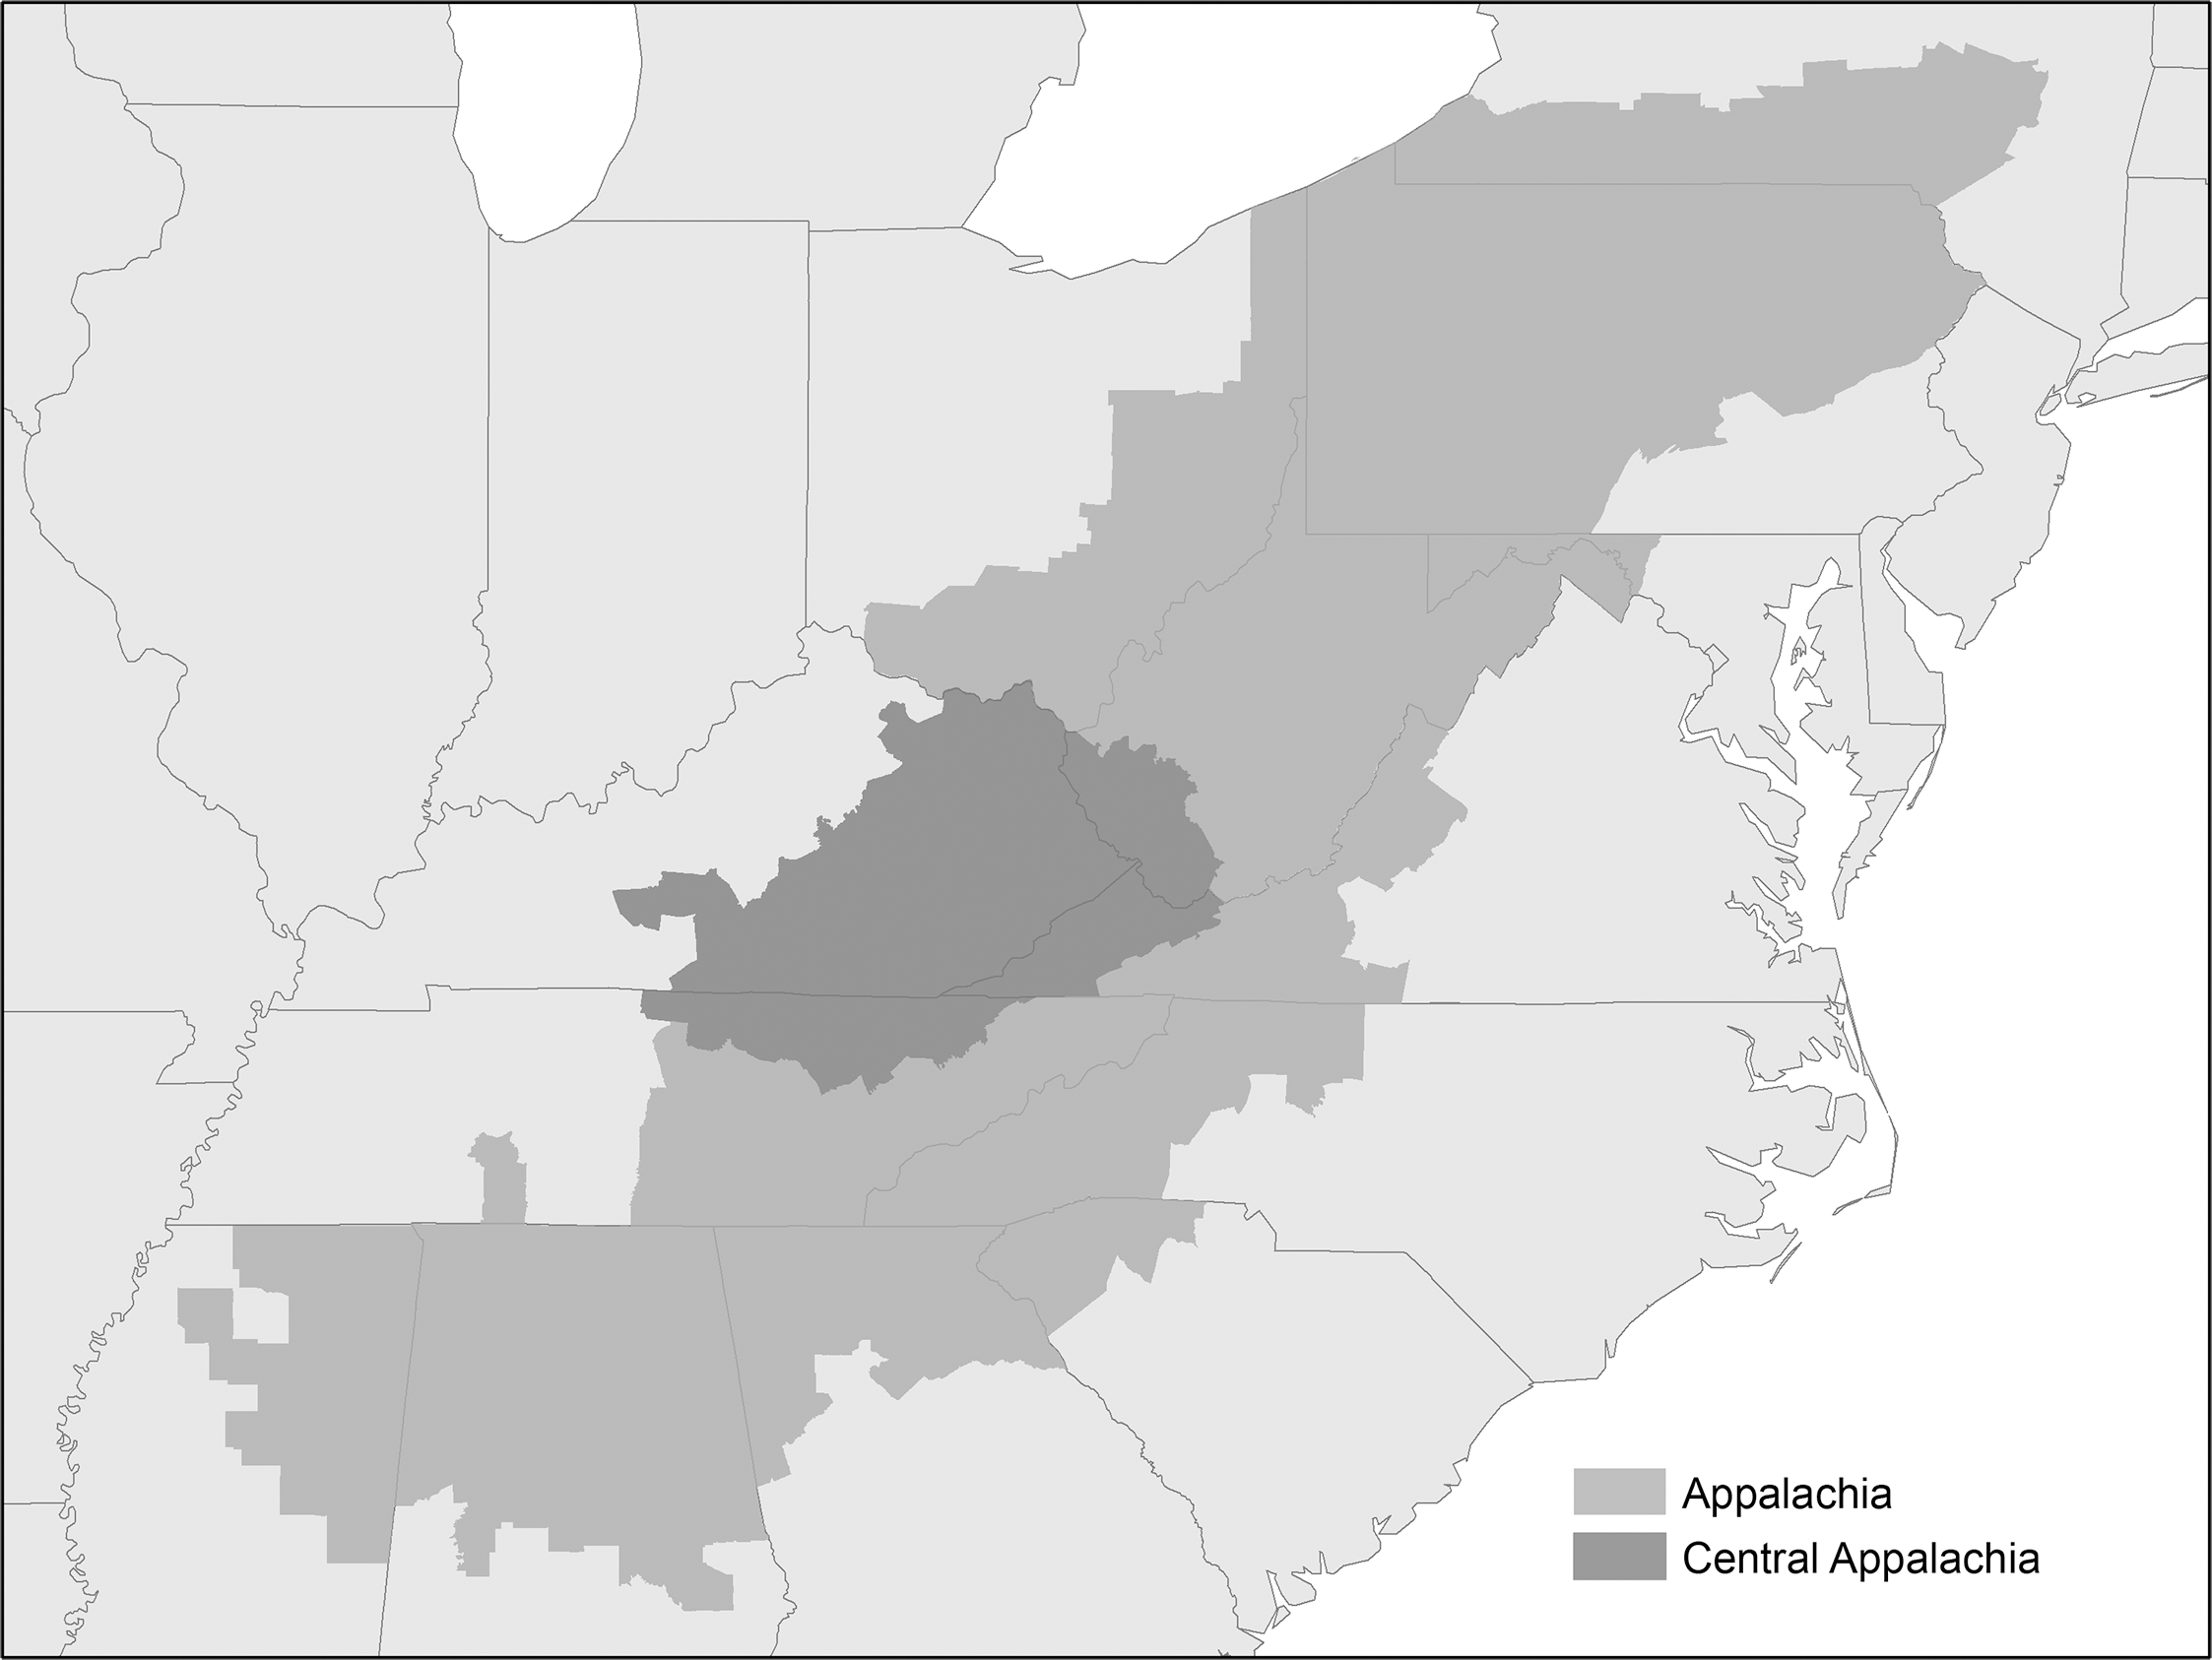
Appalachian region and Central Appalachian subregion of the United States, as designated by the Appalachian Regional Commission, 2021. 11
In 2016, the Kentucky Behavioral Risk Factor Surveillance System (BRFSS) introduced several questions related to e-cigarette use for the first time. 15 Although the prevalence of combustible cigarette smoking has declined during the past decade, 16,17 the uptake of emerging tobacco products has increased in the past several years, particularly among former and current adult cigarette smokers. 18 Given these trends, and the similarity of e-cigarettes to tobacco cigarettes, 19 -21 widespread e-cigarette use could limit the effectiveness of tobacco control policies. Previous studies have examined the use of e-cigarettes, 16,17,22 but information about e-cigarette use in the Appalachian region is limited. The objectives of this study were to (1) assess the distribution of e-cigarette use by sociodemographic characteristics, geographic region, and smoking status among adults in Kentucky, with a special focus on the state’s Appalachian region, and (2) compare e-cigarette use in Kentucky and its Appalachian region with broader trends in e-cigarette use in the United States.
Methods
Data Sources
We used data from the 2016-2017 BRFSS, an annual random-digit–dialed telephone (landline and mobile) survey administered by each state and participating territory. This survey has tracked health-related risk behaviors, preventive services, and chronic conditions among US adults since 1984, and the data have been shown to be both reliable and valid for assessing prevalence of health risk behaviors. 23 Responses to the survey are weighted to the population to allow estimation of population-based prevalence rates. Detailed information about the BRFSS is available elsewhere. 24
The average response rate for the years 2016 and 2017 combined was 56.1% for Kentucky and 47.1% for the United States. For Kentucky, we used data obtained directly from the Kentucky BRFSS program for years 2016 and 2017 that included county of residence for all respondents. This detail was necessary to assign all respondents to a county of residence and other geographic regions in Kentucky. In 2016, the first year of the study period, an estimated 4 438 182 people were residents of Kentucky; 1 168 627 lived in 1 of 54 Appalachian counties, and 3 269 555 lived in 1 of the remaining 66 non-Appalachian counties. 11,25
We pooled 2016 and 2017 national BRFSS datasets for a total of 896 543 respondents, or 96% of the entire survey population. We excluded data on 4% of respondents who had missing information, responded “don’t know/not sure,” or refused to answer. The Medical Institutional Review Board at the University of Kentucky ruled this study exempt, because it relied on existing, de-identified data.
E-cigarette and Combustible Cigarette Use
For both Kentucky and national BRFSS data, we ascertained lifetime e-cigarette use with the question, “Have you ever used an e-cigarette or other electronic ‘vaping’ product, even just one time, in your entire life?” Respondents who answered yes were asked a second question: “Do you now use e-cigarettes or other electronic ‘vaping’ products every day, some days, or not at all?” We categorized participants who answered “every day” or “some days” to this question as current e-cigarette users. Similarly, we classified survey respondents as current combustible cigarette smokers if they reported smoking ≥100 cigarettes in their lifetime and smoking “every day” or “some days” at the time of the survey. If they reported smoking at least 100 cigarettes during their lifetime, but not smoking at the time of the survey, we classified them as former smokers. We defined never smokers as respondents who had smoked <100 cigarettes during their lifetime.
Other Covariates
Other socioeconomic covariates included in our analyses were age (18-24, 25-44, 45-54, 55-64, ≥65), sex (female, male), race/ethnicity (non-Hispanic White, non-Hispanic Black, Hispanic, non-Hispanic multiracial, non-Hispanic “other” [American Indian/Alaska Native, Asian, Native Hawaiian/Other Pacific Islander]), education level (<high school graduate, high school graduate, some college, or college graduate), annual household income (<$25 000, $25 000-$49 999, ≥$50 000), and employment status (employed, unemployed, unable to work, student/homemaker/retired). We identified respondents living in Appalachian Kentucky by their county’s designation as Appalachian (N = 54) by the Appalachian Regional Commission. 11 All counties in Kentucky’s Appalachian region are considered part of Central Appalachia.
Statistical Analysis
We calculated weighted prevalence estimates with 95% CIs for lifetime e-cigarette use and current e-cigarette use overall and for population subgroups in Kentucky. The merged 2-year datasets were reweighted to produce Kentucky-specific weighted estimates, using guidance provided by the BRFSS. 26,27 Specifically, we generated a uniform final weight by multiplying the existing weight by the proportion of respondents for each survey year by the common weight. For comparison, we obtained median state prevalence estimates of current and lifetime e-cigarette use for each population subgroup by using the national BRFSS dataset.
For Kentucky, we compared the prevalence of e-cigarette use by participant characteristics using weighted logistic regression models adjusted for age group, sex, race/ethnicity, annual household income, cigarette use, and employment status. We produced similar models using national data, but we did not use the BRFSS survey weights, because those weights are based on populations of individual states or territories rather than the nation. Although the literature generally concedes that weights should be used for descriptive statistics, debate exists about the use of weights in multivariable analyses. 28,29 In these larger samples, weighted and unweighted estimates do not vary substantially, as noted in work by Bertrand and colleagues in a study assessing contraceptive use and in an Australian study by Currier and colleagues. 30,31
We performed all analyses using SAS version 9.4 (SAS Institute, Inc) using survey procedures to account for the complex sample survey design, where indicated; we considered P < .05 to be significant.
Results
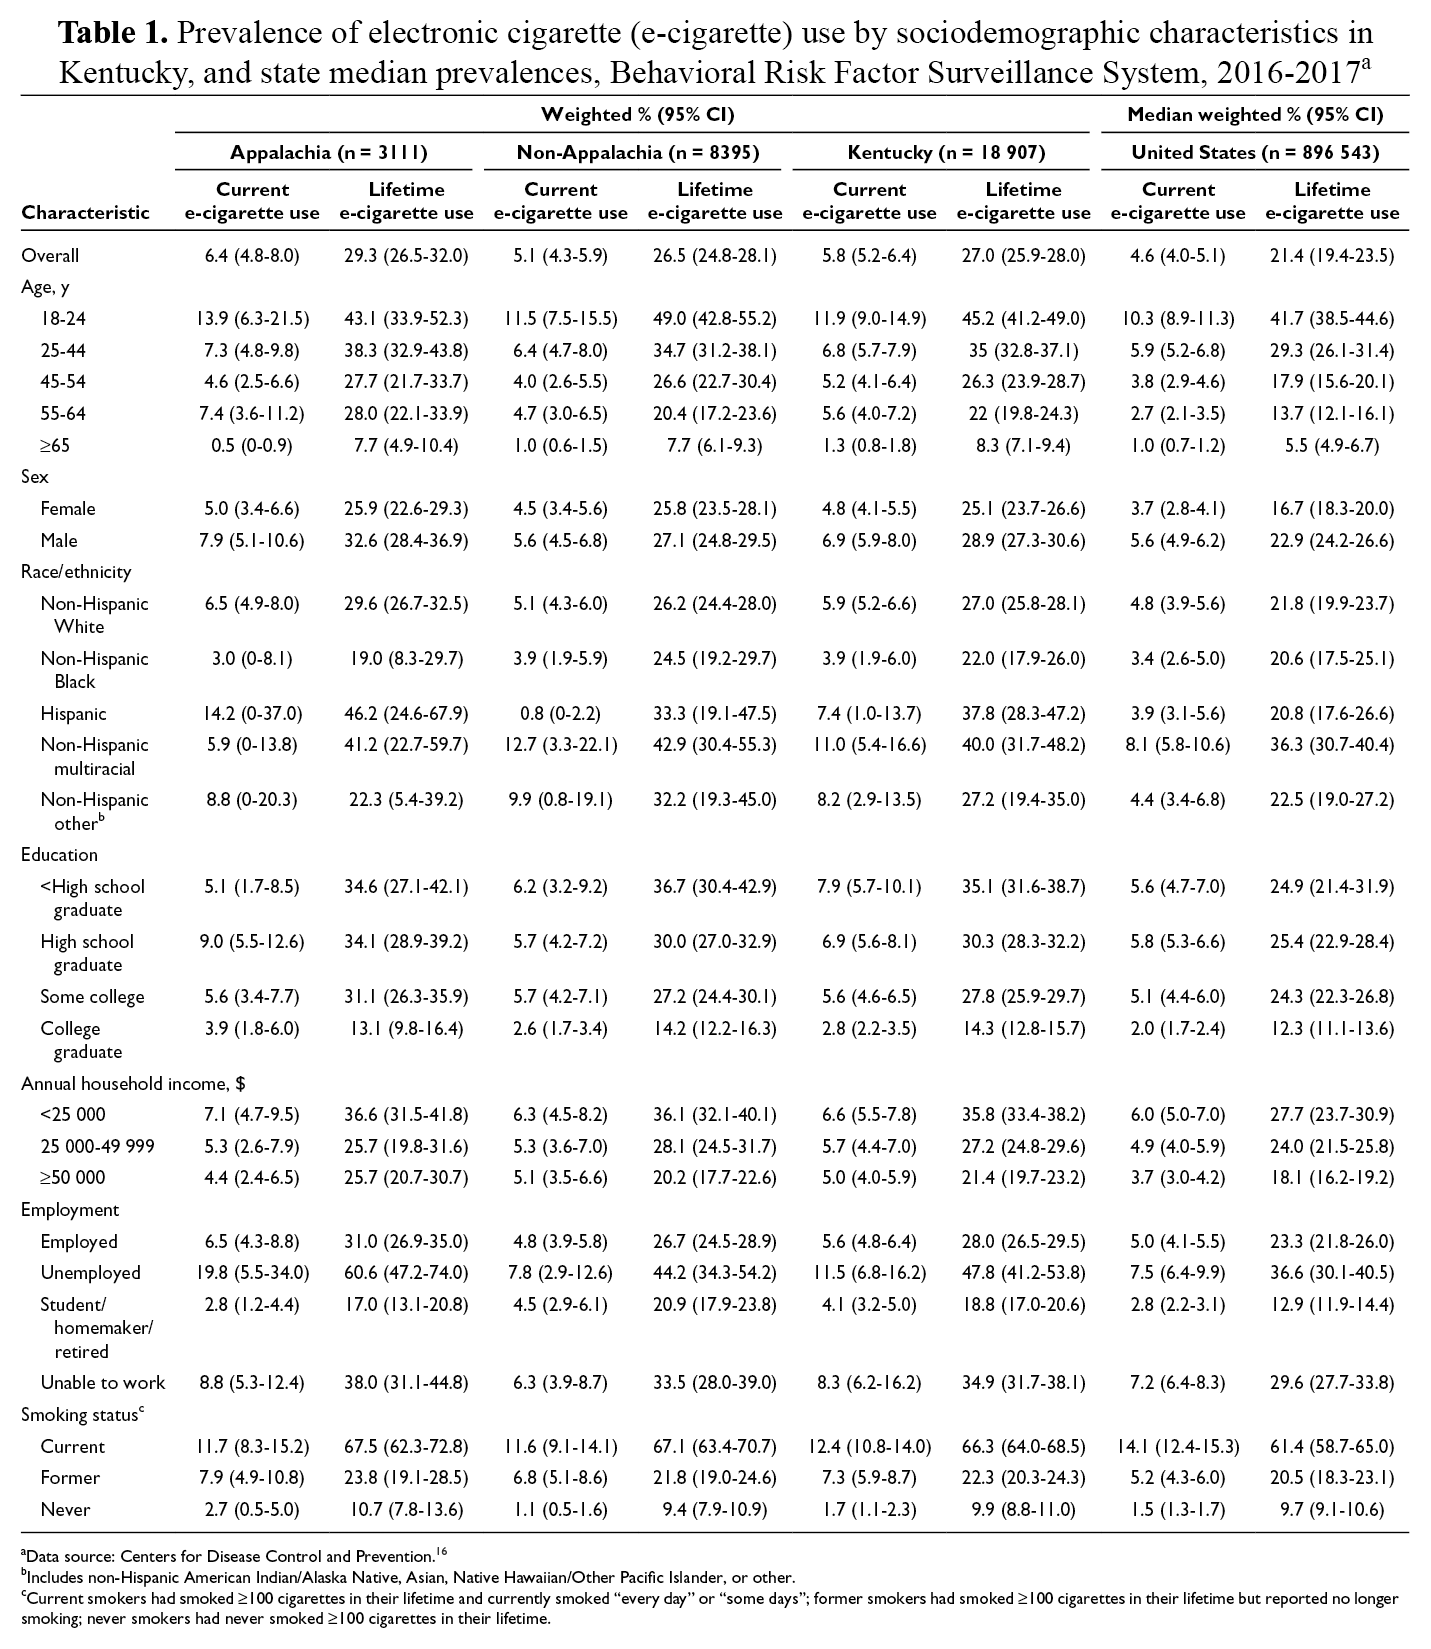
The prevalence of current e-cigarette use was 5.8% (95% CI, 5.2%-6.4%) in Kentucky, and the median US prevalence was 4.6% (95% CI, 4.0%-5.1%; Table 1). The prevalence of lifetime e-cigarette use was also higher in Kentucky (27.0%; 95% CI, 25.9%-28.0%) than the median US prevalence of 21.4% (95% CI, 19.4%-23.5%). Across age groups, the prevalence of current e-cigarette use was highest among young adults aged 18-24 in Kentucky (11.9%; 95% CI, 9.0%-14.9%) and in the United States (10.3%; 95% CI, 8.9%-11.3%). The prevalence of current e-cigarette use decreased with age in Kentucky and the United States: by age, adults aged ≥65 had the lowest prevalence in both Kentucky (1.3%; 95% CI, 0.8%-1.8%) and the United States (1.0%; 95% CI, 0.7%-1.2%). The prevalence of e-cigarette use also differed by education level; in Kentucky, adults with <high school education had the highest prevalence of e-cigarette use (current and lifetime), and adults with a college degree had the lowest prevalence of e-cigarette use. In the United States, however, adults with <high school education had a slightly lower prevalence of e-cigarette use than adults with a high school diploma.
Prevalence of electronic cigarette (e-cigarette) use by sociodemographic characteristics in Kentucky, and state median prevalences, Behavioral Risk Factor Surveillance System, 2016-2017 a
aData source: Centers for Disease Control and Prevention. 16
bIncludes non-Hispanic American Indian/Alaska Native, Asian, Native Hawaiian/Other Pacific Islander, or other.
cCurrent smokers had smoked ≥100 cigarettes in their lifetime and currently smoked “every day” or “some days”; former smokers had smoked ≥100 cigarettes in their lifetime but reported no longer smoking; never smokers had never smoked ≥100 cigarettes in their lifetime.
By race/ethnicity, the prevalence of current e-cigarette use was highest among multiracial respondents in Kentucky (11.0%; 95% CI, 5.4%-16.6%) and the United States (8.1%; 95% CI, 5.8%-10.6%). For lifetime e-cigarette use, prevalence was highest among young adults aged 18-24 in Kentucky (45.2%; 95% CI, 41.2%-49.0%) and the United States (41.7%; 95% CI, 38.5%-44.6%). Men had a higher prevalence than women of lifetime use of e-cigarettes both in Kentucky (28.9%; 95% CI, 27.3%-30.6%) and in the United States (22.9%; 95% CI, 24.2%-26.6%). The prevalence of lifetime e-cigarette use in Kentucky was highest among multiracial respondents (40.0%; 95% CI, 31.7%-48.2%) and lowest among non-Hispanic Black respondents (22.0%; 95% CI, 17.9%-26.0%). The prevalence of current e-cigarette use in Kentucky was highest among current combustible cigarette smokers (12.4%; 95% CI, 10.8%-14.0%) followed by former smokers (7.3%; 95% CI, 5.9%-8.7%). Similarly, in the United States, the prevalence of current e-cigarette use was highest among current smokers (14.1%; 95% CI, 12.4%-15.3%) and former smokers (5.2%; 95% CI, 4.3%-6.0%). Respondents who never smoked had the lowest rates of current e-cigarette use in Kentucky (1.7%; 95% CI, 1.1%-2.3%) and the United States (1.5%; 95% CI, 1.3%-1.7%).
We found no significant difference in the prevalence of current e-cigarette use between Appalachian (6.4%; 95% CI, 4.8%-8.0%) and non-Appalachian (5.1%; 95% CI, 4.3%-5.9%) regions of Kentucky. We also found no significant difference in the prevalence of lifetime e-cigarette use between Appalachian (29.3%; 95% CI, 26.5%-32.0%) and non-Appalachian (26.5%; 95% CI, 24.8%-28.1%) regions of Kentucky.
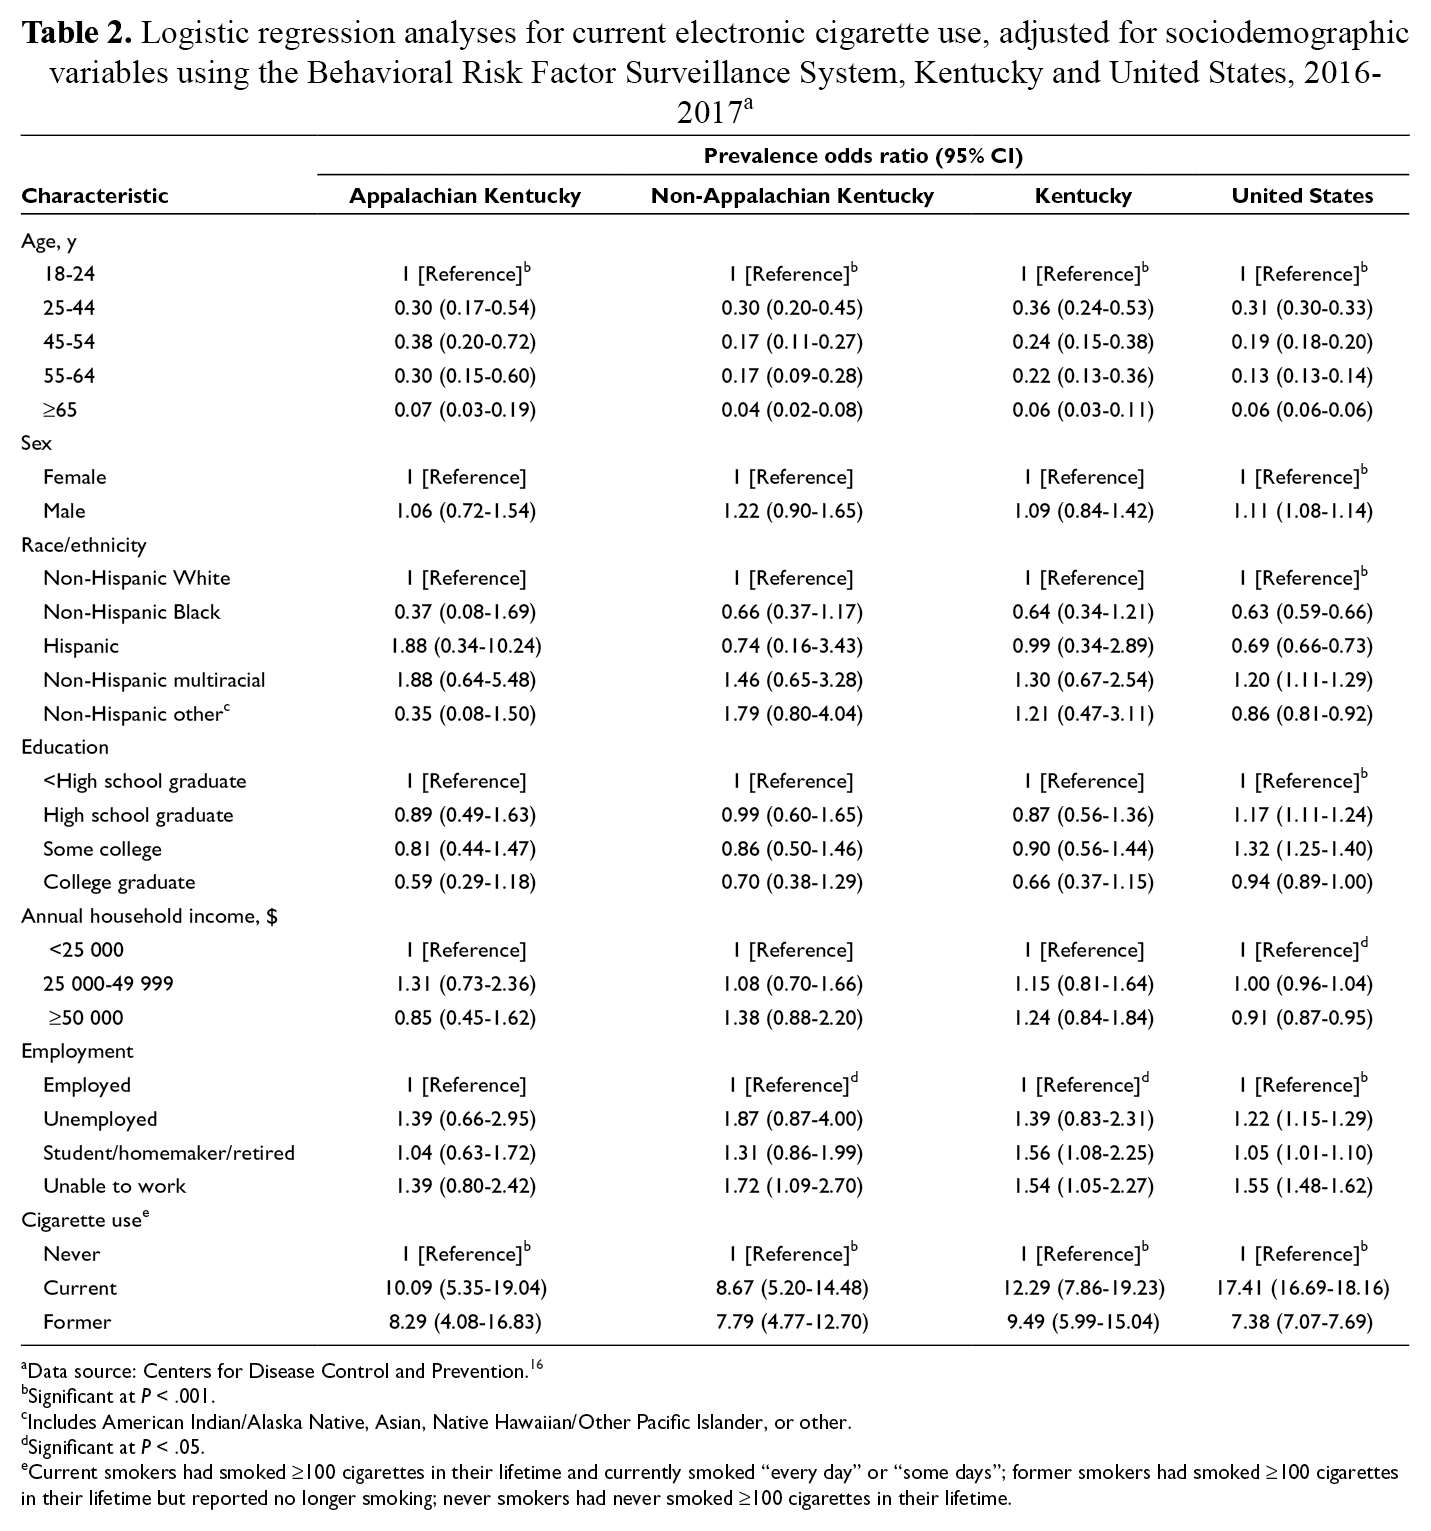
In the multivariable logistic regression models for current e-cigarette use adjusted for age, sex, race/ethnicity, education, annual household income, employment status, and smoking, results for Kentucky, Appalachian Kentucky, non-Appalachian Kentucky, and the United States were overall similar, with a few differences (Table 2). Overall, the prevalence of e-cigarette use in Appalachian and non-Appalachian regions of Kentucky and the United States was significantly higher among younger age groups (vs older age groups), men (vs women), non-Hispanic multiracial respondents (vs other racial/ethnic groups), and current smokers (vs nonsmokers or former smokers). For the United States as a whole, Hispanic respondents had significantly lower adjusted prevalence odds (prevalence odds ratio [POR] = 0.69; 95% CI, 0.66-0.73) of current e-cigarette use than non-Hispanic White respondents did. However, in Kentucky, the adjusted prevalence odds for Hispanic residents (POR = 0.99; 95% CI, 0.34-2.89) were similar to the adjusted prevalence odds for non-Hispanic White residents (the reference group).
Logistic regression analyses for current electronic cigarette use, adjusted for sociodemographic variables using the Behavioral Risk Factor Surveillance System, Kentucky and United States, 2016-2017 a
aData source: Centers for Disease Control and Prevention. 16
bSignificant at P < .001.
cIncludes American Indian/Alaska Native, Asian, Native Hawaiian/Other Pacific Islander, or other.
dSignificant at P < .05.
eCurrent smokers had smoked ≥100 cigarettes in their lifetime and currently smoked “every day” or “some days”; former smokers had smoked ≥100 cigarettes in their lifetime but reported no longer smoking; never smokers had never smoked ≥100 cigarettes in their lifetime.
Another difference in the patterns of current e-cigarette use was by education. For the United States, the highest rates of current e-cigarette use were among respondents who had received a high school diploma, whereas rates of current e-cigarette use were highest among respondents without a high school diploma in Appalachia and non-Appalachia Kentucky. Throughout Kentucky and in the United States, however, the lowest rates of current e-cigarette use were among adults with a college degree. Current smokers in Kentucky had a lower prevalence of current e-cigarette use than current smokers in the United States.
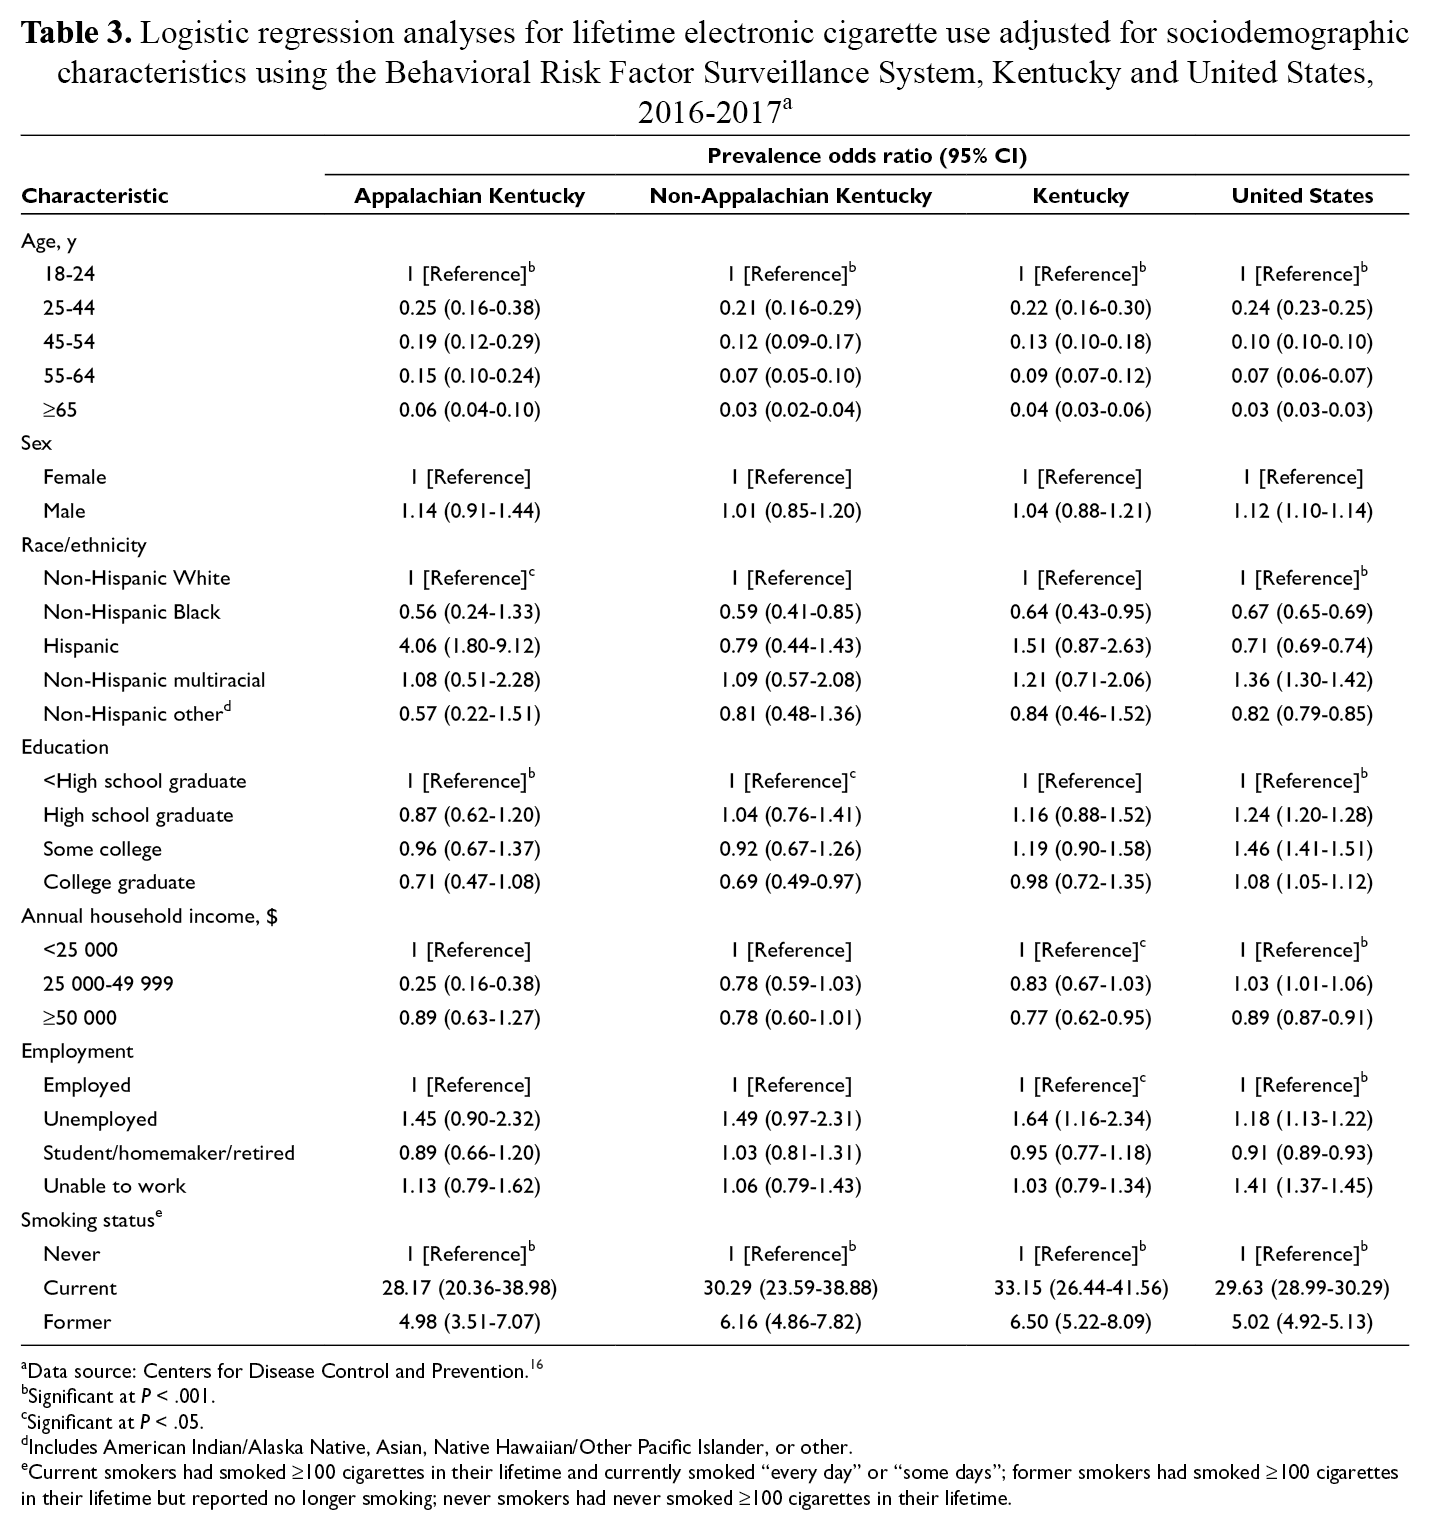
The odds of lifetime e-cigarette use were similar in Kentucky and the United States, with a few differences (Table 3). Hispanic respondents in Kentucky, for example, were no less likely than non-Hispanic White respondents in Kentucky to have ever used e-cigarettes. Nationwide, however, adults identifying as Hispanic had significantly lower adjusted odds (POR = 0.71; 95% CI, 0.69-0.74) of ever having used e-cigarettes. The opposite was true for the multiracial group. Adjusted odds of lifetime e-cigarette use were significantly higher among multiracial people than among non-Hispanic White people in national data, but in Kentucky, the adjusted odds between the 2 groups were similar. We also found differences between both Appalachia and non-Appalachia Kentucky and the United States in lifetime prevalence of e-cigarette use by education level. In Kentucky, the PORs were similar for groups other than respondents with a college degree, who had the lowest lifetime prevalence of e-cigarette use. In the United States, respondents with a high school diploma or some college had the highest rates of current e-cigarette use. Unlike current e-cigarette use, lifetime use was higher among current smokers in Kentucky than in the United States.
Logistic regression analyses for lifetime electronic cigarette use adjusted for sociodemographic characteristics using the Behavioral Risk Factor Surveillance System, Kentucky and United States, 2016-2017 a
aData source: Centers for Disease Control and Prevention. 16
bSignificant at P < .001.
cSignificant at P < .05.
dIncludes American Indian/Alaska Native, Asian, Native Hawaiian/Other Pacific Islander, or other.
eCurrent smokers had smoked ≥100 cigarettes in their lifetime and currently smoked “every day” or “some days”; former smokers had smoked ≥100 cigarettes in their lifetime but reported no longer smoking; never smokers had never smoked ≥100 cigarettes in their lifetime.
Discussion
This study examined factors associated with lifetime and current e-cigarette use in the United States, Kentucky, and a large portion of the Central Appalachian region. Our findings were largely consistent with the findings of previous studies 2,9,32 -34 that found age, employment status, and conventional cigarette use were associated with e-cigarette use. Higher rates of e-cigarette use among young adults (aged 18-24) were expected, given research demonstrating that young adults are more susceptible to targeted marketing than older adults. 35 -37 Studies also indicate that young adults are more likely to perceive e-cigarettes as a safer alternative to traditional cigarettes. 37,38 Furthermore, young adults likely are more aware of and have better access to these products because of social media, celebrity endorsements, and youth culture. 32
Current and lifetime rates of e-cigarette use were higher in Kentucky than in the United States, as expected. Appalachian Kentucky, however, did not have significantly higher lifetime or current prevalence rates of e-cigarette use than the rest of Kentucky. This finding was somewhat surprising, given higher rates of conventional cigarette smoking in Kentucky’s Appalachian region compared with other parts of the state. 39 We note a potentially alarming difference, however: both lifetime and current prevalence rates of e-cigarette use were substantially and significantly higher among Hispanic residents of Appalachian Kentucky than among other Hispanic residents of Kentucky or the United States. This finding could indicate an acute need for culturally appropriate interventions targeted to this small but growing population in Central Appalachia.
It is unclear why relative patterns of both lifetime and current e-cigarette use by educational attainment differed in the United States and Kentucky. In the United States, both current and lifetime prevalence peaked among respondents with moderate levels of education (ie, high school graduates and those with some college), whereas the prevalence in Kentucky decreased as education level increased. Taxes imposed on e-cigarette products in other states, counties, or municipalities may limit their accessibility among people of lesser means. No excise taxes or other special taxes on e-cigarettes exist in Kentucky, nor are any special retail permits or licenses required to sell them, although previous research shows that taxing e-cigarettes could lead to a reduction in e-cigarette use. 40 Flavoring e-cigarettes can increase use, particularly among younger age groups but among older adults as well. Several studies found that young users preferred flavored products and cited flavor as a reason for experimentation. 41 -43 No legislation in Kentucky prohibits flavored e-cigarettes.
In addition to the introduction of taxes on e-cigarette products, policy recommendations from the American Heart Association support the inclusion of e-cigarettes under smoke-free laws, state regulations that prohibit access for minors, and restrictions on advertising and marketing to minors. 8 In Kentucky, as of January 2020, only 37 communities (ie, counties or cities) had comprehensive smoke-free ordinances, 8 and only 28 of these include e-cigarettes. Only an executive order prohibits use on all properties owned or operated by the executive branch of government, including many offices, health care facilities, state parks, and highway rest areas. 44
Overall, the current and lifetime e-cigarette use rates we observed were higher than rates reported by researchers who analyzed other datasets. A study of data from the National Health Interview Survey (NHIS) reported that lifetime e-cigarette use among US adults increased from 12.6% to 15.3% during 2014-2016, but current e-cigarette use decreased from 3.7% to 3.2% during the same period. 45 Regardless of the trends noted in that study, the rates were considerably lower than the rates we observed for either Kentucky (27.0% and 5.8%, respectively) or the United States (20.4% and 4.4%), especially with regard to lifetime use. Much of this difference could be attributed to the later period of data collection for our study—2016-2017 BRFSS data versus 2014-2016 NHIS data—given the rapid increase in use of these tobacco products. It is unclear, however, what other factors might account for this discrepancy, especially considering that both the NHIS and BRFSS survey responses are weighted to the population.
Limitations
This study had several limitations. First, the survey responses were self-reported, which could underestimate or overestimate our findings; however, self-reported BRFSS data have been validated. 46 Second, we used median BRFSS prevalence estimates from states and territories to provide a national comparison for lifetime and current e-cigarette use. We used this approach because the national BRFSS dataset is actually a collection of survey responses weighted to reflect the populations of individual states and territories, rather than the nation. Other approaches could yield more accurate estimates but were outside the scope of our analysis. Third, we were unable to assess trends in e-cigarette use in Appalachia, but outside Kentucky’s portion of Central Appalachia, because of the lack of county information in the national dataset. Still, the use of BRFSS is a strength of this study, and the findings for Kentucky are generalizable to adults in that state.
Conclusion
The prevalence of current e-cigarette use was higher in Kentucky than in a sample of the US population. Kentucky’s Appalachian region had rates of lifetime and current e-cigarette use that were similar to the rates in the rest of the state, except for Hispanic Appalachian residents, who had significantly higher lifetime prevalence rates. After adjustment for demographic and socioeconomic factors, the prevalence odds of current e-cigarette use among young adults aged 18-24 were much higher in Kentucky than in the United States, despite similar odds of lifetime use. These findings underscore the need to implement policies that discourage initiation of e-cigarette use in all regions of Kentucky, especially among young people.
Footnotes
Acknowledgments
The authors acknowledge the efforts of Sarojini Kanotra, PhD, MPH, and the Kentucky BRFSS Program, Kentucky Cabinet for Health and Family Services. Furthermore, the authors appreciate the work of anonymous reviewers who contributed insightful comments that helped to improve this article.
Declaration of Conflicting Interests
The authors declared no potential conflicts of interest with respect to the research, authorship, and/or publication of this article.
Funding
The authors disclosed receipt of the following financial support for the research, authorship, and/or publication of this article: This project was funded by a grant from the Foundation for a Healthy Kentucky. The Foundation’s mission is to address the unmet health care needs of Kentucky, by developing and influencing health policy, improving access to care, reducing health risks and disparities, and promoting health equity.