
Abstract
Objectives
Immigrant adults tend to have better health than native-born adults despite lower incomes, but the health advantage decreases with length of residence. To determine whether immigrant adults have a health advantage over US-born adults in New York City, we compared cardiovascular disease (CVD) risk factors among both groups.
Methods
Using data from the New York City Health and Nutrition Examination Survey 2013-2014, we assessed health insurance coverage, health behaviors, and health conditions, comparing adults ages ≥20 born in the 50 states or the District of Columbia (US-born) with adults born in a US territory or outside the United States (immigrants, following the National Health and Nutrition Examination Survey) and comparing US-born adults with (1) adults who immigrated recently (≤10 years) and (2) adults who immigrated earlier (>10 years).
Results
For immigrant adults, the mean time since arrival in the United States was 21.8 years. Immigrant adults were significantly more likely than US-born adults to lack health insurance (22% vs 12%), report fair or poor health (26% vs 17%), have hypertension (30% vs 23%), and have diabetes (20% vs 11%) but significantly less likely to smoke (18% vs 27%) (all P < .05). Comparable proportions of immigrant adults and US-born adults were overweight or obese (67% vs 63%) and reported CVD (both 7%). Immigrant adults who arrived recently were less likely than immigrant adults who arrived earlier to have diabetes or high cholesterol but did not differ overall from US-born adults.
Conclusions
Our findings may help guide prevention programs and policy efforts to ensure that immigrant adults remain healthy.
Immigrants to the United States have lower mortality and report better health than people born in the United States, despite having lower incomes and less wealth, 1 -5 a phenomenon known as the immigrant health advantage. Some researchers ask whether the advantage results, in part, from relying on self-report; many immigrants lack health insurance and, thus, are unaware of asymptomatic conditions such as hypertension. 6 Other researchers ask whether the advantage is a statistical anomaly; immigrants who return to their birth countries after retirement or when seriously ill are not counted in US mortality statistics. 7,8 Some researchers question whether the advantage relies on low smoking prevalence among immigrant adults and, therefore, lower respiratory and cardiovascular disease (CVD) prevalence and fewer premature deaths than among US-born adults. 9,10 The health advantage decreases over time: immigrant adults with many years of residence in the United States have worse health than adults who immigrated recently. 1,5,11 -15
New York City has a large, diverse immigrant population. In 2015, 3.4 million New York City residents were born outside the United States or in a US territory (hereinafter, immigrants), and 90% of non–US-born residents had entered the United States before 2010; 51% were from Latin America and 28% were from Asia. 16 People from the Dominican Republic constituted New York City’s largest immigrant group in 2015, with large numbers also from China, Mexico, and South Asia. 17 Compared with US-born adults, immigrant adults in New York City had a lower prevalence of obesity, asthma, smoking, and hypertension and a higher prevalence of diabetes. 18 -21
We compared CVD risks of territory-born and non–US-born adults living in New York City with CVD risks of adults born in the 50 states or the District of Columbia (hereinafter, US-born adults). We used data from the population-representative New York City Health and Nutrition Examination Survey (NYC HANES) 2013-2014. 22,23 We also compared the CVD risk prevalence among New York City immigrant adults who had ≤10 years of residence in the 50 states or the District of Columbia with immigrant adults who had >10 years of residence and with US-born adults.
Methods
NYC HANES 2013-2014 is described elsewhere. 22,23 Briefly, NYC HANES used address-based, 3-stage cluster sampling to select noninstitutionalized New York City residents ages ≥20. Interviewers spoke English, Spanish, Russian, Mandarin Chinese, and Cantonese, and they used telephone translation or asked participants’ friends or family to translate other languages (82% of surveys were completed in participants’ homes). Survey protocols were approved by institutional review boards of the New York City Department of Health and Mental Hygiene, City University of New York School of Public Health, and RTI International. Participants provided written informed consent. Data were collected from August 2013 through June 2014. Participants completed a computer-assisted personal interview; had height, weight, and blood pressure measured; and provided blood samples. A total of 1527 people completed the survey, for a response rate of 36%.
The collection and processing of blood samples are described elsewhere. 22 The University of Minnesota analyzed samples for glucose, glycated hemoglobin A1c (HbA1c), and total cholesterol, using National Health and Nutrition Examination Survey (NHANES) 2011-2012 procedures. 24 -26 The New York State Health Department’s Wadsworth Laboratory analyzed samples for cotinine. 27
Participants were asked, “In what country were you born?” We categorized participants as US-born if they were born in 1 of the 50 states or the District of Columbia (n = 787) or as immigrants if they were born outside the United States or in a US territory (n = 732), using the categorization of NHANES.
A sensitivity analysis compared non–US-born NYC HANES participants (n = 668) with participants born in US territories, the 50 states, or the District of Columbia (n = 851) to assess whether different categorization would change our findings.
Non–US-born and territory-born adults were asked, “In what month and year did you come to the United States to stay?” We subtracted the arrival year from the interview year to obtain length of US residence. We categorized participants who resided in the United States for ≤10 years as recent immigrants (n = 196) or >10 years as earlier immigrants (n = 518) (among non–US-born participants only: recent, n = 191; earlier, n = 466). We also categorized non–US-born and territory-born adults by US residence for ≤5 years (n = 99) and >5 years (n = 615), and we categorized participants by both immigration and self-reported race/ethnicity.
We analyzed responses to questions about sex, age, race, Latino ethnicity, language of interview, marital status, education, current employment, and annual household income. We defined neighborhood income as percentage in a census tract with annual household income <100% of the federal poverty threshold using American Community Survey (ACS) 2008-2012 estimates. 28
Participants were asked about health care access, including health insurance. We asked participants who had a past-year visit with a health professional whether the visit was for primary care. All participants were asked: “[Within the past year] . . . was there a time when you needed health care, but did not get it?” (yes/no).
Participants rated their physical health and mental health as excellent, very good, good, fair, or poor. We recoded responses about physical activity as met Healthy People 2010 (HP 2010) guidelines for moderate or vigorous activity 29 ; some activity but less than HP 2010 guidelines; or no moderate or vigorous activity. NYC HANES included the ENRICHD Social Support Inventory, 5 questions derived from well-validated social support scales 30,31 ; we categorized responses as high or low social support.
We assessed diabetes and hypertension using both participant response and objective measurement. We defined diabetes as responding yes to: “Other than during pregnancy, have you ever been told by a doctor or health professional that you have diabetes or sugar diabetes?” or, among participants who answered no, as HbA1c ≥6.5% or fasting glucose ≥126 mg/dL. Self-reported diabetes was defined as responding yes. We defined hypertension as self-report of current antihypertensive medication or, among adults not using medications, as measured and calibrated 32 systolic blood pressure ≥140 mm Hg or diastolic blood pressure ≥90 mm Hg. Self-reported hypertension was defined as current use of antihypertensive medication. We also assessed diabetes and hypertension using only laboratory or blood pressure measurements.
We defined hypercholesterolemia as self-report of current cholesterol-lowering medication or, among participants not using medications, as total cholesterol ≥240 mg/dL. We calculated body mass index (BMI) using measured height and weight as kilograms per meter squared (kg/m2).
CVD was defined as self-report of diagnosed heart failure, coronary heart disease, angina, myocardial infarction, or stroke. Smoking and secondhand smoke (SHS) exposure were defined by serum cotinine: >10.0 ng/mL indicated current smokers, 0.05-10.0 ng/mL indicated nonsmokers exposed to SHS, and <0.05 ng/mL indicated nonsmokers not exposed to SHS. 33
We used SAS Enterprise Guide version 7.1 (SAS Institute, Inc) and SUDAAN version 11.0.1 (RTI International) for analyses. NYC HANES analysts had weighted survey data to the 2013 New York City population, approximating marginal population counts by age, sex, race/ethnicity, education, borough, and marital status from ACS 2013. For each prevalence analysis, we further adjusted weighting for item nonresponse by age, sex, and race/ethnicity so that estimates represented the percentage of the New York City adult household population. We calculated age-adjusted estimates using the US standard 2000 population. We used t tests to determine significance at α = .05.
Results
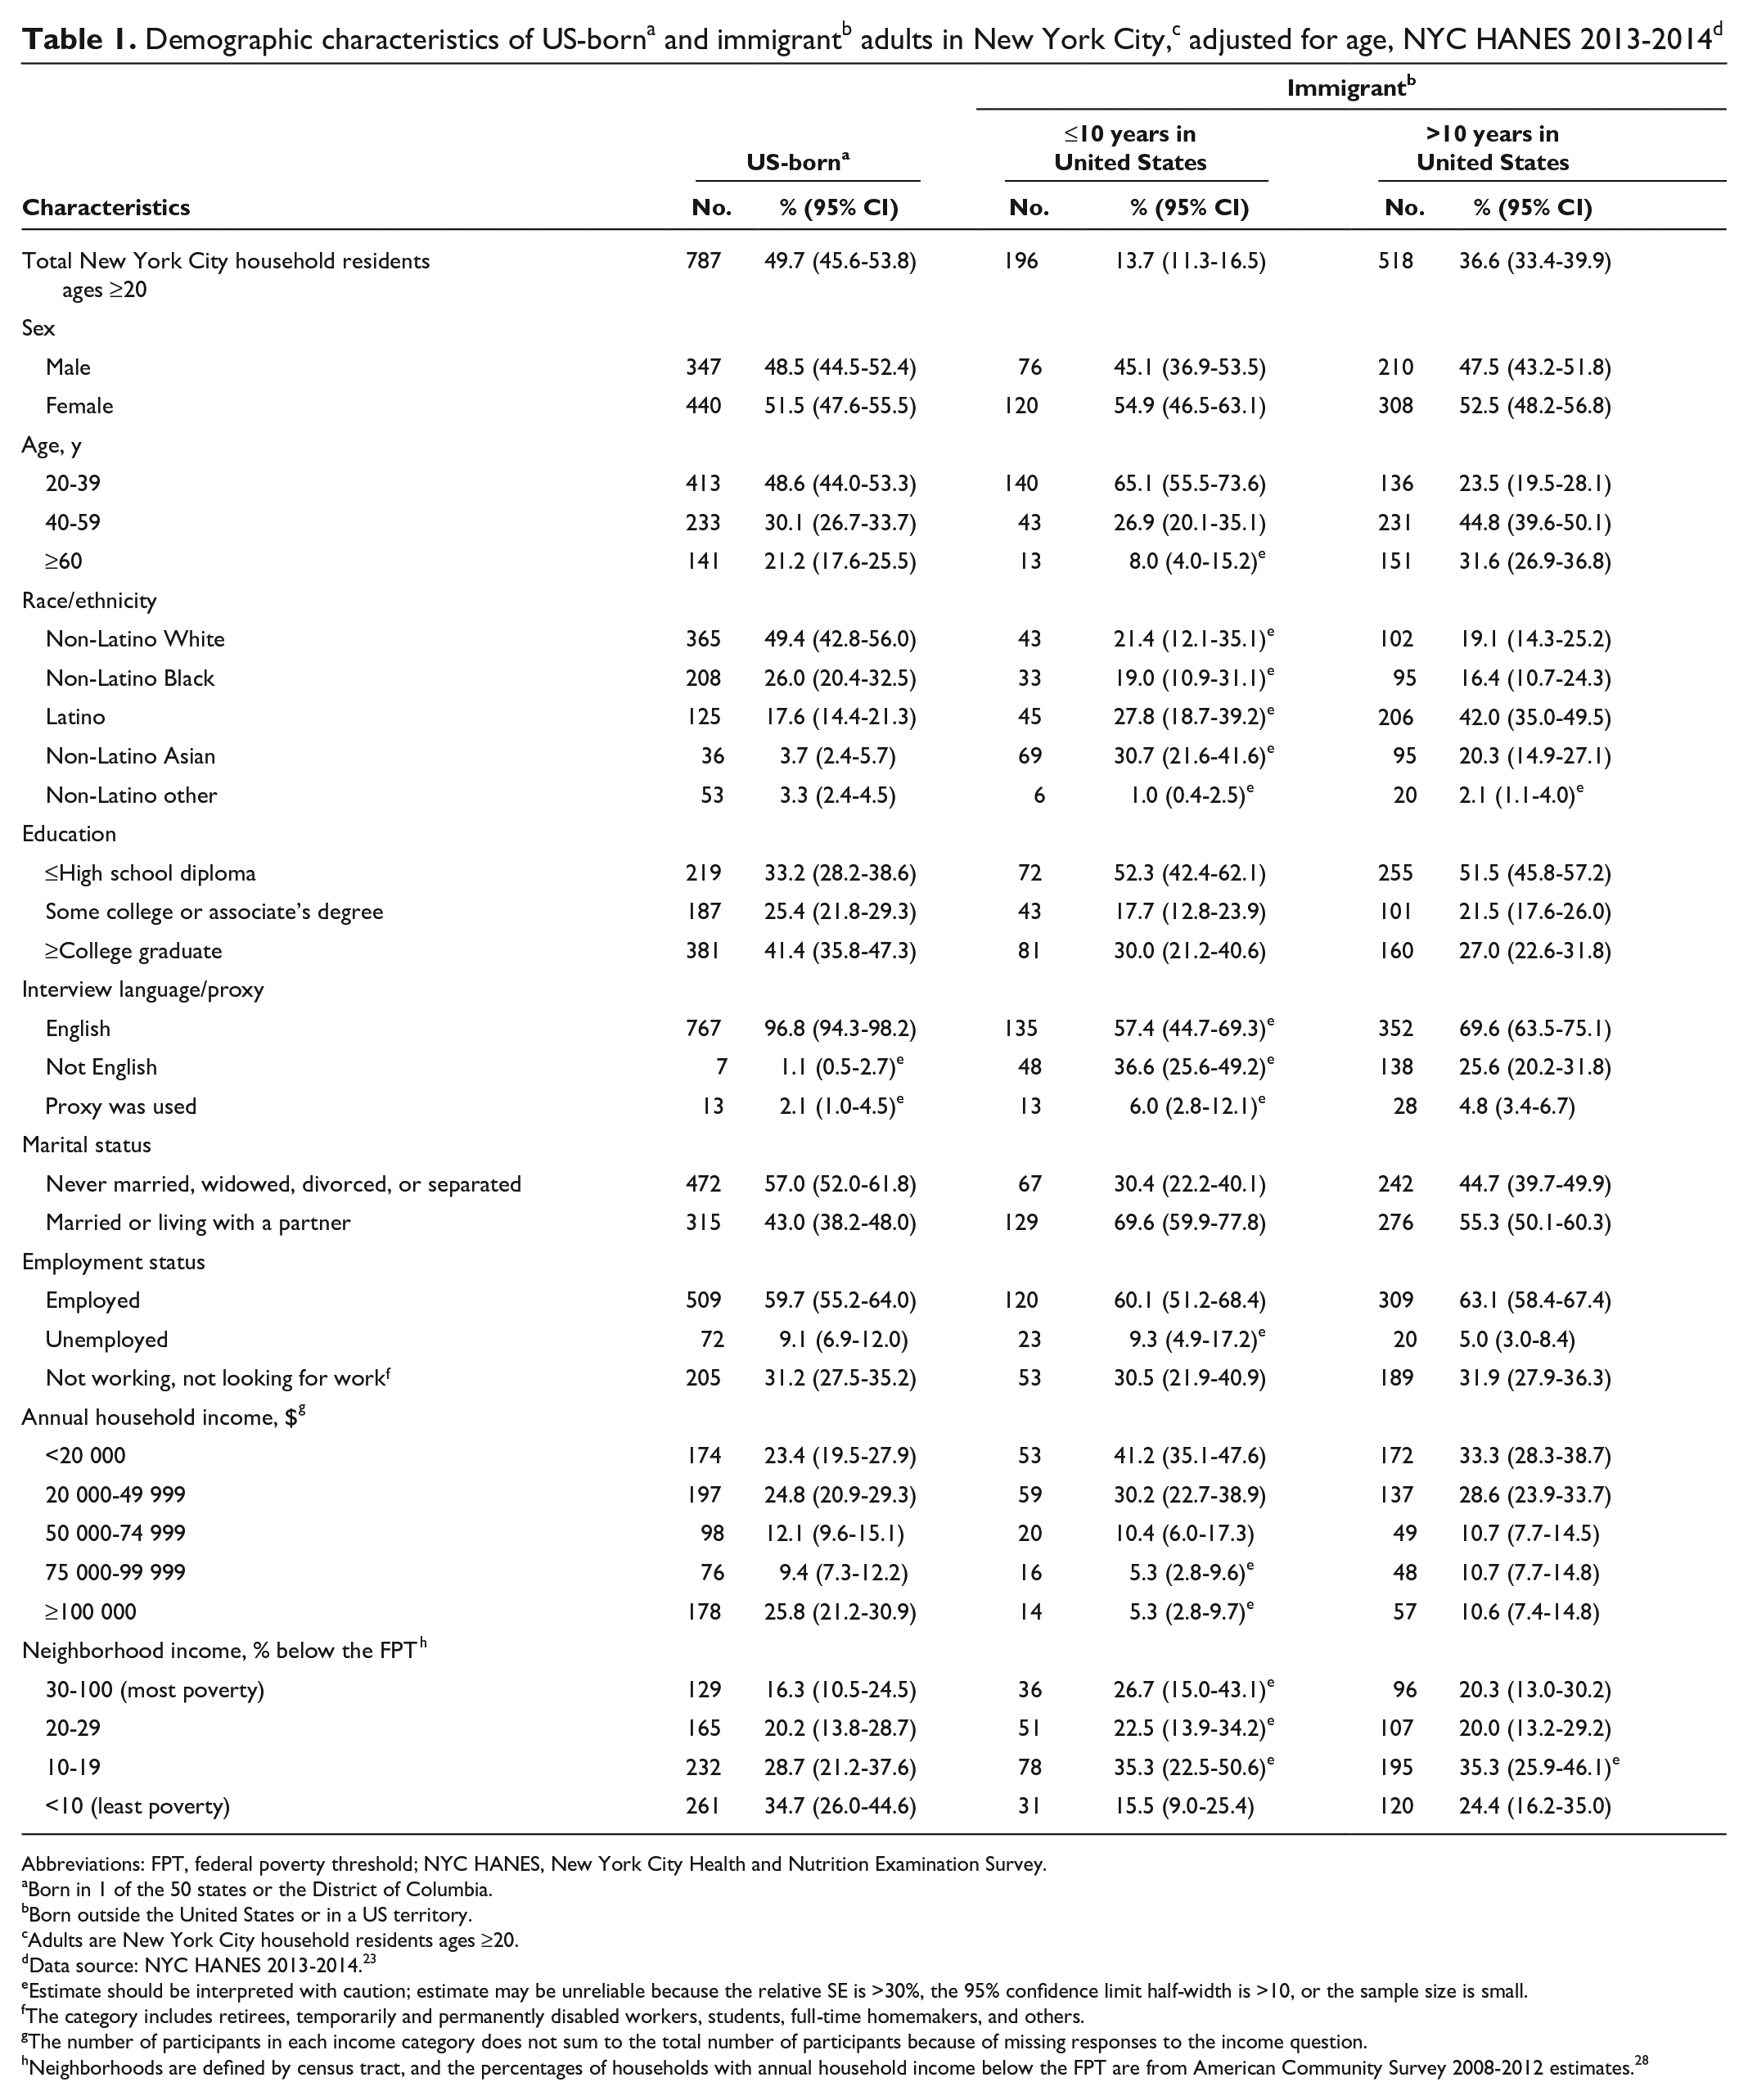
In New York City, immigrant adults were significantly more likely than US-born adults to be ages 40-59 (39.8% vs 30.1%), of Latino (35.9% vs 17.6%) or Asian (24.4% vs 3.7%) ethnicity, and married or living with a partner (59.8% vs 43.0%), and to have ≤high school education (51.1% vs 33.2%) and an annual household income <$20 000 (34.1% vs 23.4%) (all P < .01) (Table 1). For immigrant adults, the median time since arrival in the United States was 17.9 (95% CI, 15.5-20.1) years and the mean was 21.8 (95% CI, 20.1-23.5) years.
Abbreviations: FPT, federal poverty threshold; NYC HANES, New York City Health and Nutrition Examination Survey.
aBorn in 1 of the 50 states or the District of Columbia.
bBorn outside the United States or in a US territory.
cAdults are New York City household residents ages ≥20.
dData source: NYC HANES 2013-2014. 23
eEstimate should be interpreted with caution; estimate may be unreliable because the relative SE is >30%, the 95% confidence limit half-width is >10, or the sample size is small.
fThe category includes retirees, temporarily and permanently disabled workers, students, full-time homemakers, and others.
gThe number of participants in each income category does not sum to the total number of participants because of missing responses to the income question.
hNeighborhoods are defined by census tract, and the percentages of households with annual household income below the FPT are from American Community Survey 2008-2012 estimates. 28
Compared with US-born adults, immigrant adults in New York City had a significantly higher prevalence of hypertension (30.4% vs 23.4%; P = .03), diabetes (20.0% vs 11.4%; P < .001), and lack of physical activity (39.8% vs 23.2%; P < .001); a similar prevalence of high cholesterol (25.3% vs 24.6%), BMI ≥25 kg/m2 (66.7% vs 62.8%), and CVD diagnosis (6.8% vs 6.9%); and a significantly lower prevalence of smoking (17.9% vs 26.5%; P = .01) (Figure).
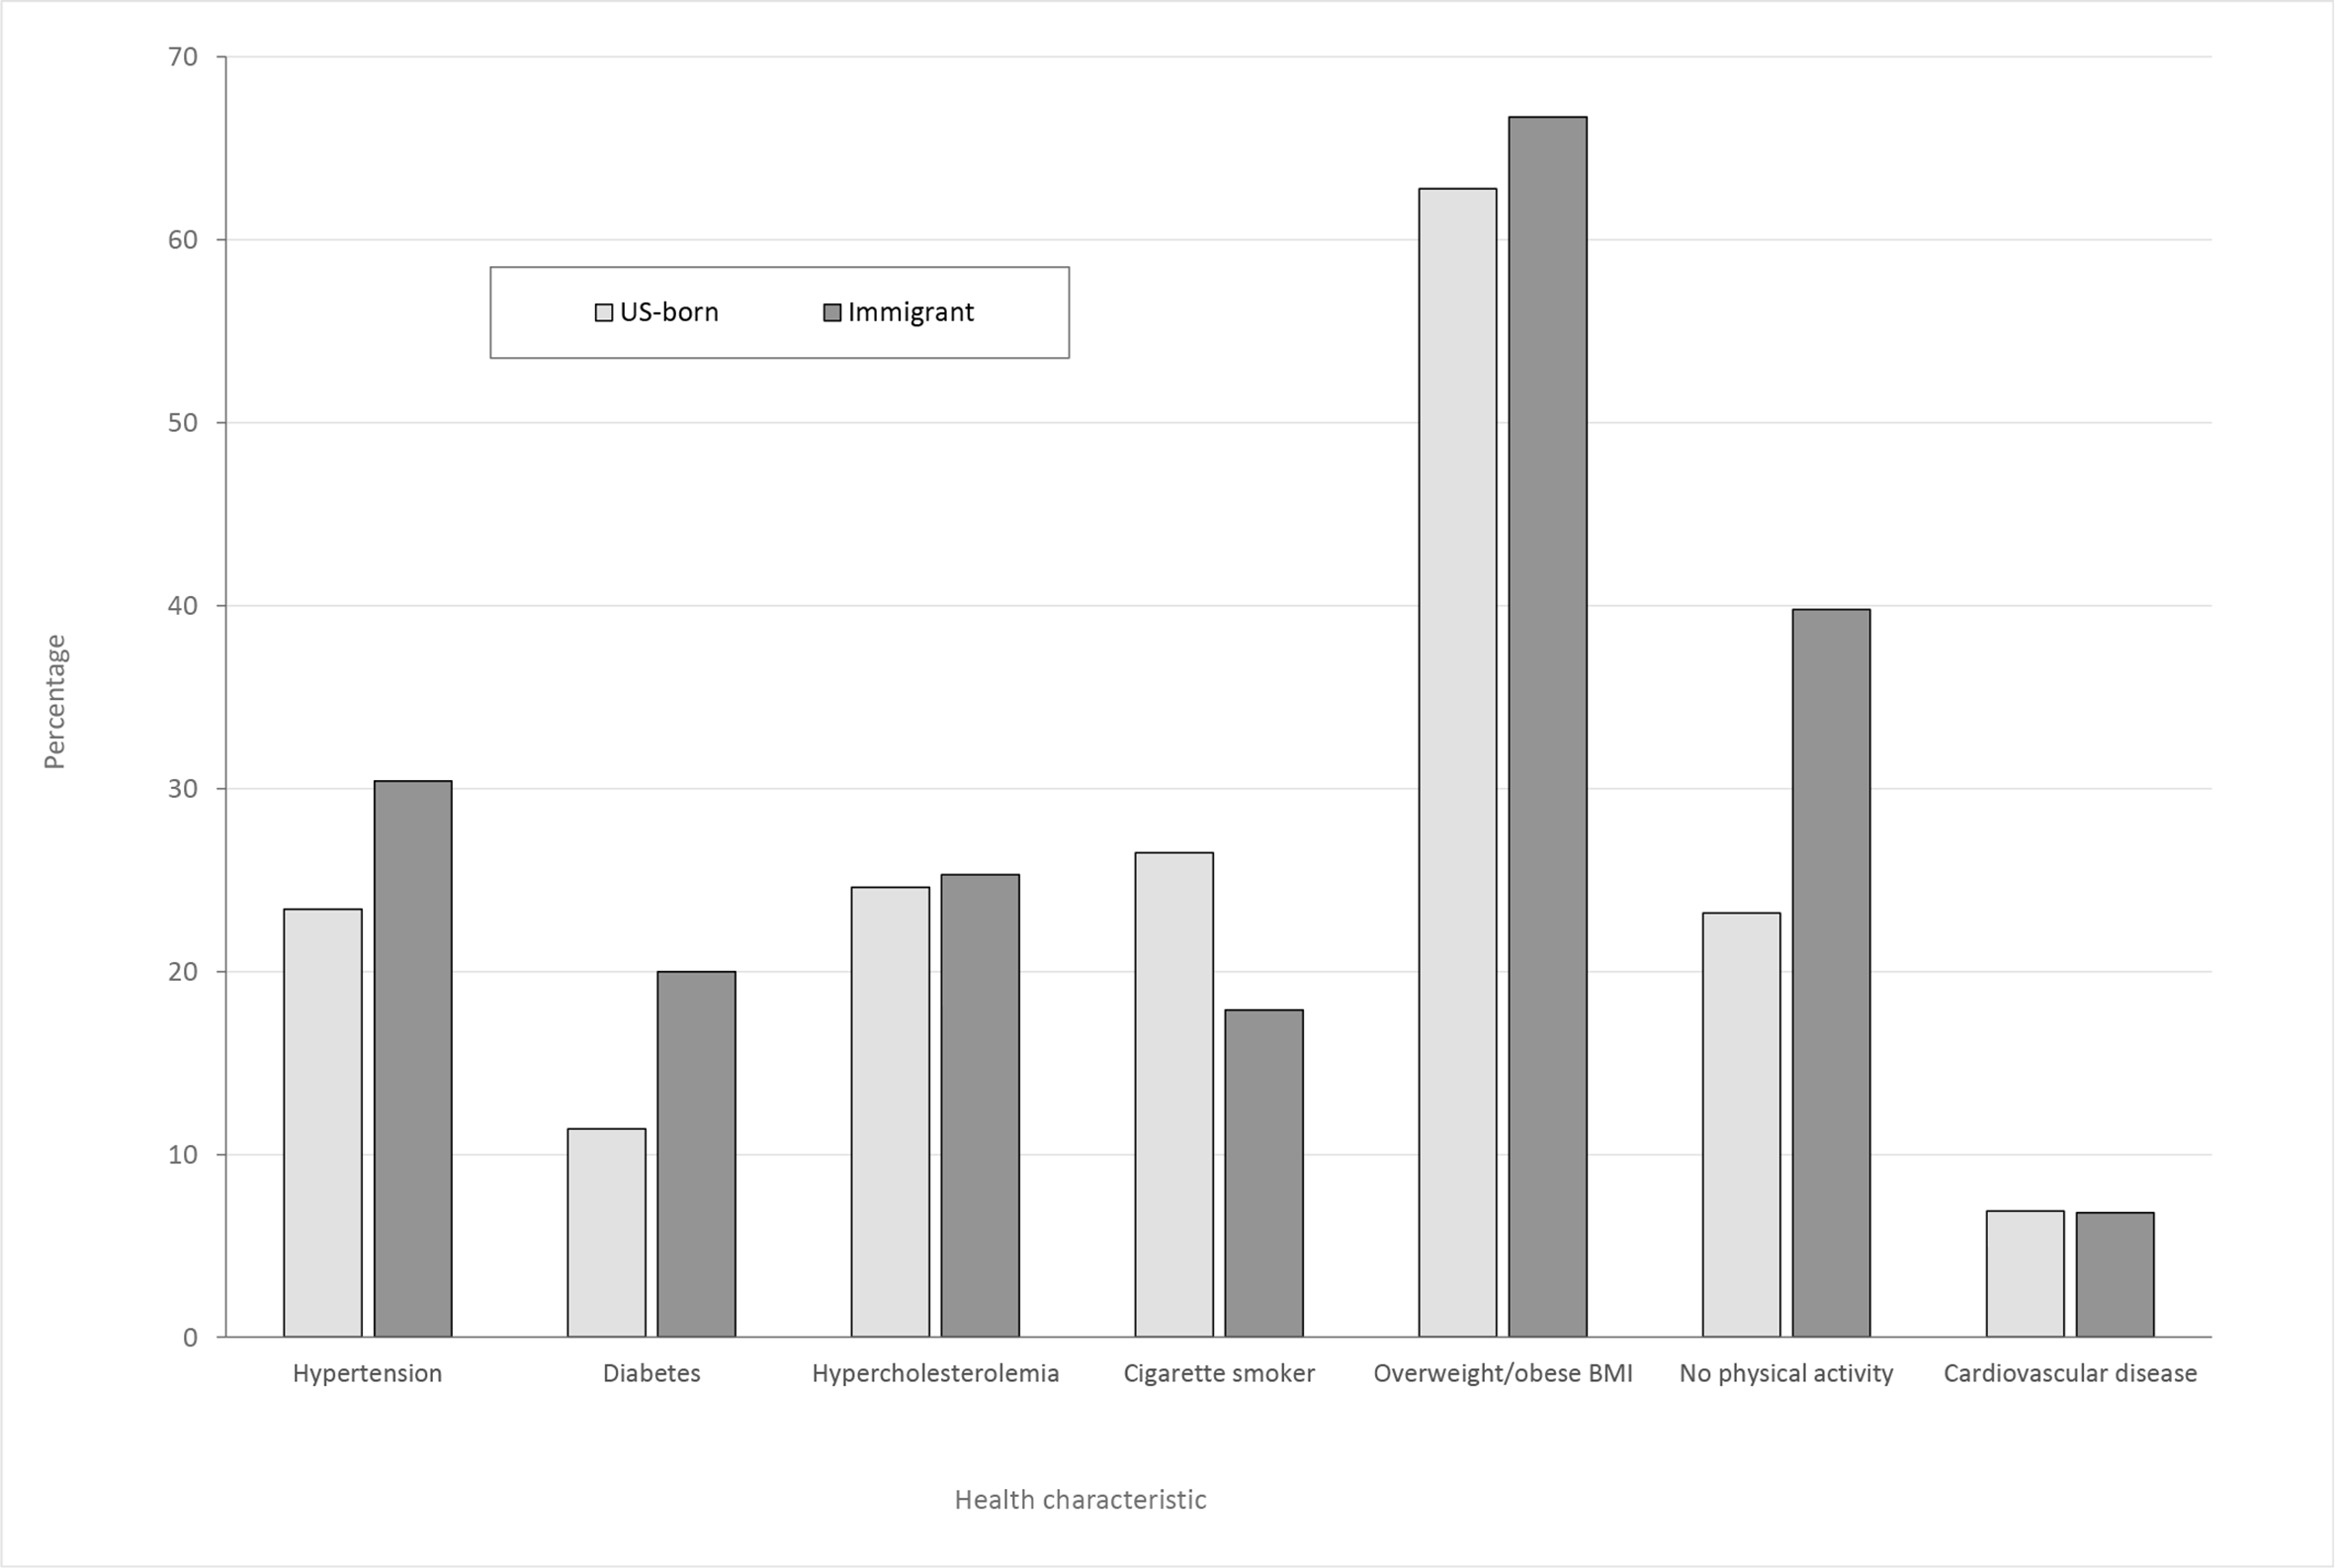
Prevalence of cardiovascular disease (CVD) and risk factors among US-born and immigrant New York City adults, adjusted for age, New York City Health and Nutrition Examination Survey (NYC HANES) 2013-2014. US-born refers to people born in 1 of the 50 states or the District of Columbia. Immigrant refers to people born in a US territory or outside the United States. Adults are household residents ages ≥20. The differences between the 2 populations in hypertension, diabetes, cigarette smoking, and no physical activity were significant at P < .05, using t tests for significance. Abbreviation: BMI, body mass index. Data source: NYC HANES 2013-2014. 23
Among study participants with diabetes, 16% of US-born adults and 19% of immigrant adults were categorized based on laboratory measurement only. Among study participants with hypertension, 28% of US-born adults and 20% of immigrant adults were categorized based on blood pressure only.
We compared the citywide prevalence of self-reported conditions: immigrant adults were significantly more likely than US-born adults to report diabetes (13% vs 8%; P < .001) and equally likely to report hypertension (31% vs 28%; P = .20).
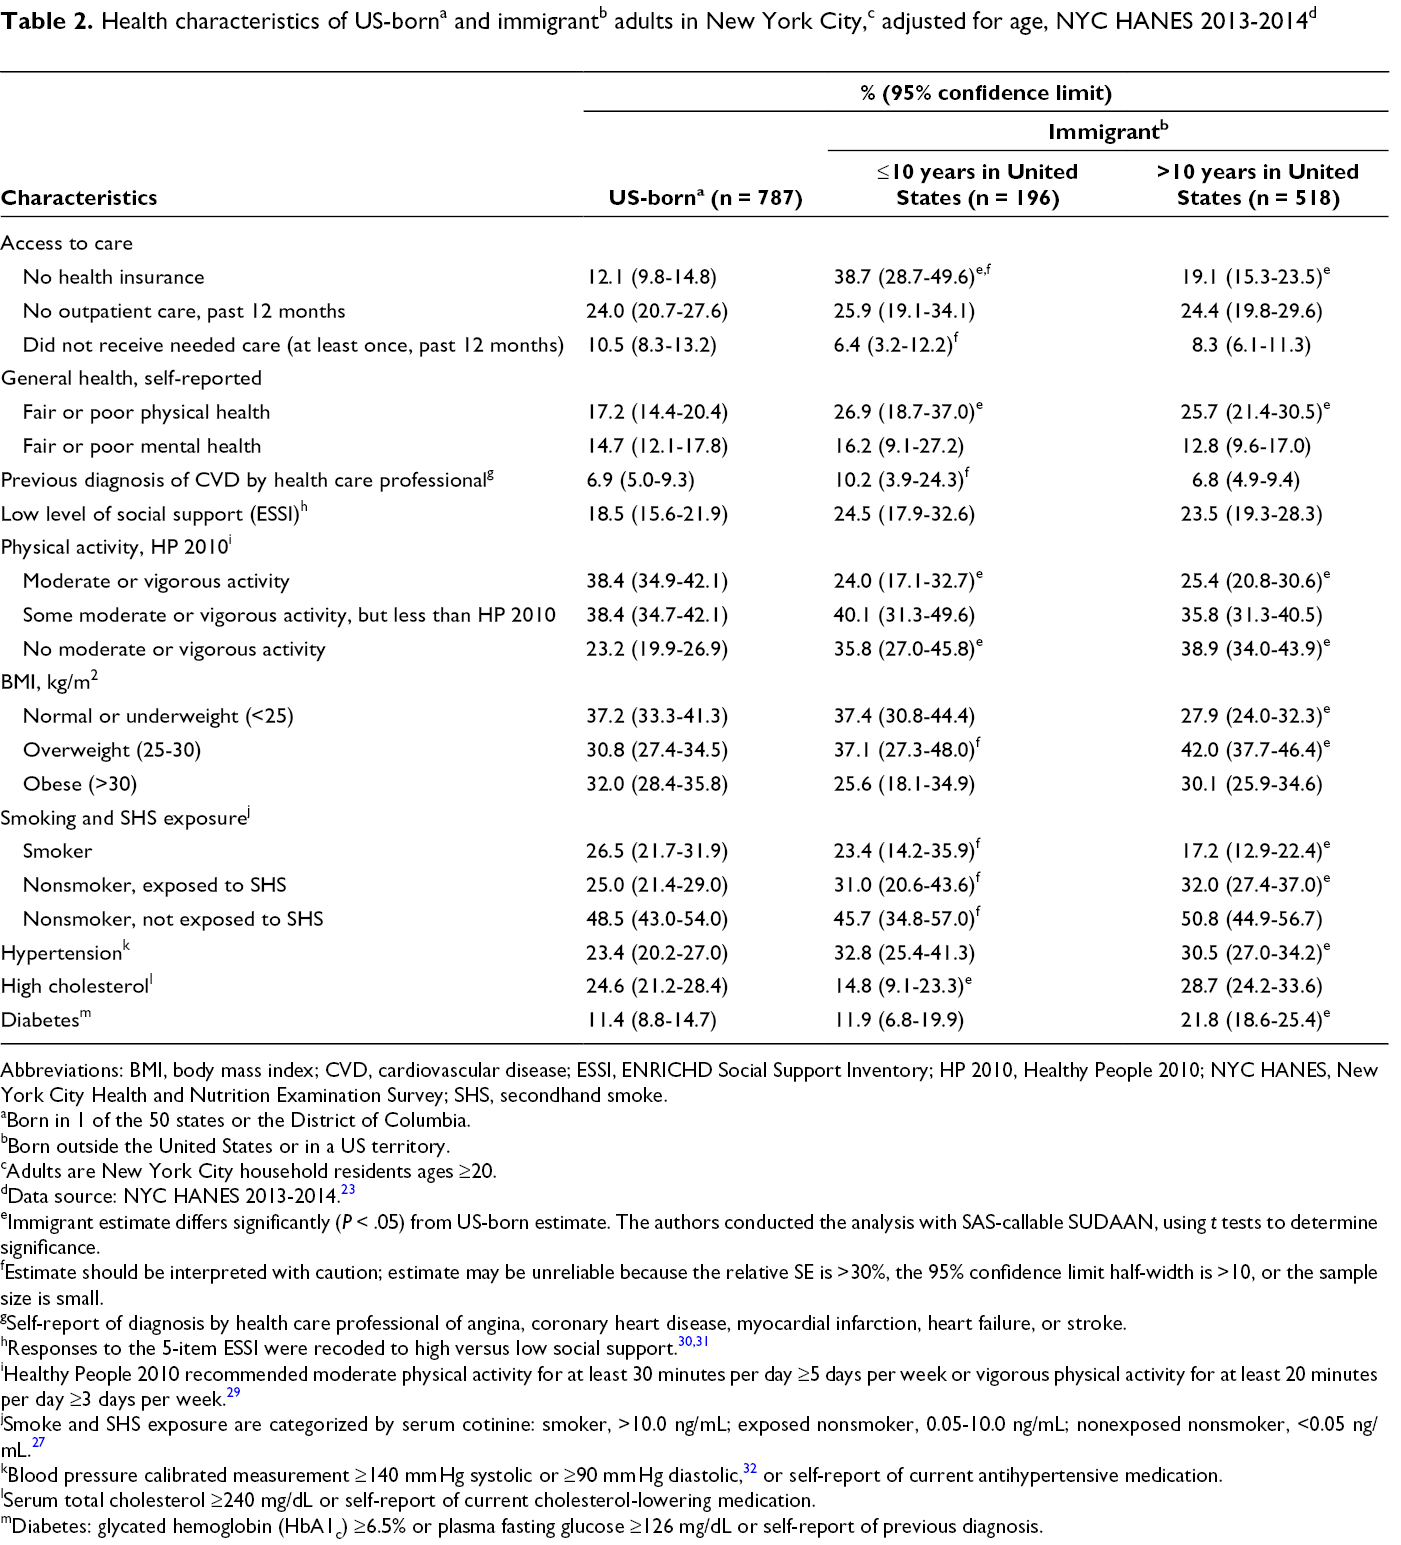
A significantly higher proportion of immigrant adults than US-born adults had no health insurance in 2013-2014 (22.4% vs 12.1%; P < .001), but similar proportions of immigrant and US-born adults used primary care (75.3% vs 76.0%; P = .76) and could obtain health care when needed (92.0% vs 89.5%; P = .14) (Table 2).
Abbreviations: BMI, body mass index; CVD, cardiovascular disease; ESSI, ENRICHD Social Support Inventory; HP 2010, Healthy People 2010; NYC HANES, New York City Health and Nutrition Examination Survey; SHS, secondhand smoke.
aBorn in 1 of the 50 states or the District of Columbia.
bBorn outside the United States or in a US territory.
cAdults are New York City household residents ages ≥20.
dData source: NYC HANES 2013-2014. 23
eImmigrant estimate differs significantly (P < .05) from US-born estimate. The authors conducted the analysis with SAS-callable SUDAAN, using t tests to determine significance.
fEstimate should be interpreted with caution; estimate may be unreliable because the relative SE is >30%, the 95% confidence limit half-width is >10, or the sample size is small.
gSelf-report of diagnosis by health care professional of angina, coronary heart disease, myocardial infarction, heart failure, or stroke.
iHealthy People 2010 recommended moderate physical activity for at least 30 minutes per day ≥5 days per week or vigorous physical activity for at least 20 minutes per day ≥3 days per week. 29
jSmoke and SHS exposure are categorized by serum cotinine: smoker, >10.0 ng/mL; exposed nonsmoker, 0.05-10.0 ng/mL; nonexposed nonsmoker, <0.05 ng/mL. 27
kBlood pressure calibrated measurement ≥140 mm Hg systolic or ≥90 mm Hg diastolic, 32 or self-report of current antihypertensive medication.
lSerum total cholesterol ≥240 mg/dL or self-report of current cholesterol-lowering medication.
mDiabetes: glycated hemoglobin (HbA1c) ≥6.5% or plasma fasting glucose ≥126 mg/dL or self-report of previous diagnosis.
Recent immigrant adults were more likely than US-born adults to be young (ages 20-39: 65.1% vs 48.6%; P = .002), non-Latino Asian (30.7% vs 3.7%; P < .001), and married or living with a partner (69.6% vs 43.0%; P < .001), and to have ≤high school diploma (52.3% vs 33.2%; P < .001) and annual household income <$20 000 (41.2% vs 23.4%; P < .001); and less likely to live in a high-income neighborhood (15.5% vs 34.7%; P < .001) (Table 1).
Compared with US-born adults, recent immigrant adults were more likely to report fair or poor physical health (26.9% vs 17.2%; P = .04), report no moderate or vigorous physical activity (35.8% vs 23.2%; P = .02), and have hypertension (32.8% vs 23.4%; P = .02); and similarly likely to report fair or poor mental health (16.2% vs 14.7%; P = .75) or low social support (24.5% vs 18.5%; P = .15), have diabetes (11.9% vs 11.4%; P = .89), and be current smokers (23.4% vs 26.5%; P = .60) (Table 2). We found similar patterns when comparing New York City residents who immigrated in the past 5 years with US-born residents.
Adults who immigrated >10 years earlier were significantly more likely than US-born adults to be older (ages 40-59: 44.8% vs 30.1% [P < .001]; age ≥60: 31.6% vs 21.2% [P = .001]), Latino (42.0% vs 17.6%; P < .001) or non-Latino Asian (20.3% vs 3.7%; P < .001), and married or living with a partner (55.3% vs 43.0%; P = .001); to have ≤high school diploma (51.5% vs 33.2%; P < .001) or annual household income <$20 000 (33.3% vs 23.4%; P = .001); and were less likely to live in a high-income neighborhood (24.4% vs 34.7%; P = .03) (Table 1).
Earlier immigrant adults were significantly more likely than US-born adults to report fair or poor physical health (25.7% vs 17.2%; P = .002), be overweight (42.0% vs 30.8%; P < .001), report no moderate or vigorous physical activity (38.9% vs 23.2%; P < .001), have hypertension (30.5% vs 23.4%; P = .03) or diabetes (21.8% vs 11.4%; P < .001), and be exposed to SHS (32.0% vs 25.0%; P = .02); similarly likely to have high cholesterol (28.7% vs 24.6%; P = .16) and report fair or poor mental health (12.8% vs 14.7%; P = .36); and less likely to smoke (17.2% vs 26.5%; P = .01) (Table 2).
In our sensitivity analysis comparing adults born outside the United States with adults born in Puerto Rico, other US territories, the 50 states, or the District of Columbia, the median length of time since arrival in the United States was 16.7 (95% CI, 14.8-18.7) years and the mean was 20.6 (95% CI, 18.8-22.3) years. Results were similar to previous results in all but 2 categories. Adults born in Puerto Rico, other US territories, the 50 states, or the District of Columbia and adults with >10 years of US residence were similarly likely to report fair or poor physical health (20% vs 26%; P = .20), and adults born in US territories, the 50 states, or the District of Columbia were significantly more likely than immigrant adults with ≤10 years of US residence to report fair or poor mental health (16% vs 11%; P = .02).
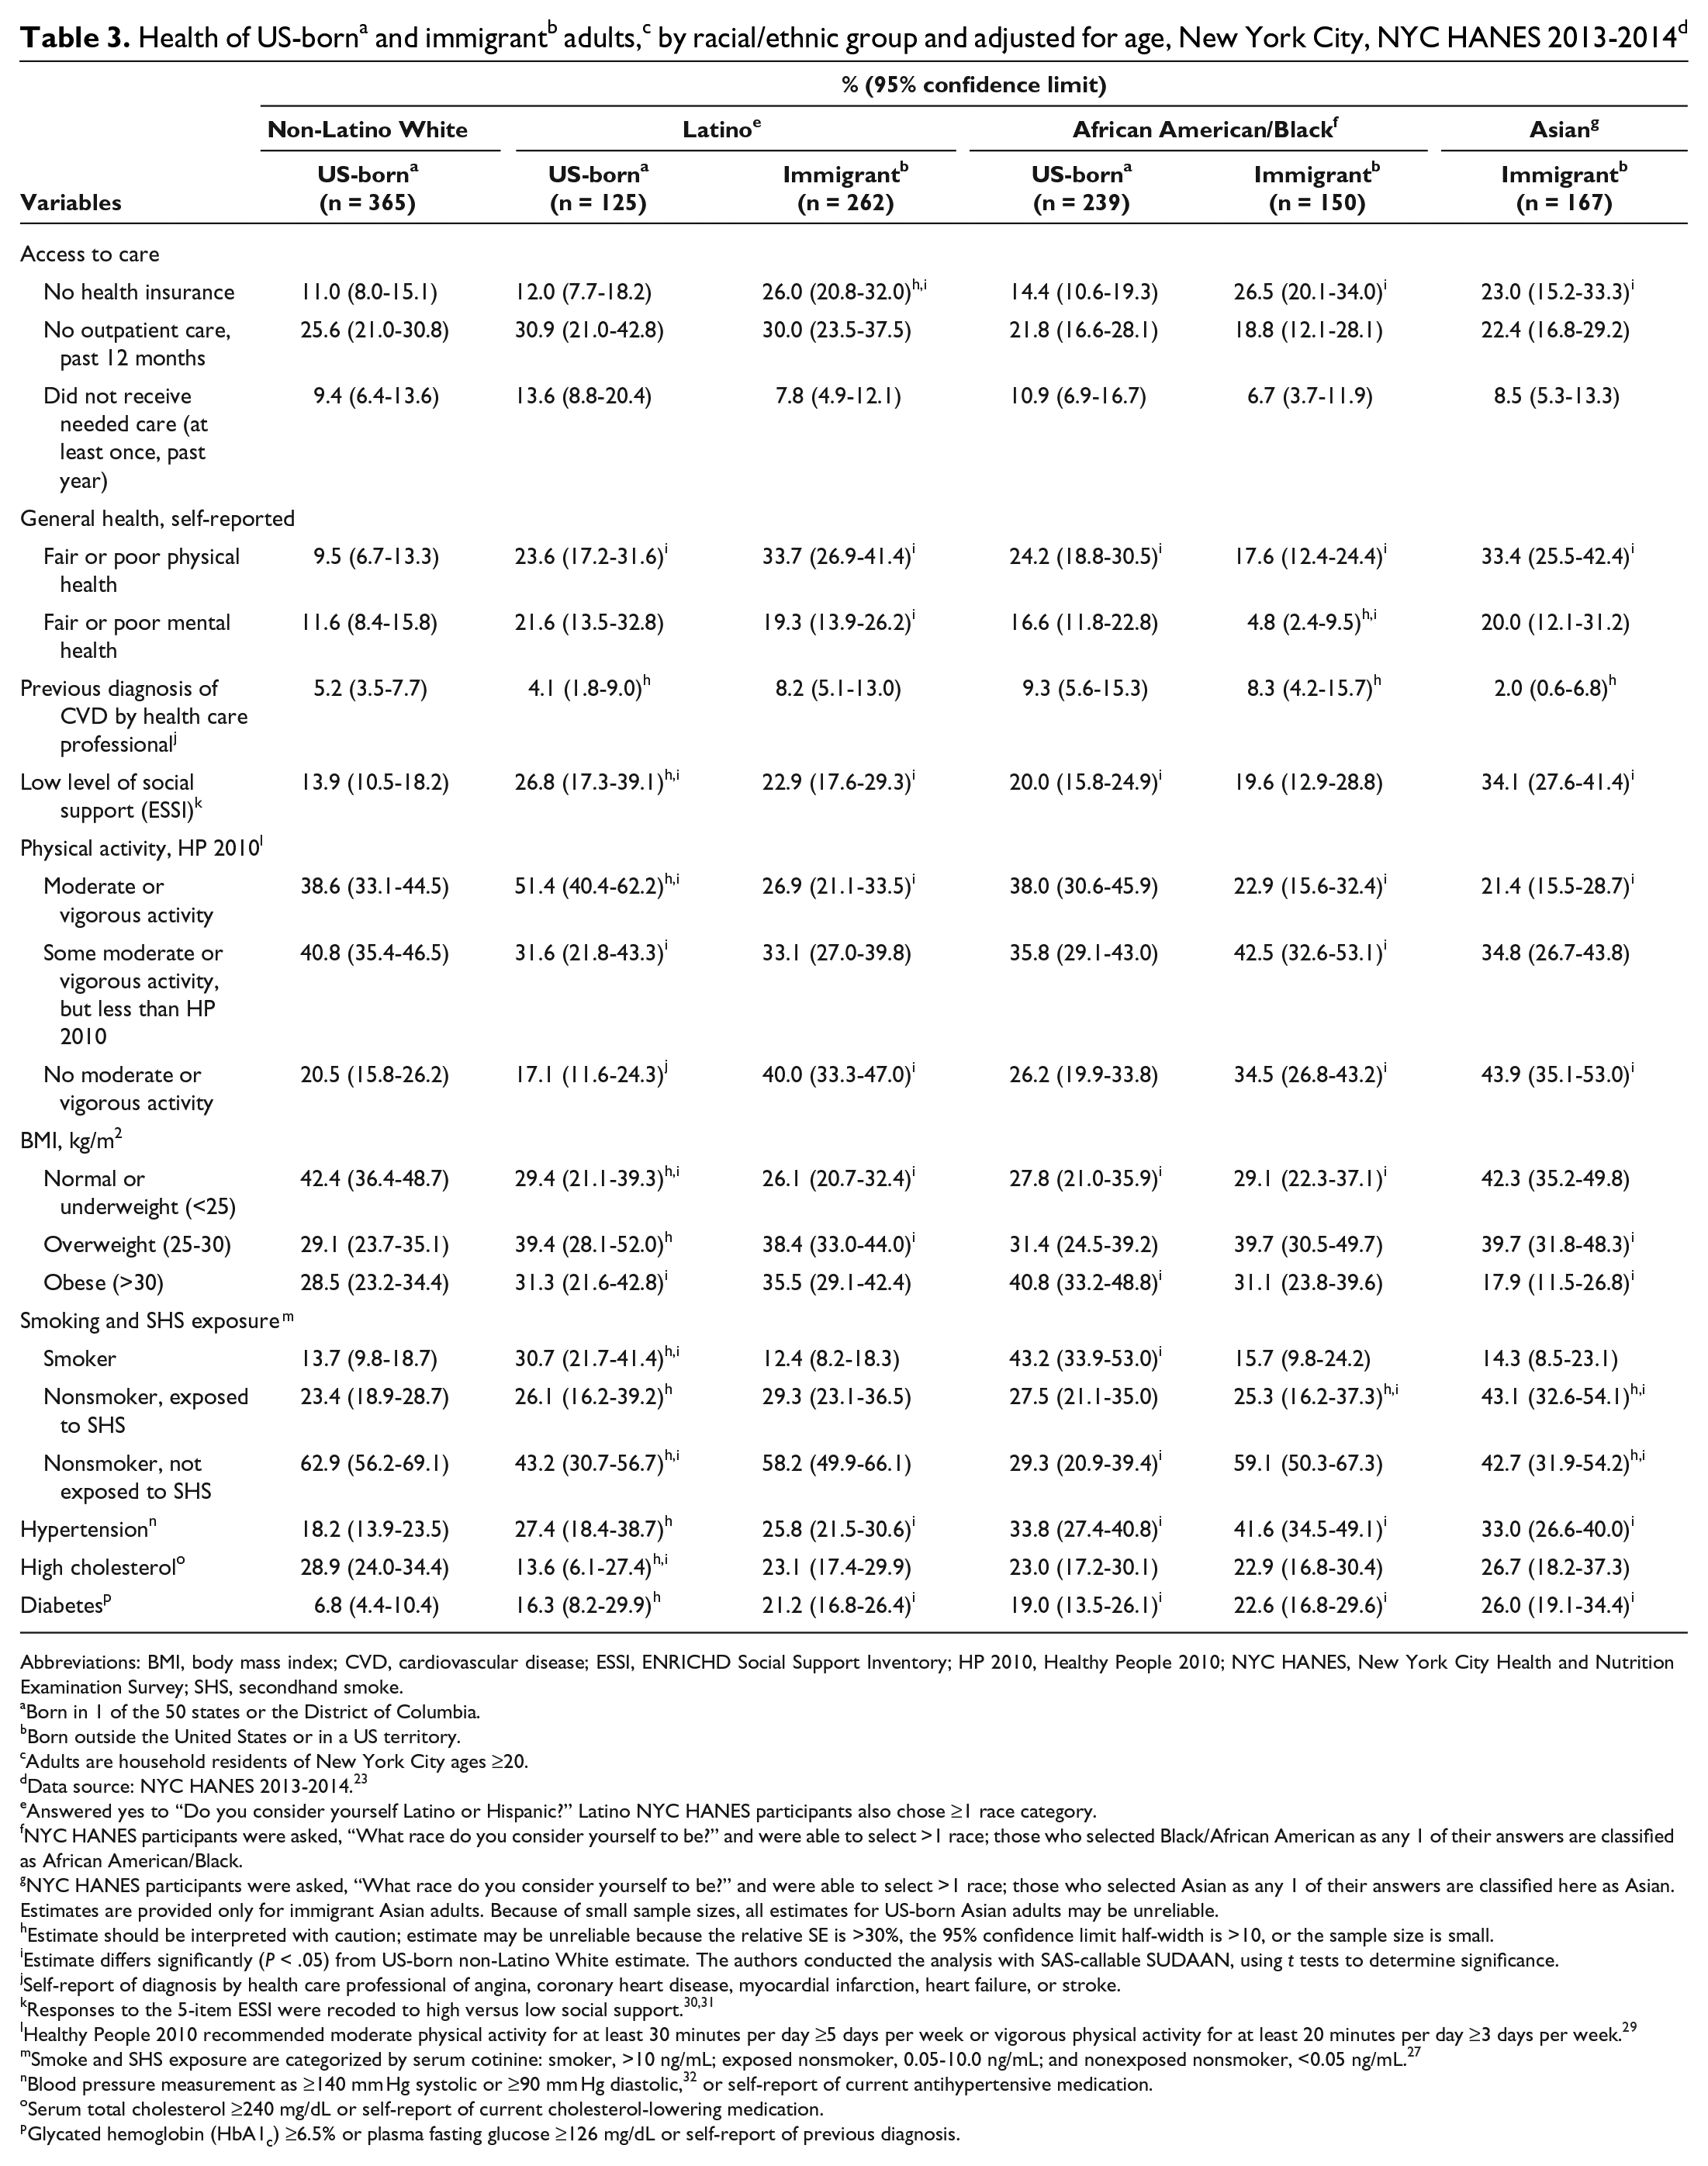
Analyses by immigration and race/ethnicity did not indicate that immigrant adults had better cardiovascular risk profiles than US-born adults (Table 3). Although Latino and Black immigrant adults were significantly less likely to smoke than Latino and Black US-born adults (Latino: 12.4% vs 30.7% [P = .001]; Black: 15.7% vs 43.2% [P < .001]), immigrant adults of Asian, Black, and Latino race/ethnicity were significantly more likely than US-born non-Latino White adults to report fair or poor physical health (Asian: 33.4% vs 9.5% [P < .001]; Black: 17.6% vs 9.5% [P = .02]; Latino: 33.7% vs 9.5% [P < .001]), lack moderate or vigorous physical activity (Asian: 43.9% vs 20.5% [P < .001]; Black: 34.5% vs 20.5% [P = .01]; Latino: 40.0% vs 20.5% [P < .001]), and have diabetes (Asian: 26.0% vs 6.8%; Black: 22.6% vs 6.8%; Latino: 21.2% vs 6.8% [all P < .001]). Immigrant adults of Asian and Black race/ethnicity were also significantly more likely than US-born non-Latino White adults to have hypertension (Asian: 33.0% vs 18.2% [P = .01]; Black: 41.6% vs 18.2% [P < .001]).
Health of US-borna and immigrantb adults,c by racial/ethnic group and adjusted for age, New York City, NYC HANES 2013-2014d
Abbreviations: BMI, body mass index; CVD, cardiovascular disease; ESSI, ENRICHD Social Support Inventory; HP 2010, Healthy People 2010; NYC HANES, New York City Health and Nutrition Examination Survey; SHS, secondhand smoke.
aBorn in 1 of the 50 states or the District of Columbia.
bBorn outside the United States or in a US territory.
cAdults are household residents of New York City ages ≥20.
dData source: NYC HANES 2013-2014. 23
eAnswered yes to “Do you consider yourself Latino or Hispanic?” Latino NYC HANES participants also chose ≥1 race category.
fNYC HANES participants were asked, “What race do you consider yourself to be?” and were able to select >1 race; those who selected Black/African American as any 1 of their answers are classified as African American/Black.
gNYC HANES participants were asked, “What race do you consider yourself to be?” and were able to select >1 race; those who selected Asian as any 1 of their answers are classified here as Asian. Estimates are provided only for immigrant Asian adults. Because of small sample sizes, all estimates for US-born Asian adults may be unreliable.
hEstimate should be interpreted with caution; estimate may be unreliable because the relative SE is >30%, the 95% confidence limit half-width is >10, or the sample size is small.
iEstimate differs significantly (P < .05) from US-born non-Latino White estimate. The authors conducted the analysis with SAS-callable SUDAAN, using t tests to determine significance.
jSelf-report of diagnosis by health care professional of angina, coronary heart disease, myocardial infarction, heart failure, or stroke.
lHealthy People 2010 recommended moderate physical activity for at least 30 minutes per day ≥5 days per week or vigorous physical activity for at least 20 minutes per day ≥3 days per week. 29
mSmoke and SHS exposure are categorized by serum cotinine: smoker, >10 ng/mL; exposed nonsmoker, 0.05-10.0 ng/mL; and nonexposed nonsmoker, <0.05 ng/mL. 27
nBlood pressure measurement as ≥140 mm Hg systolic or ≥90 mm Hg diastolic, 32 or self-report of current antihypertensive medication.
oSerum total cholesterol ≥240 mg/dL or self-report of current cholesterol-lowering medication.
pGlycated hemoglobin (HbA1c) ≥6.5% or plasma fasting glucose ≥126 mg/dL or self-report of previous diagnosis.
Discussion
Results from NYC HANES 2013-2014 showed that immigrant adults in New York City were more likely than US-born adults to have key risk factors for CVD. Our finding of a high prevalence of diabetes among immigrant adults is supported by a previous analysis in New York City 19 and by national studies. A 2008 review article found greater diabetes prevalence among immigrants than among US-born adults. 1 Studies have also shown a high prevalence of diabetes among recent immigrants from Asia and Central America. 34 -36 Moreover, diabetes prevalence has increased in many immigrants’ places of origin, including South and East Asia, Mexico, and the Caribbean. 37 -41
Several studies support our finding of a high prevalence of hypertension among immigrants. For example, Chinese immigrants in Western countries were more likely than adults in China to have hypertension, 42 and African immigrant adults were more likely than African American adults to have hypertension. 43 An analysis of NYC HANES 2013-2014 by ethnicity found that Dominican and East/Southeast Asian adults—groups with large proportions of recent immigrants—were more likely than non-Latino White adults to have hypertension. 44
Previous research also confirms lower smoking prevalence among immigrant adults than among US-born adults. Several studies show less smoking among Black adults born outside the United States than among US-born Black adults. 21,45,46 Among low-income residents in subsidized New York City housing, non–US-born adults were less likely to smoke than US-born adults. 47 Research on estimated smoking-attributable mortality for non–US-born and US-born adults found that lower smoking prevalence may explain more than half of the immigrant mortality advantage. 9
Our study also showed that, despite low smoking prevalence, immigrant adults with ≥10 years in the United States were more likely than US-born adults to be exposed to SHS. Surveys of US immigrants from Africa and Asia found limited awareness of the negative effect of SHS. 48 -50 Furthermore, immigrant adults in New York City were more likely than US-born adults to work at places that do not adequately enforce smoking prohibitions. 51
We found that recent immigrant adults had a health advantage over US-born adults only in lower prevalence of high cholesterol. Our study differed from previous studies demonstrating advantages in additional measures such as BMI and hypertension. 1,5 Because smoking is a cause of hypertension, 52 the similar prevalence of smoking among recent immigrant and US-born adults in New York City may account for some of the difference between our study and others. Studies of immigrants with >10 years of US residence, however, were similar to ours, showing no cardiometabolic advantage among immigrants. 14,15
Like national analyses, 5,53 our analysis showed that immigrant adults were more likely than US-born adults to be uninsured. In New York City, however, immigrant adults were similar to US-born adults in having a past-year primary care visit, perhaps because of the city’s strong public hospital system and its outreach to the uninsured. Immigrant adults in the United States, however, were less likely than US-born adults to obtain primary care. 54 Researchers have hypothesized that immigrants only seemed to have health advantages, because they had not obtained primary care and were unaware of asymptomatic conditions. 6 In our study, immigrant adults had obtained medical care despite a lack of health insurance, and they were aware of existing conditions, notably diabetes. This suggests that the health advantage seen in other studies may be due to lack of awareness.
Mortality statistics are better among immigrant adults than among US-born adults. 5,55 Researchers found that the life expectancy in New York City in 2010 was approximately 2 years longer than in the United States and attributed that disparity to the city’s larger proportion of immigrants. 56 (They rejected theories that life expectancy was high because of excellent health among the city’s US-born adults.) Our study, however, raises concern for future life expectancy in New York City, because the high prevalence of diabetes and hypertension among immigrants may lead to poor CVD outcomes as today’s immigrant population ages.
Strengths and Limitations
Our study had several strengths. First, the study used a population-representative sample. Moreover, NYC HANES 2013-2014 used bilingual interviewers, which likely increased participation among New York City residents. Second, the survey’s use of both self-report and objective measures (examination and laboratory measurement) allowed us to include “silent” undiagnosed conditions. Including the undiagnosed may, in part, explain differences between our study and studies showing an immigrant health advantage.
This study also had several limitations, including the low NYC HANES response rate, which may have resulted in sampling bias. However, among participants, only modest differences were found between unweighted and weighted characteristics, suggesting that participants were representative of New York City adults. 22 Also, in the past 25 years, response rates have been decreasing nationally, even for in-person surveys such as NHANES. 57 Second, NYC HANES was cross-sectional, limiting causal inference. Third, the use of self-reported data may have led to bias. Finally, small sample sizes for analysis of immigrants with ≤5 years of US residence resulted in potentially unreliable estimates, and small sample sizes for other analyses may have resulted in a lack of power to detect differences.
Conclusions
National programs to reduce CVD prevalence have targeted racial/ethnic groups that include large proportions of immigrants. The Million Hearts campaign seeks to prevent 1 million heart attacks and strokes, emphasizing hypertension risk among Latino and African American adults. 58 Our results suggest the need to target Asian American adults as well. Similarly, the Centers for Disease Control and Prevention’s 6/18 initiative promotes 18 interventions for 6 common conditions, including diabetes and hypertension. 59 Prevention, diagnosis, and treatment in racial/ethnic communities with large proportions of immigrants may yield substantial benefits.
New York City has a robust public hospital system that provides care regardless of ability to pay. Nonetheless, studies show that the uninsured seek care only after their health has severely deteriorated and that lack of health insurance increases mortality. 60 NYC Care, begun in 2019, provides preventive and primary care to uninsured New Yorkers, including about 300 000 undocumented immigrants, and this program may help reduce the gaps noted here and in previous studies. 61 Smaller, targeted community health worker programs have helped some immigrant groups, but expanding such programs is challenging. 62 -65 In contrast, some national policies may worsen immigrant health; for example, proposed 2018 changes to the public charge rule would have excluded immigrants from health care. 66
Our findings suggest that CVD risk among recent immigrants is comparable to the risk among US-born adults and that earlier immigrants have especially high risks of hypertension and diabetes. Understanding how patterns of health change after migration to the United States may help guide prevention, programming, and policy, so that all people who live in the United States remain healthy.
Footnotes
Acknowledgments
The authors thank Charon Gwynn and Rishi Sood for their helpful suggestions and careful review.
Declaration of Conflicting Interests
The authors declared no potential conflicts of interest with respect to the research, authorship, and/or publication of this article.
Funding
The authors disclosed receipt of the following financial support for the research, authorship, and/or publication of this article: Support for NYC HANES 2013-2014 was primarily provided by the de Beaumont Foundation with additional support from the Robert Wood Johnson Foundation, the Robin Hood Foundation, the New York State Health Foundation, and the Doris Duke Charitable Foundation.