
Abstract
Objective
Given the growth in national disability-associated health care expenditures (DAHE) and the changes in health insurance–specific DAHE distribution, updated estimates of state-level DAHE are needed. The objective of this study was to update state-level estimates of DAHE.
Methods
We combined data from the 2013-2015 Medical Expenditure Panel Survey, 2013-2015 Behavioral Risk Factor Surveillance System, and 2014 National Health Expenditure Accounts to calculate state-level DAHE for US adults in total, per adult, and per (adult) person with disability (PWD). We adjusted expenditures to 2017 prices and assessed changes in DAHE from 2003 to 2015.
Results
In 2015, DAHE were $868 billion nationally (range, $1.4 billion in Wyoming to $102.8 billion in California) accounting for 36% of total health care expenditures (range, 29%-41%). From 2003 to 2015, total DAHE increased by 65% (range, 35%-125%). In 2015, DAHE per PWD were highest in the District of Columbia ($27 839) and lowest in Alabama ($12 603). From 2003 to 2015, per-PWD DAHE increased by 13% (range, −20% to 61%) and per-capita DAHE increased by 28% (range, 7%-84%). In 2015, Medicare DAHE per PWD ranged from $10 067 in Alaska to $18 768 in New Jersey. Medicaid DAHE per PWD ranged from $9825 in Nevada to $43 365 in the District of Columbia. Nonpublic–health insurer per-PWD DAHE ranged from $7641 in Arkansas to $18 796 in Alaska.
Conclusion
DAHE are substantial and vary by state. The public sector largely supports the health care costs of people with disabilities. State policy makers and other stakeholders can use these results to inform the development of public health programs that support and provide ongoing health care to people with disabilities.
People with disabilities face an array of health and support needs. 1 -3 Not only do they need more health care services than people without disabilities, they often require long-term services and supports to address functional limitations and actively participate in society. 4,5 Both access to care and supply of services and supports vary by state. In a recently updated analysis of disability-associated health care expenditures (DAHE), national DAHE, adjusted to 2017 prices, increased substantially from $527 billion in 2003 to $868 billion in 2015, increasing from 27% to 36% as a percentage of total health care spending. 6
Given the growth in national DAHE and the changes in health insurance–specific DAHE distribution, 6 updated estimates of state-level DAHE are needed. The burden of diseases, injuries, and risk factors, many of which contribute to disability, varies widely across states, and several factors drive these differences. 7 For example, differences in state-level prevalence and costs of chronic conditions, such as asthma, chronic obstructive pulmonary disease, diabetes, and obesity, can be explained by sociodemographic composition of the state population, general health status, and access to and quality of care. 8 -13 Consequently, state-level DAHE are also expected to vary widely.
The goal of this analysis was to update state-level estimates of DAHE generated more than a decade ago. 14 We calculated total and health insurance–specific DAHE by state. States and other stakeholders can use state-level DAHE estimates to inform the development of public health policies and programs that support and provide health care to people with disabilities.
Methods
For consistency with previously published state-level DAHE, we followed the methodology of Anderson et al. 14,15 Given a lack of data on health care expenditures and disability status at the state level from a single source, we combined 3 data sources. First, we used data from the 2013-2015 Medical Expenditure Panel Survey (MEPS) 16 to estimate national DAHE for noninstitutionalized adults. MEPS is administered by the Agency for Healthcare Research and Quality and is a nationally representative sample of medical expenditure data for the noninstitutionalized population. We used data from the MEPS Household Component, which contains payment data, including expenditures for outpatient and inpatient services, emergency department and physician office visits, and prescription medication. In MEPS, these expenditure data are obtained from the MEPS Medical Provider Component, where available, and imputed otherwise.
Second, we used the 2013-2015 Behavioral Risk Factor Surveillance System (BRFSS) 17 to obtain state-level data on disability and characteristics of people with disabilities. BRFSS is an annual, state-based, cross-sectional telephone interview survey conducted by the Centers for Disease Control and Prevention and state health departments. The survey represents the civilian noninstitutionalized adult population in the 50 states and the District of Columbia.
Third, we used the 2014 National Health Expenditure Accounts (NHEA) 18 to obtain data on health care expenditures not captured in MEPS and health care expenditures for adults in institutions (eg, nursing home residents). NHEA are produced by the Office of the Actuary at the Centers for Medicare & Medicaid Services. NHEA cover the entire US population and a full range of health care expenditures, making it the most comprehensive collection of data on health care expenditures.
In the first part of the analysis, we used MEPS data to estimate national-level DAHE for noninstitutionalized adults. In MEPS, disability was defined as receiving help with activities of daily living (eg, bathing) or instrumental activities of daily living (eg, shopping) or being limited in the ability to work, do housework, or go to school because of an impairment or a physical or mental health problem. We estimated a 2-part regression model of per-person DAHE using MEPS. 19,20 Our model is detailed elsewhere. 6 We controlled for sociodemographic characteristics but did not control for other health conditions to capture data on health care spending on diseases for which disability may be a risk factor. 21,22 We estimated DAHE per person with disability (PWD) using the counterfactual approach. 6 We also used MEPS data to estimate a multinomial logit model predicting health insurance category. We used the same control variables as in the expenditure regressions (plus health and employment status) to estimate health insurance category.
In the second part of the analysis, we combined results from the MEPS regressions with BRFSS data to generate state-level estimates of DAHE for noninstitutionalized adults. In BRFSS, disability was defined as being limited in any way in any activities because of physical, mental, or emotional problems. The BRFSS does not collect data on category of health insurance coverage. Thus, we used coefficients from the MEPS regression estimating health insurance category and covariates of BRFSS respondents to predict the probability of having each health insurance category for BRFSS respondents. We used these probabilities as indicators of health insurance category for BRFSS respondents.
To estimate DAHE for each BRFSS respondent, we applied coefficients from the MEPS expenditure regressions to covariates of each BRFSS respondent. We predicted total health care expenditures and DAHE for each BRFSS respondent and summed across respondents in each state to generate state-level total health care expenditures and DAHE for each health insurance category. We calculated DAHE as a percentage of total expenditures in each state for each health insurance category.
In the third part of the analysis, we used NHEA data to reconcile health care expenditures and include DAHE for institutionalized adults. We multiplied our estimated state-level DAHE percentages by state-level total health care expenditures for noninstitutionalized adults from NHEA. These estimates of state and health insurance–specific DAHE accounted for expenditures that were missing from MEPS but included in NHEA. 23 We also added state-level estimates of DAHE for institutionalized adults to estimate total DAHE in each state. 6
We adjusted state DAHE to sum to national DAHE that resulted from reconciliation of MEPS and NHEA expenditures. 6 We applied a ratio of the national health insurance–specific DAHE from MEPS/NHEA to the sum of state-level health insurance–specific DAHE from BRFSS/NHEA. We used the adjusted DAHE to calculate the DAHE percentage of state total expenditures by health insurer.
We estimated per-capita DAHE and DAHE per PWD in each state. We estimated the numbers of noninstitutionalized adults with and without disabilities and by health insurance category from the BRFSS. We estimated the numbers of institutionalized adults by state and by health insurance category using the Eiken 24 counts of enrollees in nursing homes for Medicaid, and for Medicare and nonpublic health insurers, using fractions of nursing home costs paid by each health insurer. 25
Following recommendations by Dunn et al, 26 we converted DAHE based on 2013-2015 data and 2003 DAHE generated by Anderson et al 14 to 2017 prices using the Personal Consumer Expenditures Health Component, 27 which adjusts for general medical price changes. We calculated percentage changes in state-level DAHE in total, per capita (adult population), and per PWD (adults only) and in prevalence of disability among adults from 2003 to 2015.
We based this analysis on de-identified, publicly available data. As such, the study does not constitute human subjects research. We conducted analyses of MEPS and BRFSS data using Stata version 15 (StataCorp).
Results
In 2015, the DAHE percentage of total expenditures was 36% nationally, ranging from 29% in Utah to 41% in Arkansas and Kentucky (Table 1). Nationally, DAHE represented 54% of all Medicare expenditures, 72% of all Medicaid expenditures, and 19% of all expenditures paid by nonpublic sources. By state, the DAHE percentage of all Medicare expenditures ranged from 46% in Hawaii to 60% in Alabama; the DAHE percentage of all Medicaid expenditures ranged from 67% in Hawaii and Illinois to 79% in Alabama; and the DAHE percentage of all nonpublic health insurance expenditures ranged from 15% in the District of Columbia to 22% in Oregon and Washington.
Total disability-associated health care expenditures (DAHE), by health insurer and state, United States, 2015 a
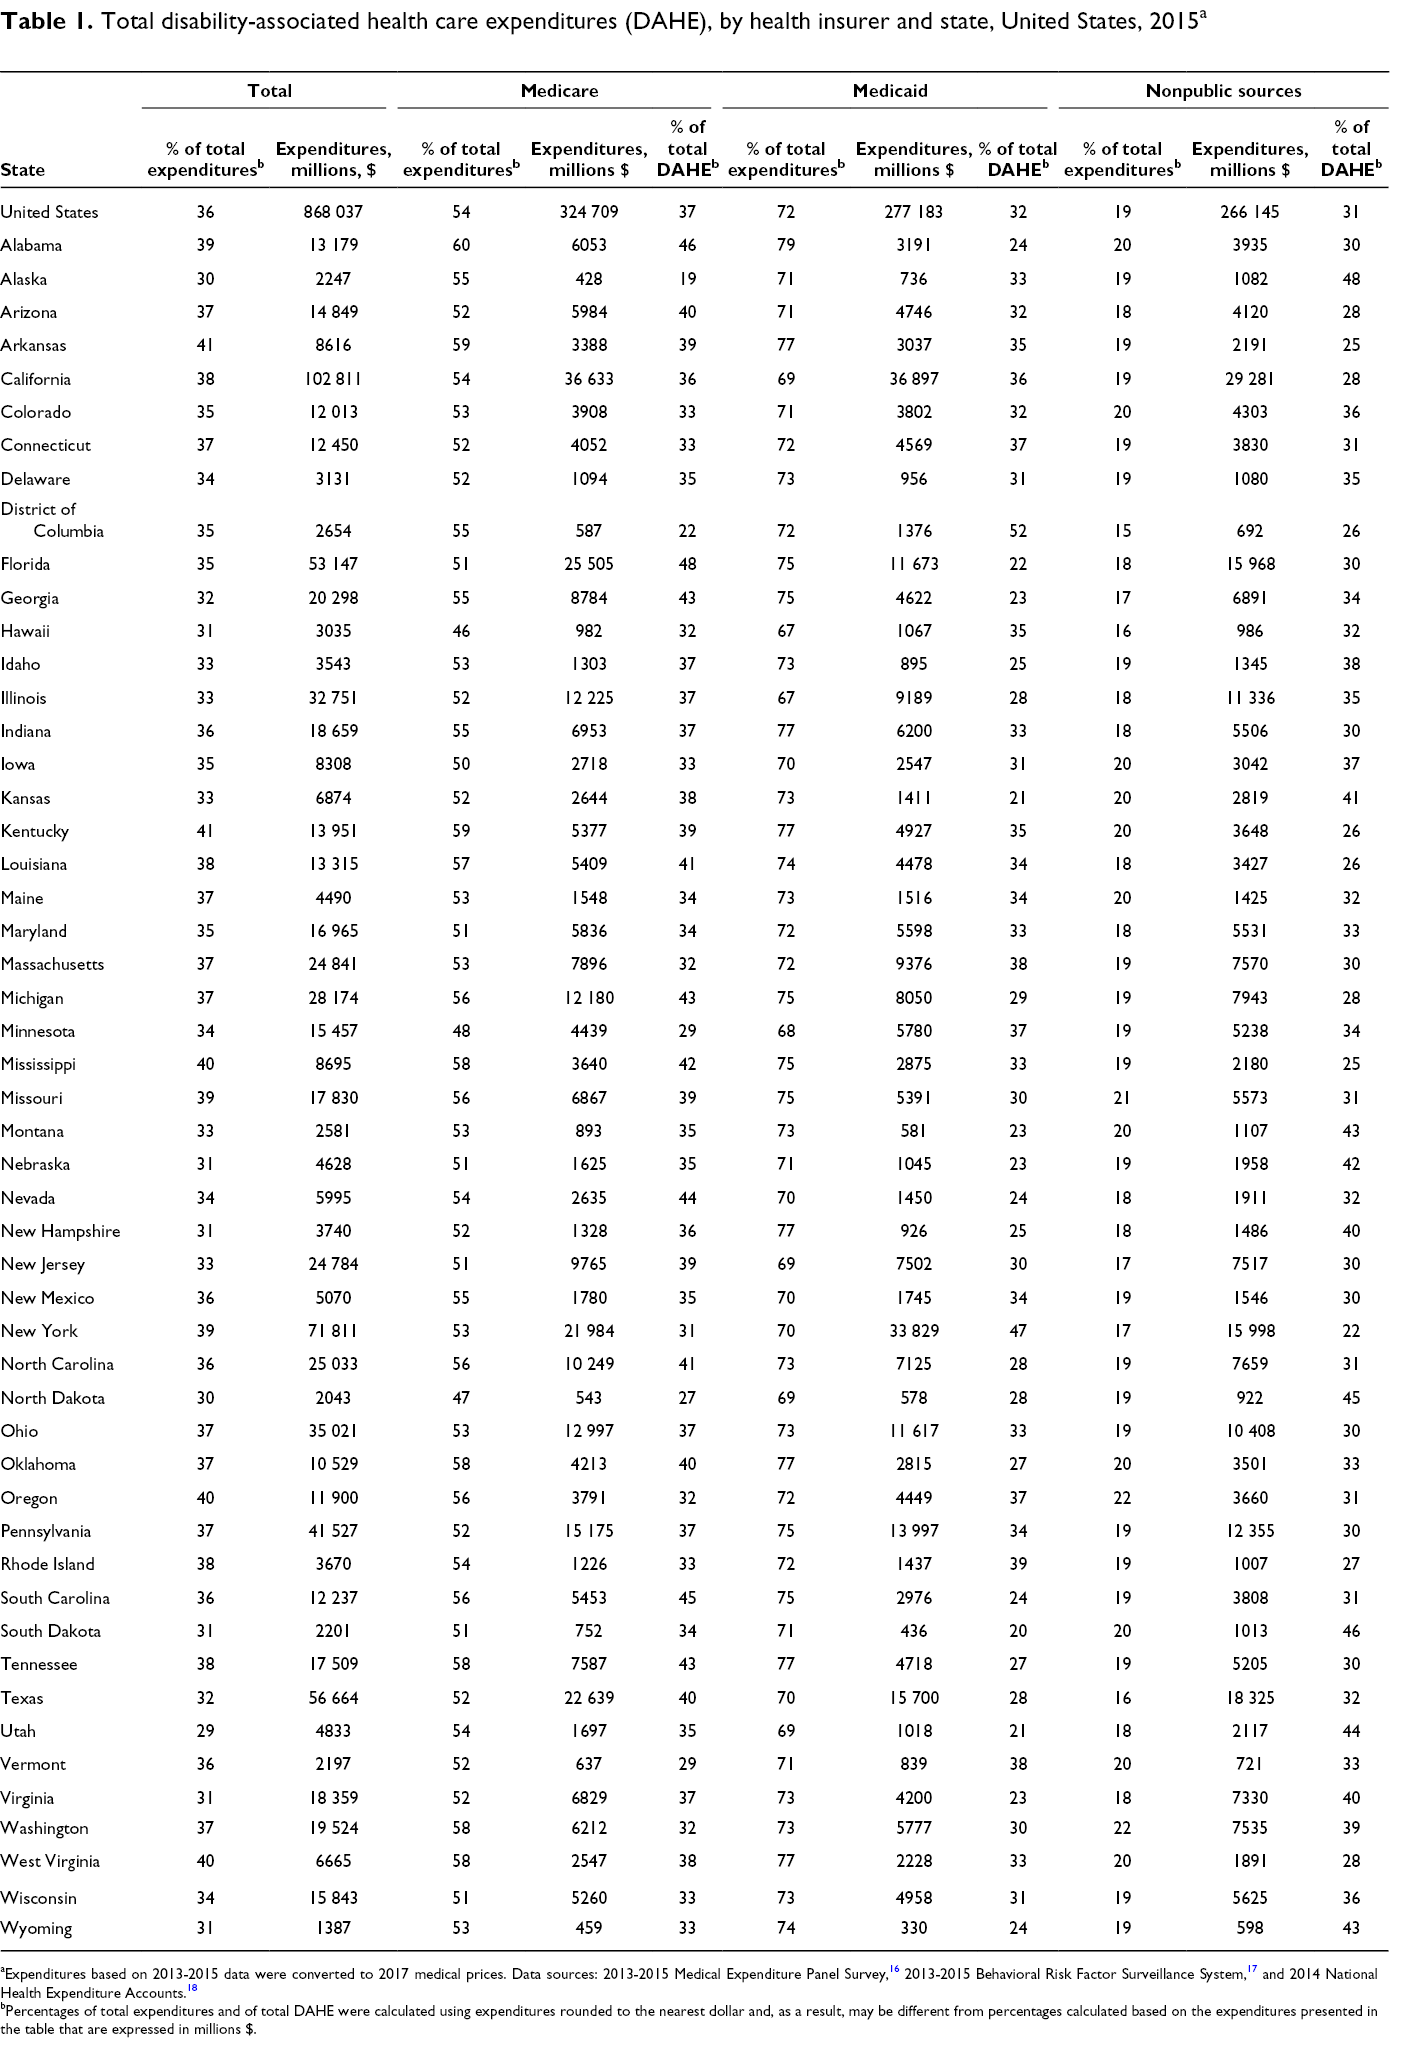
aExpenditures based on 2013-2015 data were converted to 2017 medical prices. Data sources: 2013-2015 Medical Expenditure Panel Survey, 16 2013-2015 Behavioral Risk Factor Surveillance System, 17 and 2014 National Health Expenditure Accounts. 18
bPercentages of total expenditures and of total DAHE were calculated using expenditures rounded to the nearest dollar and, as a result, may be different from percentages calculated based on the expenditures presented in the table that are expressed in millions $.
In 2015, DAHE for all US adults were $868 billion (at 2017 prices) and state-level expenditures ranged from $1.4 billion in Wyoming to $102.8 billion in California, with a median of $12.2 billion in South Carolina (Table 1). Public sources paid for 69% of DAHE, ranging from 52% in Alaska to 78% in New York, but the main DAHE payer varied across states. The highest portion of DAHE paid by Medicare was in Florida (48%), by Medicaid was in the District of Columbia (52%), and by nonpublic sources was in Alaska (48%). Medicare DAHE ranged from $428 million in Alaska to $36.6 billion in California, with a median of $4.2 billion in Oklahoma. Medicaid DAHE ranged from $330 million in Wyoming to $36.9 billion in California, with a median of $3.8 billion in Colorado. Nonpublic health insurance DAHE ranged from $598 million in Wyoming to $29.3 billion in California, with a median of $3.7 billion in Oregon.
The mean state-level DAHE per PWD in 2015 was $17 431 and the median was $16 489 in South Dakota (Figure). The highest mean per-PWD DAHE (District of Columbia, $27 839) was more than double the lowest mean per-PWD DAHE (Alabama, $12 603). States in the Northeast and Midwest, along with California and Alaska, were in the top third of the per-PWD DAHE distribution (DAHE >$18 000), whereas most states in the West and Southeast were in the bottom third (DAHE <$15 000).
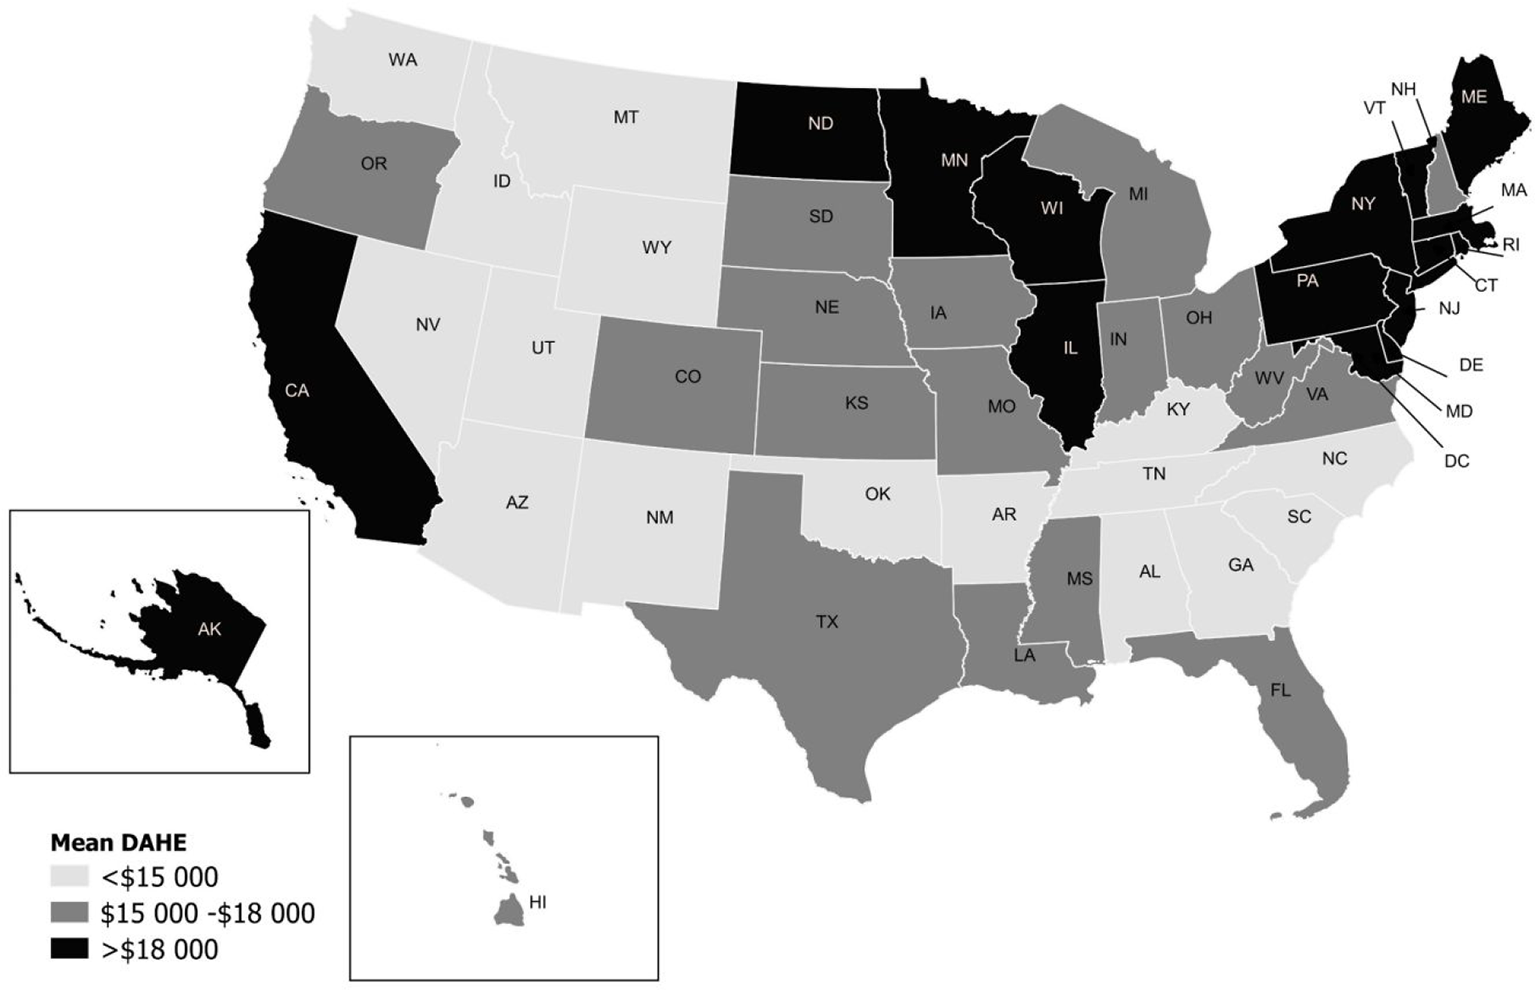
Mean disability-associated health care expenditures (DAHE) per person with a disability (2017 prices), United States, 2015. Mean DAHE for United States is $17 431. The median DAHE is $16 489 (South Dakota). Expenditures based on 2013-2015 and 2002-2003 data were converted to 2017 medical prices. Data sources: 2013-2015 Medical Expenditure Panel Survey, 16 2013-2015 Behavioral Risk Factor Surveillance System, 17 and 2014 National Health Expenditure Accounts. 18
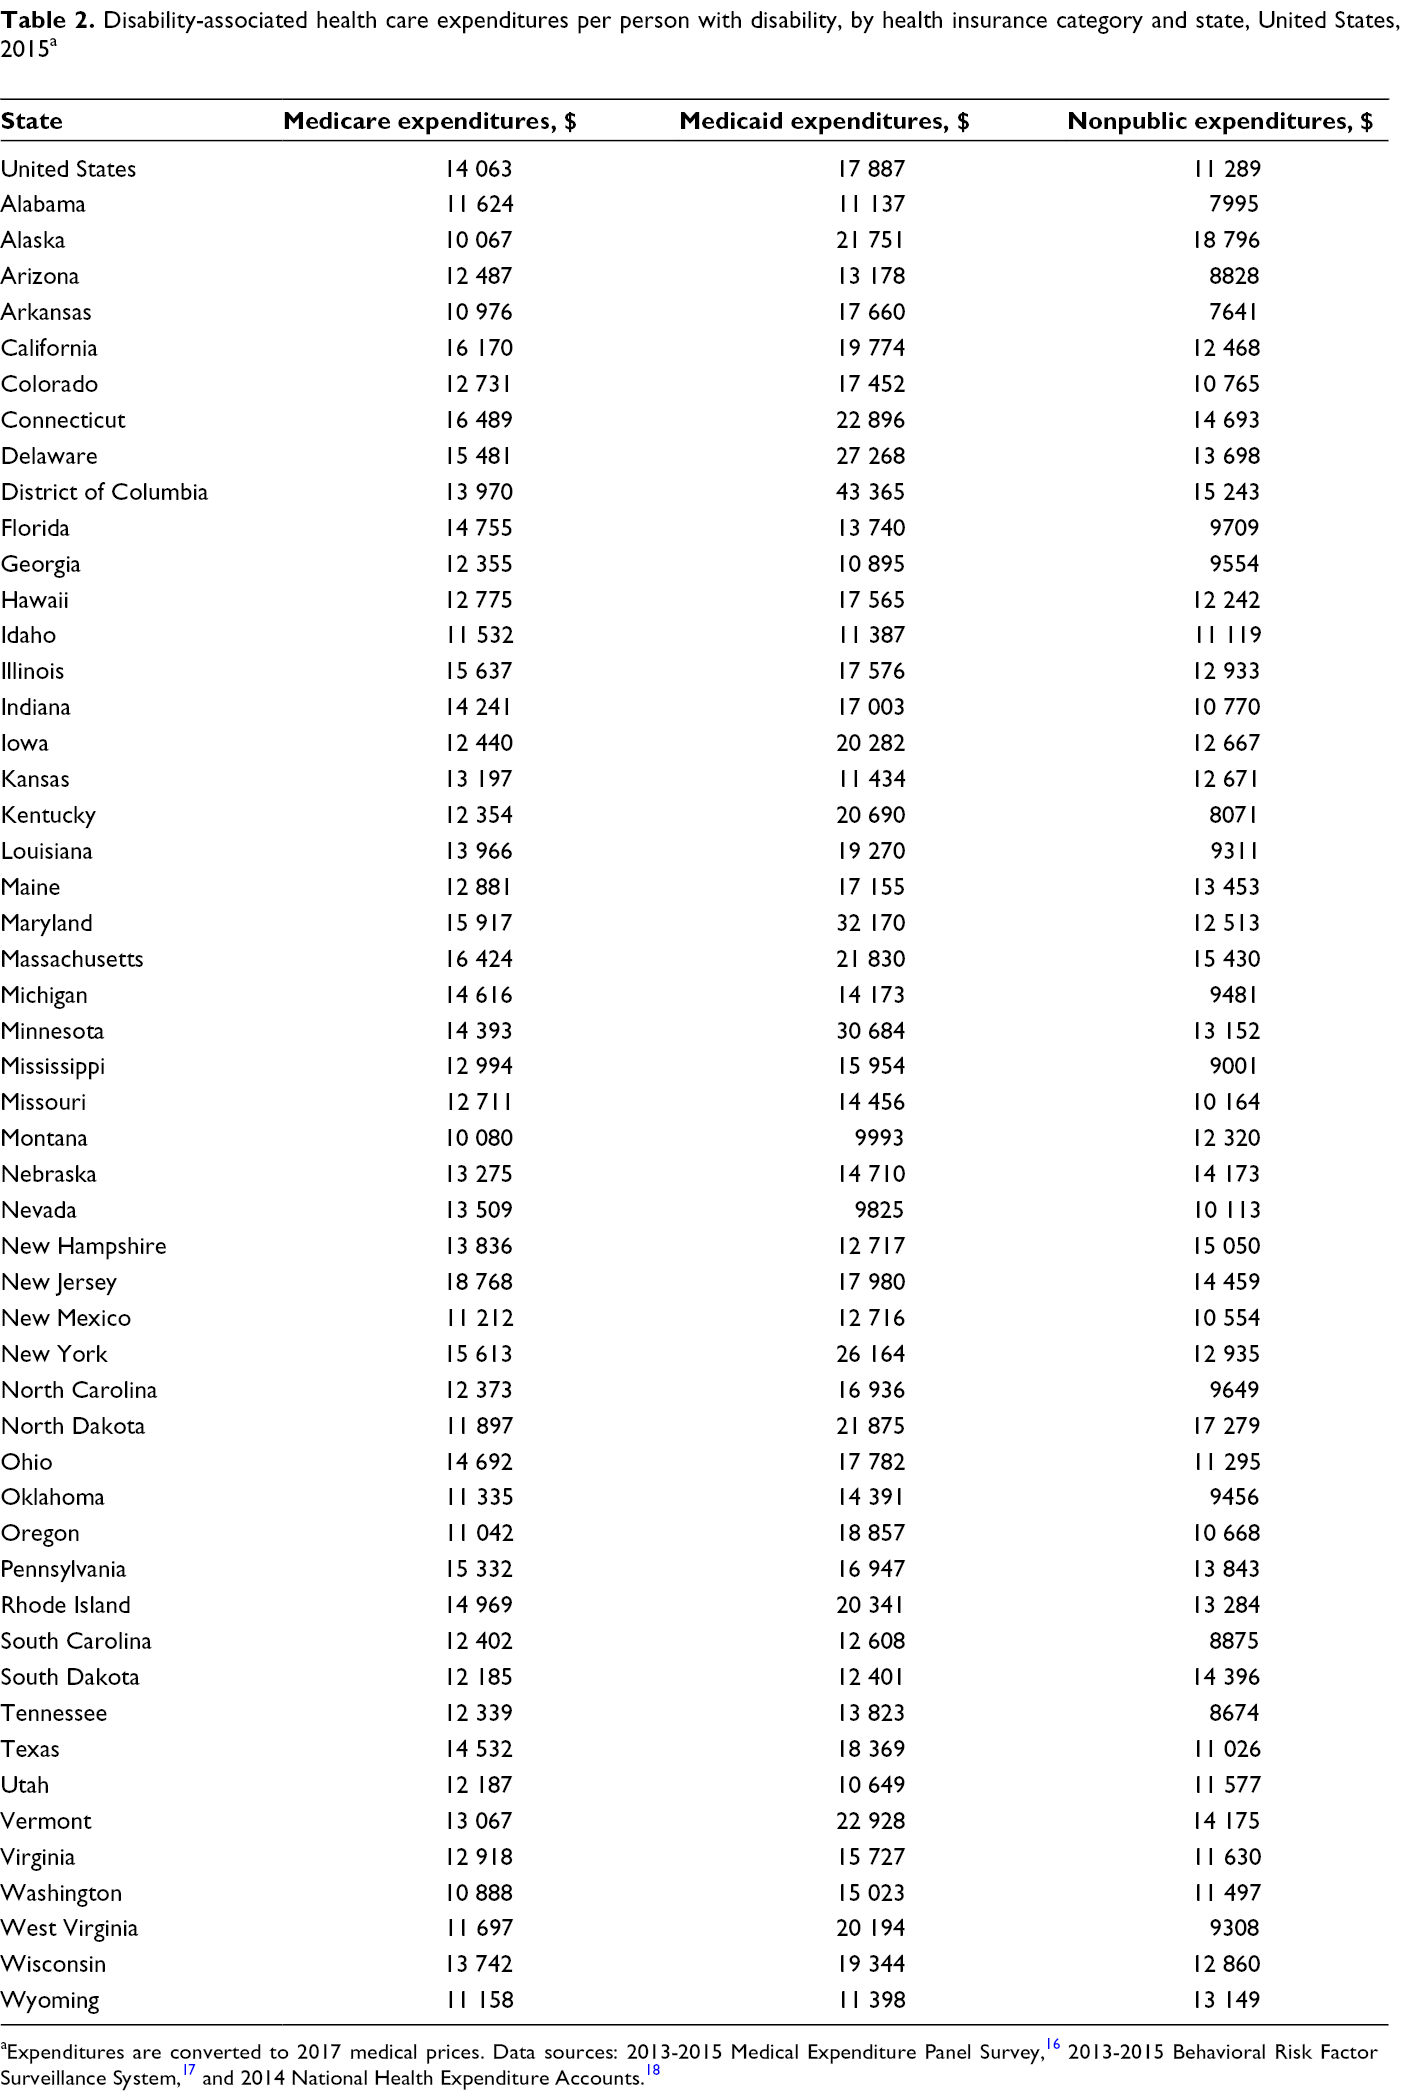
DAHE per PWD paid by Medicare in 2015 ranged from $10 067 in Alaska to $18 768 in New Jersey, with a median of $12 918 in Virginia (Table 2). Per-PWD DAHE paid by Medicaid ranged from $9825 in Nevada to $43 365 in the District of Columbia, with a median of $17 155 in Maine. Nonpublic health insurance DAHE per PWD ranged from $7641 in Arkansas to $18 796 in Alaska, with a median of $11 630 in Virginia.
Disability-associated health care expenditures per person with disability, by health insurance category and state, United States, 2015 a
From 2003 to 2015, total DAHE increased by an average of 65%, ranging from 35% in New York to 125% in Hawaii and a median of 68% in Indiana (Table 3). DAHE per capita, which represents DAHE spread across the entire state population, increased by an average of 28%, ranging from 7% in Illinois to 84% in California, and a median increase of 29% in Alaska, Virginia, West Virginia, and Wisconsin. Both DAHE per PWD and prevalence of disability among adults increased by an average of 13% from 2003 to 2015. Change in per-PWD DAHE ranged from a 20% decrease in Tennessee to a 61% increase in California, with a median increase of 12% in Delaware, Montana, and New Jersey. Change in disability prevalence ranged from a 13% decrease in Minnesota to a 38% increase in Tennessee, with a median increase of 15% in Kentucky, Maine, Ohio, Pennsylvania, and Vermont.
Changes in disability-associated health care expenditures (DAHE) and prevalence of disability by state, United States, 2003-2015 a
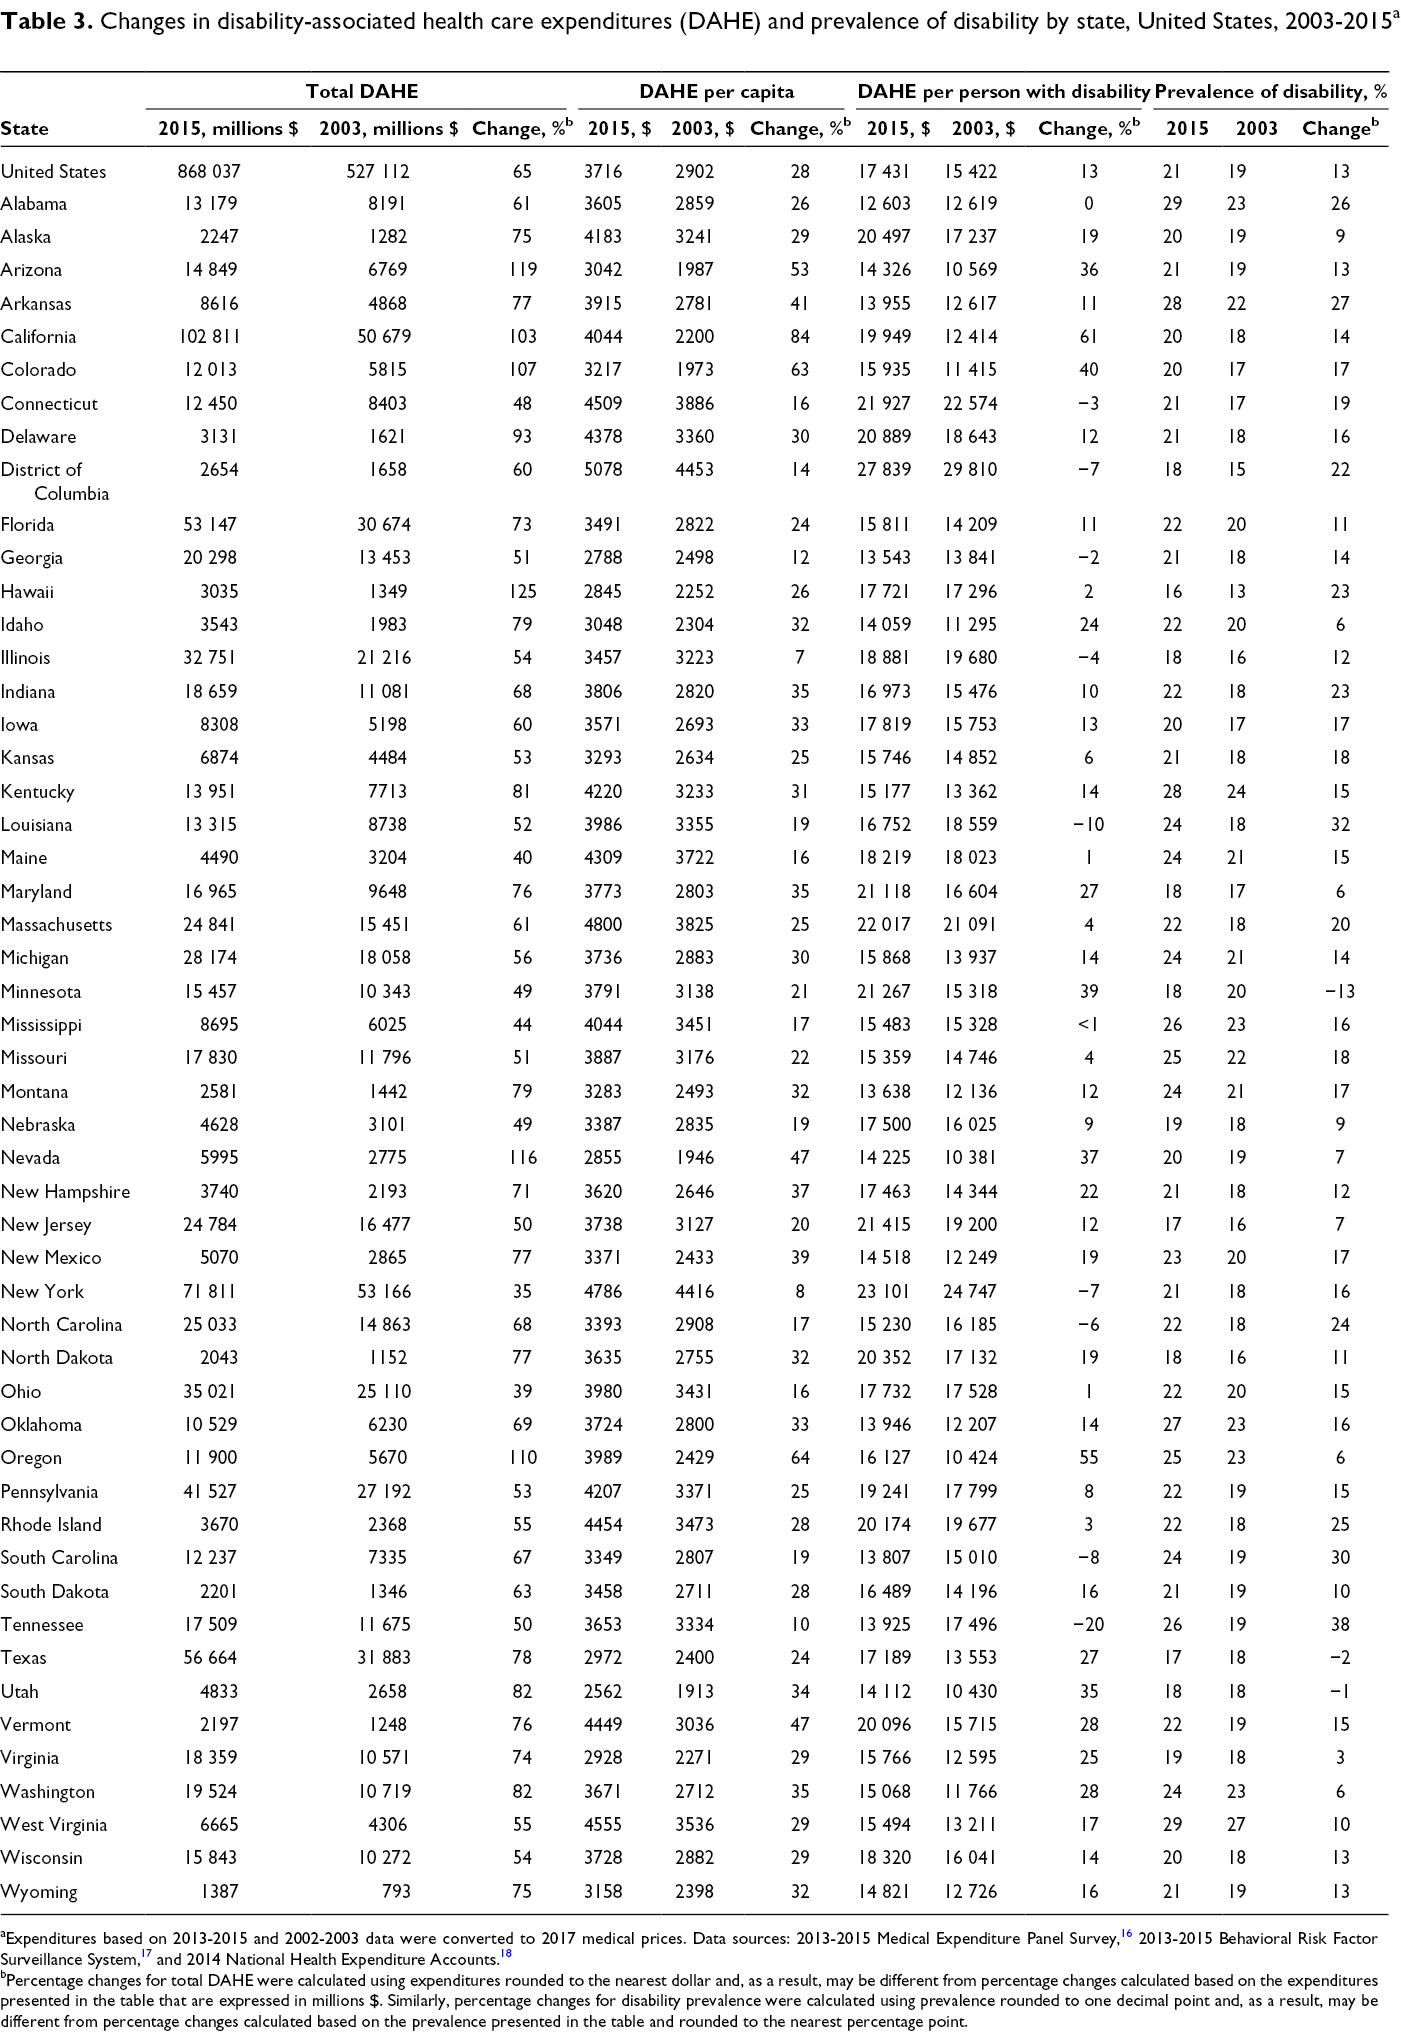
aExpenditures based on 2013-2015 and 2002-2003 data were converted to 2017 medical prices. Data sources: 2013-2015 Medical Expenditure Panel Survey, 16 2013-2015 Behavioral Risk Factor Surveillance System, 17 and 2014 National Health Expenditure Accounts. 18
bPercentage changes for total DAHE were calculated using expenditures rounded to the nearest dollar and, as a result, may be different from percentage changes calculated based on the expenditures presented in the table that are expressed in millions $. Similarly, percentage changes for disability prevalence were calculated using prevalence rounded to one decimal point and, as a result, may be different from percentage changes calculated based on the prevalence presented in the table and rounded to the nearest percentage point.
Discussion
Changes in total DAHE from 2003 to 2015 reflect changes in the number of people with disabilities, which is a function of total population and disability prevalence, and changes in per-PWD DAHE. On average, both prevalence of disability and per-PWD DAHE increased from 2003 to 2015; however, disability prevalence decreased in 3 states and per-PWD DAHE decreased in 10 states during this period. None of the states had a reduction in both prevalence and per-PWD DAHE, and total DAHE increased in every state. In general, states with relatively low growth in total DAHE had low growth in both per-PWD DAHE and prevalence. However, in some states, growth in total DAHE was relatively low even if one of these components increased at a relatively high rate because the other component had a relatively low increase or even a decrease. For example, Minnesota had a relatively low increase in total DAHE even with a relatively high increase in per-PWD DAHE, because its disability prevalence decreased from 2003 to 2015. In Tennessee, total DAHE also increased at a relatively low rate even with a high increase in disability prevalence, because per-PWD DAHE in this state decreased from 2003 to 2015. States with relatively high growth in total DAHE had high growth in either or both disability prevalence and DAHE per PWD.
Per-PWD health care spending is determined by the prices of services and the number of services used. Both are likely to vary across states and over time, thus contributing to variation in spending and growth across states. 28 Differences in sociodemographic composition across states explain some of this variation in prices and utilization and their changes over time. For example, because per-PWD DAHE increase with age, states with higher proportions of older adults will have higher per-PWD DAHE. Similarly, states that have higher growth in the proportion of older adults may also have faster growth in per-PWD DAHE.
Beyond sociodemographic characteristics, however, differences in health status, access to health care, quality of care, and health care systems and payment structures likely contribute to state-level differences in DAHE and its growth. 8 -11 These factors vary substantially across states and over time and may drive DAHE in different directions. Thus, increased DAHE are not necessarily undesirable, and caution should be used when comparing expenditures and increases across states. For example, improved access to and quality of preventive care for people with disabilities may increase health care use and, as a result, DAHE. 29 Because growth in prevention spending may improve access to and quality of care for people with disabilities, 29 it can offset downstream medical spending on treatment and care. Lower-than-average DAHE may also reflect barriers to care and poor quality of preventive care and indicate that resources spent on people with disabilities are inadequate. Higher-than-average DAHE could reflect higher-than-average severity of disability or higher-than-average prevalence of other chronic conditions, such as diabetes, among people with disabilities. Our findings demonstrate that nursing home care is also an important contributor to DAHE. In states with high nursing home costs, providing access to less expensive nursing home care, such as home- and community-based services for long-term services and supports, may reduce these costs. Receipt of more targeted, timely, and efficient care to reduce inpatient readmission and emergency department visits for ambulatory care–sensitive conditions may also reduce DAHE. 30
We also found that distribution of DAHE and per-PWD DAHE across health insurers varied substantially by state. National DAHE per PWD was the highest for Medicaid. Across states, Medicaid DAHE varied more than Medicare or nonpublic health insurer DAHE, which possibly reflects state policy differences in Medicaid generosity. Differences in Medicaid enrollment and coverage may explain the difference in the mix of DAHE payers across states, because Medicaid policies vary by state. The timing and implementation of state-level health care policies, such as Medicaid expansion and Medicaid payment policies, may also contribute to varying changes in DAHE over time. 31 -34
Our estimates may be helpful for informing discussions of public health policies, programs, and resources needed to provide ongoing quality health care and improve quality of life for people with disabilities. Our results highlight the need for interventions that aim to improve health behaviors, prevent secondary conditions, and provide ongoing quality health care to people with disabilities. The Medicaid expenditure estimates, in particular, may provide valuable information for Medicaid health care resource planning and program evaluation. For example, 67% to 79% of all Medicaid expenditures in each state were DAHE. These results reinforce the importance of implementing public programs and policies that support this vulnerable population and help people with disabilities avoid complications and associated health care expenditures.
Several factors could explain differences in total, per-PWD, and per-capita DAHE across states and over time, including access to and quality of care, severity of disability, prevalence of chronic conditions, and coverage and payment policies. Although our results alone cannot be used to interpret and identify factors driving changes in DAHE in each state, they provide a starting point for further research in trying to understand those factors and develop policies to address them. Our results highlight another important topic for future research, which is assessing whether DAHE increases were associated with improvements in health or survival for people with disabilities.
Limitations
Our study had several limitations. First, because we lacked state-level data on both disability status and health care expenditures from a single source, we combined data from multiple sources. Specifically, we predicted health insurance category and health care expenditures by applying coefficients from an analysis using national MEPS data to state-level BRFSS data. Because of the differences between MEPS and BRFSS survey designs and the questions used to define disability, the prevalence of disability was higher in BRFSS than in MEPS. Some of the characteristics of the disability samples from the 2 surveys were also different. For example, BRFSS respondents with disabilities were younger, more educated, and more likely to be married than adults with disabilities responding to MEPS. However, reconciling the sum of state DAHE with national DAHE largely eliminated differences in the survey populations.
Our definition of disability was similar to the one used in the analysis by Anderson et al, 14,15 because our goal was to produce DAHE estimates that could be compared with previous estimates. Our definition of disability assessed deficits in activities of daily living, instrumental activities of daily living, and general activity limitations. Although parts of this definition have been frequently used in many other studies, a second limitation of our analysis is that a different definition or data might produce different results. Third, our definition of disability was based on self-reported data and is subject to self-report bias; however, self-reported data are routinely used to assess disability at the national and state levels. 35
Finally, we did not assess age of onset, severity, permanence, duration, or underlying health conditions or causes of reported disability and the extent to which those factors may explain DAHE increases. We intentionally did not control for health conditions when estimating DAHE because we wanted to capture downstream cost effects of those conditions among people with disabilities, who may be at a higher risk of developing certain chronic conditions. 21,22
Conclusions
Results of this study provide policy makers, health insurers, and public health officials with an updated analysis of state-level health care expenditures associated with disability. Results indicate that DAHE were substantial, varied extensively across states, and changed at varying rates from 2003 to 2015. The public sector largely supports the costs of health care for people with disabilities. States and other stakeholders may use these state-level estimates to better design public health policies and planning efforts that support people with disabilities and provide ongoing, accessible, and quality health care to this vulnerable population.
Footnotes
Authors’ Note
This article was prepared by RTI, under contract to the Centers for Disease Control and Prevention (CDC). The findings and conclusions of this article are those of the authors and do not necessarily represent the official position of CDC.
Declaration of Conflicting Interests
The authors declared no potential conflicts of interest with respect to the research, authorship, and/or publication of this article.
Funding
The authors declared the following financial support with respect to the research, authorship, and/or publication of this article: This article was developed by RTI International under contract number 200-2013-M-53964B from CDC.