
Abstract
Objective
Hospital discharge data are a means of monitoring infectious diseases in a population. We investigated rates of infectious disease hospitalizations in New York City.
Methods
We analyzed data for residents discharged from New York State hospitals with a principal diagnosis of an infectious disease during 2001-2014 by using the Statewide Planning and Research Cooperative System. We calculated annual age-adjusted hospitalization rates and the percentage of hospitalizations in which in-hospital death occurred. We examined diagnoses by site of infection or sepsis and by pathogen type.
Results
During 2001-2014, the mean annual age-adjusted rate of infectious disease hospitalizations in New York City was 1661.6 (95% CI, 1659.2-1663.9) per 100 000 population; the mean annual age-adjusted hospitalization rate decreased from 2001-2003 to 2012-2014 (rate ratio = 0.9; 95% CI, 0.9-0.9). The percentage of in-hospital death during 2001-2014 was 5.9%. The diagnoses with the highest mean annual age-adjusted hospitalization rates among all sites of infection and sepsis diagnoses were the lower respiratory tract, followed by sepsis. From 2001-2003 to 2012-2014, the mean annual age-adjusted hospitalization rate per 100 000 population for HIV decreased from 123.1 (95% CI, 121.7-124.5) to 40.0 (95% CI, 39.2-40.7) and for tuberculosis decreased from 10.2 (95% CI, 9.8-10.6) to 4.6 (95% CI, 4.4-4.9).
Conclusions
Although hospital discharge data are subject to limitations, particularly for tracking sepsis, lower respiratory tract infections and sepsis are important causes of infectious disease hospitalizations in New York City. Hospitalizations for HIV infection and tuberculosis appear to be declining.
Infectious diseases have historically been a leading cause of morbidity and mortality in the United States. 1 -3 Although public health interventions (eg, vaccinations) and breakthroughs in clinical care (eg, discovery of antimicrobials) have led to advances in infectious disease control, ongoing facilitators, such as travel and antimicrobial resistance, have contributed to the persistent threat of infectious diseases. 4,5 Thus, monitoring infectious diseases is important to better understand their effect on the health care system and public health.
The burden of certain infectious diseases in a jurisdiction can be measured through means such as death certificate data and reportable disease data. Death certificate data presumably reflect severe cases of infectious diseases, but death certificates do not capture data on infectious diseases among persons who have not died. 1,3 Reportable disease data typically provide the most timely and high-quality insights on high-priority infectious diseases among both decedents and survivors but will not include data on infectious diseases for which reporting is not required. 6
Hospital discharge data are another means of monitoring infectious diseases and have been used to evaluate the burden of infectious diseases in the United States. 3,7,8 To our knowledge, few published studies have evaluated infectious disease hospitalization rates in US cities. Evaluating infectious disease hospitalization rates in US cities is important, however, given the large proportion of the population that lives in cities. 9 Furthermore, unique factors in cities likely facilitate the spread of infectious diseases. 10,11 Evaluating infectious disease hospitalization rates in New York City is particularly important because New York City is the largest city in the United States, has a high population density, and has a high volume of international travel. 12,13 Thus, we investigated infectious disease hospitalization rates in New York City.
Methods
Data Source and Study Population
We analyzed hospital discharge data from January 1, 2001, through December 31, 2014, among New York City residents (based on address of home residence) who were hospitalized at an acute care facility in New York State by using the Statewide Planning and Research Cooperative System (SPARCS). SPARCS is a comprehensive all-payer data reporting system that collects discharge data from all hospitals in New York State. 14 Each discharge record in SPARCS includes a principal diagnosis and up to 24 secondary diagnoses that are coded by using the International Classification of Diseases, Ninth Revision, Clinical Modification (ICD-9-CM). 15
Our study was determined by the Centers for Disease Control and Prevention to be public health nonresearch and was determined by the New York City Department of Health and Mental Hygiene (DOHMH) to involve the use of existing data and to be exempt from DOHMH institutional review board review.
Definitions
We defined an infectious disease hospitalization as one in which an infectious disease was listed as the principal diagnosis in the discharge record (Appendix). We further stratified infectious disease diagnoses according to site of infection or sepsis and by pathogen type. We compiled infectious disease diagnoses through manual review of the ICD-9-CM code index, using ICD-9-CM codes identified in an earlier study as a model. 8,16
Data Analysis
We counted the number of infectious disease hospitalizations for the total New York City population and further stratified the data by age, sex, race/ethnicity, borough, area-based poverty level, site of infection or sepsis, and pathogen type. The unit of analysis was a hospitalization. We treated repeat infectious disease hospitalizations of the same patient as independent hospitalizations. We found 21 missing entries for sex (0.001%), 174 533 for race/ethnicity (9.1%), and 2457 (0.1%) for area-based poverty level. We did not make adjustments for missing data. We also calculated the percentage of infectious disease hospitalizations in which in-hospital death occurred.
We calculated mean annual crude and mean annual age-adjusted hospitalization rates during 2001-2014 and expressed these rates as the number of hospitalizations per 100 000 persons of the corresponding population. We calculated age-adjusted hospitalization rates by the direct method, with the 2000 projected US population as the standard. 17 We derived population estimates for each year from US Census Bureau data. 6,17 The DOHMH produced poverty estimates on the basis of US Census Bureau Population Estimate Program files and estimated area-based poverty level on the basis of zip code tabulation areas. 18 We classified poverty into 4 levels on the basis of the percentage of people with incomes below 100% of the federal poverty level (FPL): <10% FPL, 10%-19% FPL, 20%-29% FPL, and ≥30% FPL. The 5 boroughs in New York City are the Bronx, Brooklyn, Manhattan, Queens, and Staten Island. We used the normal approximation method to calculate 95% CIs for age-adjusted hospitalization rates. 19
To evaluate trends in infectious disease hospitalizations, we calculated and plotted annual age-adjusted hospitalization rates. We also calculated mean annual age-adjusted hospitalization rates for the first 3 years (2001-2003) and the last 3 years (2012-2014) of the study period. We used Poisson regression to calculate rate ratios (RRs) and 95% CIs and determine the significance level between the first 3 years and last 3 years.
In addition, we identified the 10 most commonly listed principal diagnoses among infectious disease hospitalizations. Because sepsis is a clinical syndrome in response to various infectious diseases, we also identified the 10 leading non-sepsis infectious disease secondary diagnoses for hospitalizations with a principal diagnosis of sepsis. This analysis was the only analysis for which we assessed secondary diagnoses.
We considered a 2-sided P value <.05 to be significant. We performed all analyses using SAS version 9.4 (SAS Institute Inc).
Results
During 2001-2014, there were 1 923 543 infectious disease hospitalizations of New York City residents, corresponding to a mean annual age-adjusted infectious disease hospitalization rate of 1661.6 (95% CI, 1659.2-1663.9) per 100 000 population (Table 1). The annual age-adjusted rate of infectious disease hospitalizations varied each year, but the mean annual age-adjusted hospitalization rate per 100 000 population decreased from 2001-2003 (1673.3 [95% CI, 1668.1-1678.5]) to 2012-2014 (1539.0 [95% CI, 1534.2-1543.7]) (RR, 0.9; 95% CI, 0.9-0.9) (Table 2, Figure A). The percentage of infectious disease hospitalizations with an in-hospital death was 5.9% during the study period; the percentage of in-hospital death increased from 5.8% during 2001-2003 to 5.9% during 2012-2014 (P = .02).
Infectious disease hospitalizations by demographic group, New York City, 2001-2014 a
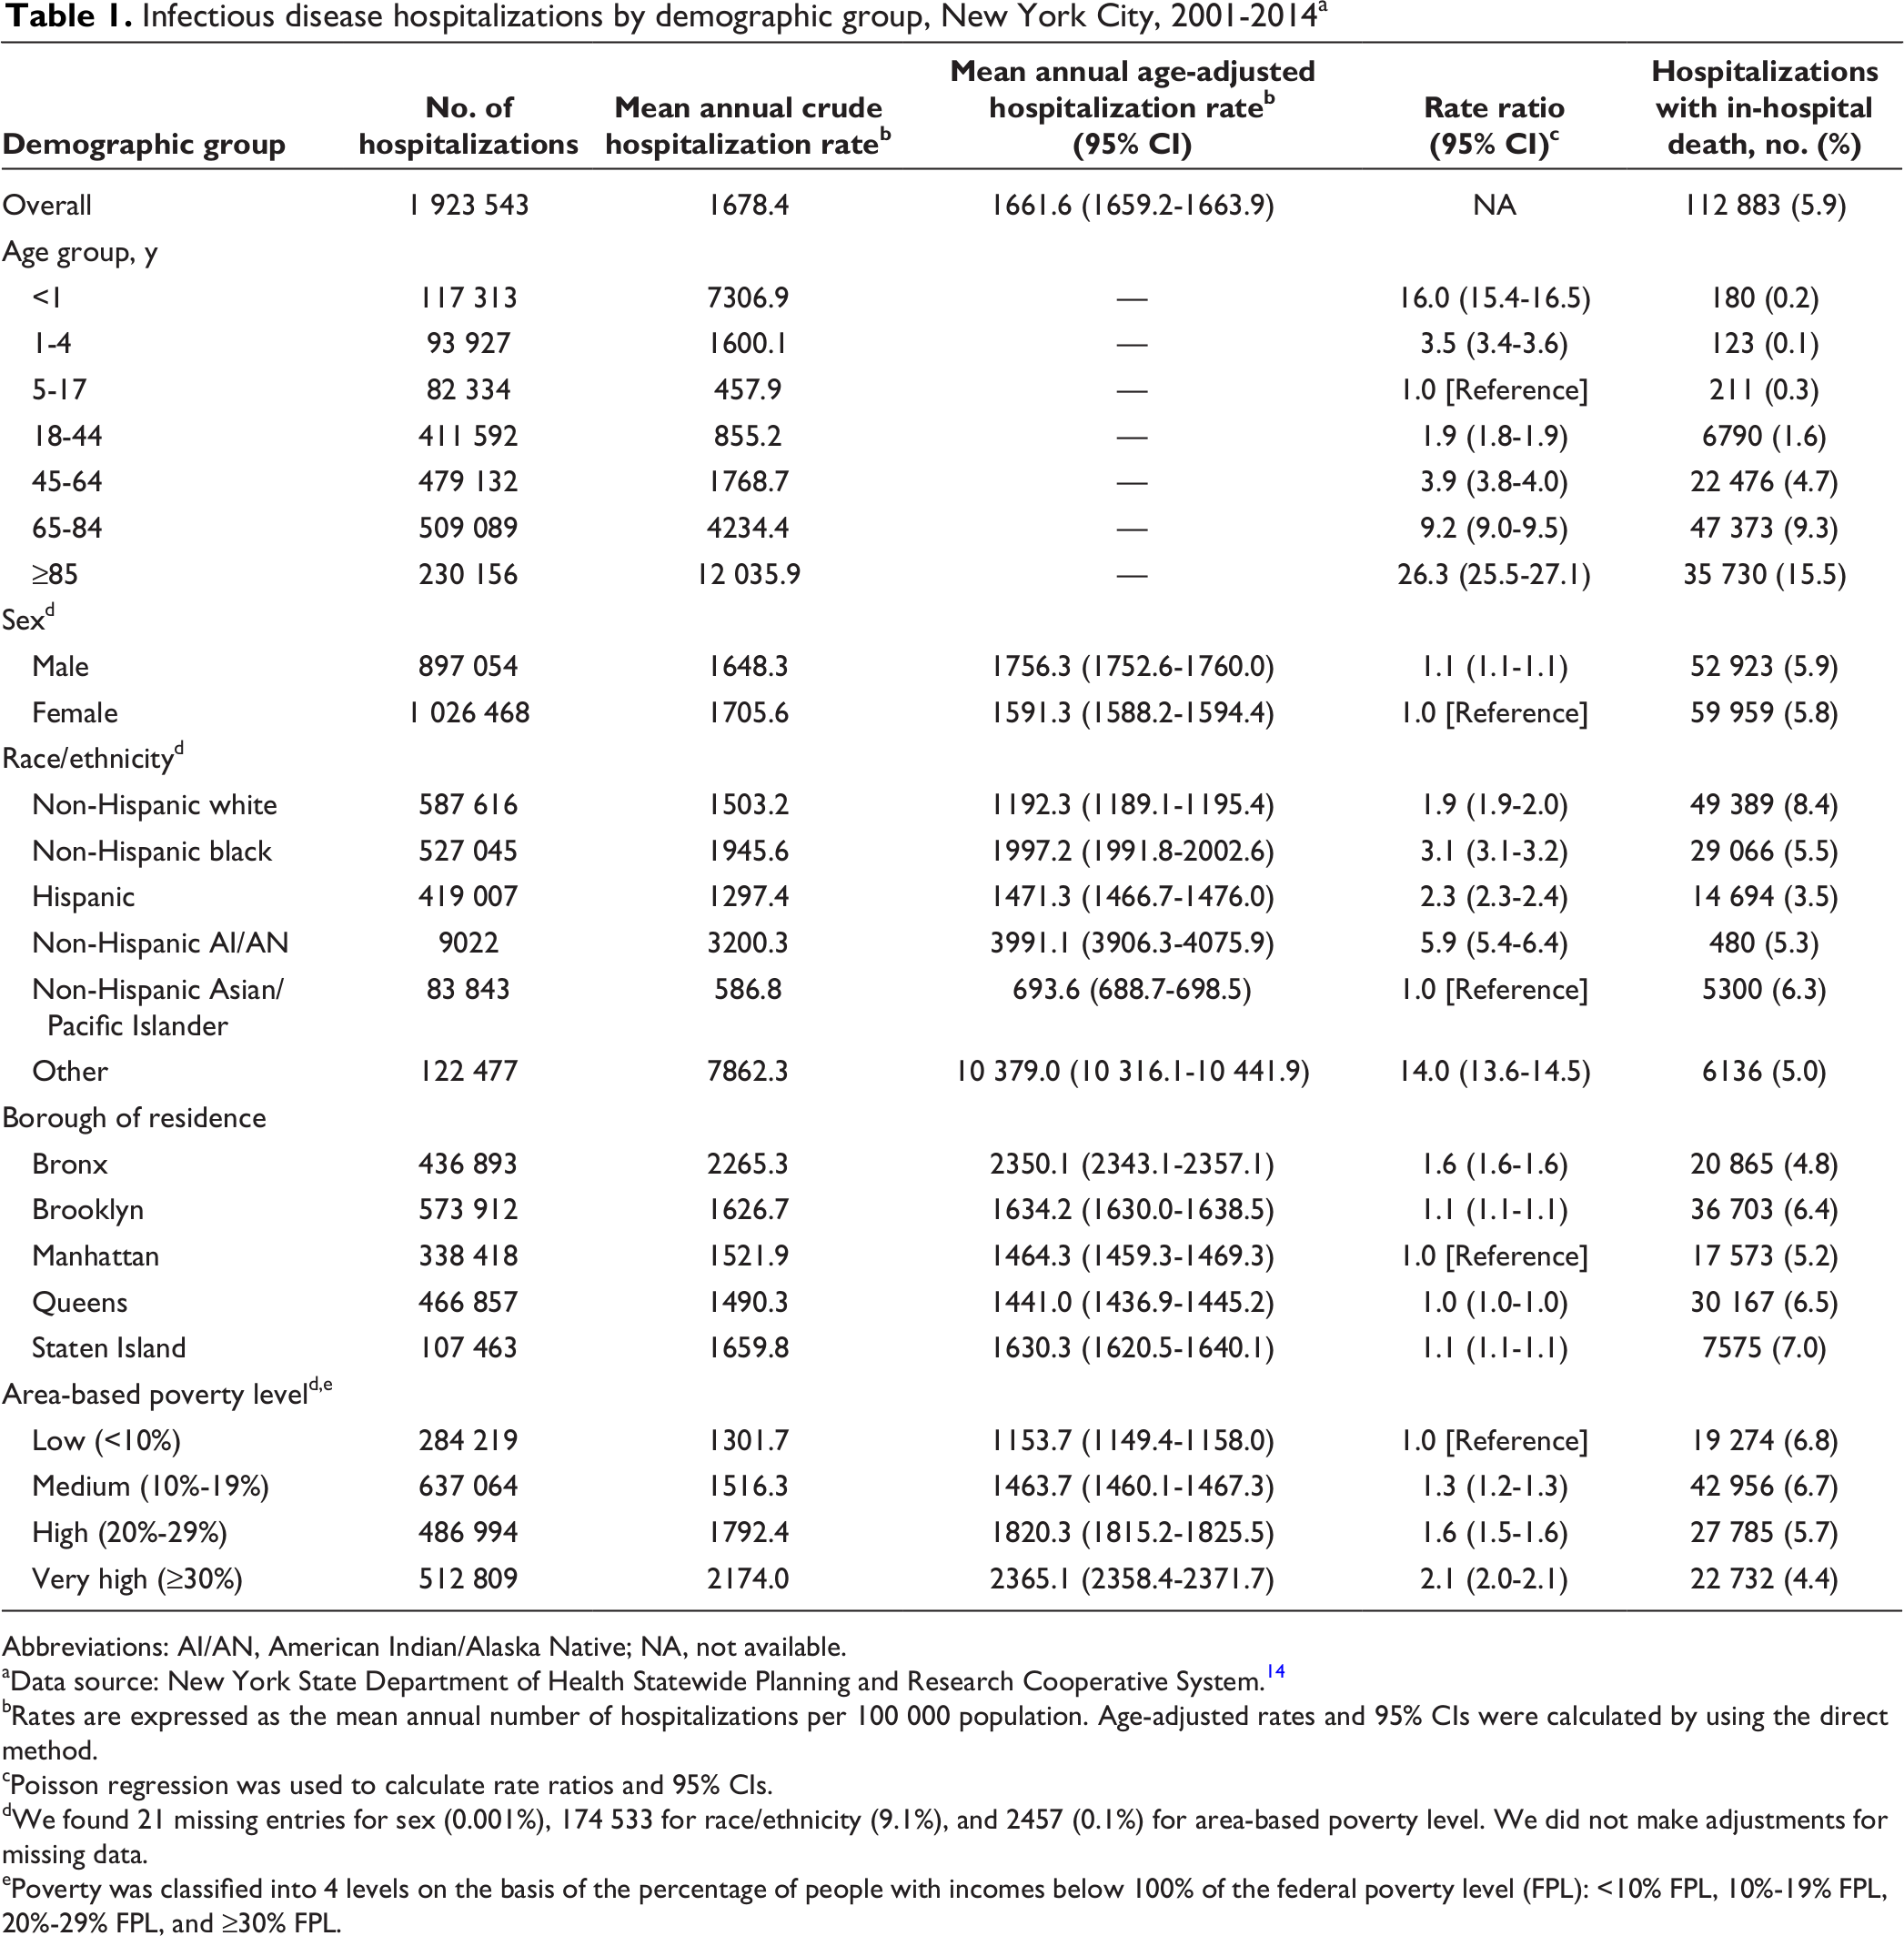
Abbreviations: AI/AN, American Indian/Alaska Native; NA, not available.
aData source: New York State Department of Health Statewide Planning and Research Cooperative System. 14
bRates are expressed as the mean annual number of hospitalizations per 100 000 population. Age-adjusted rates and 95% CIs were calculated by using the direct method.
cPoisson regression was used to calculate rate ratios and 95% CIs.
dWe found 21 missing entries for sex (0.001%), 174 533 for race/ethnicity (9.1%), and 2457 (0.1%) for area-based poverty level. We did not make adjustments for missing data.
ePoverty was classified into 4 levels on the basis of the percentage of people with incomes below 100% of the federal poverty level (FPL): <10% FPL, 10%-19% FPL, 20%-29% FPL, and ≥30% FPL.
Trend analysis for infectious disease hospitalizations by demographic group, New York City, 2001-2003 and 2012-2014 a
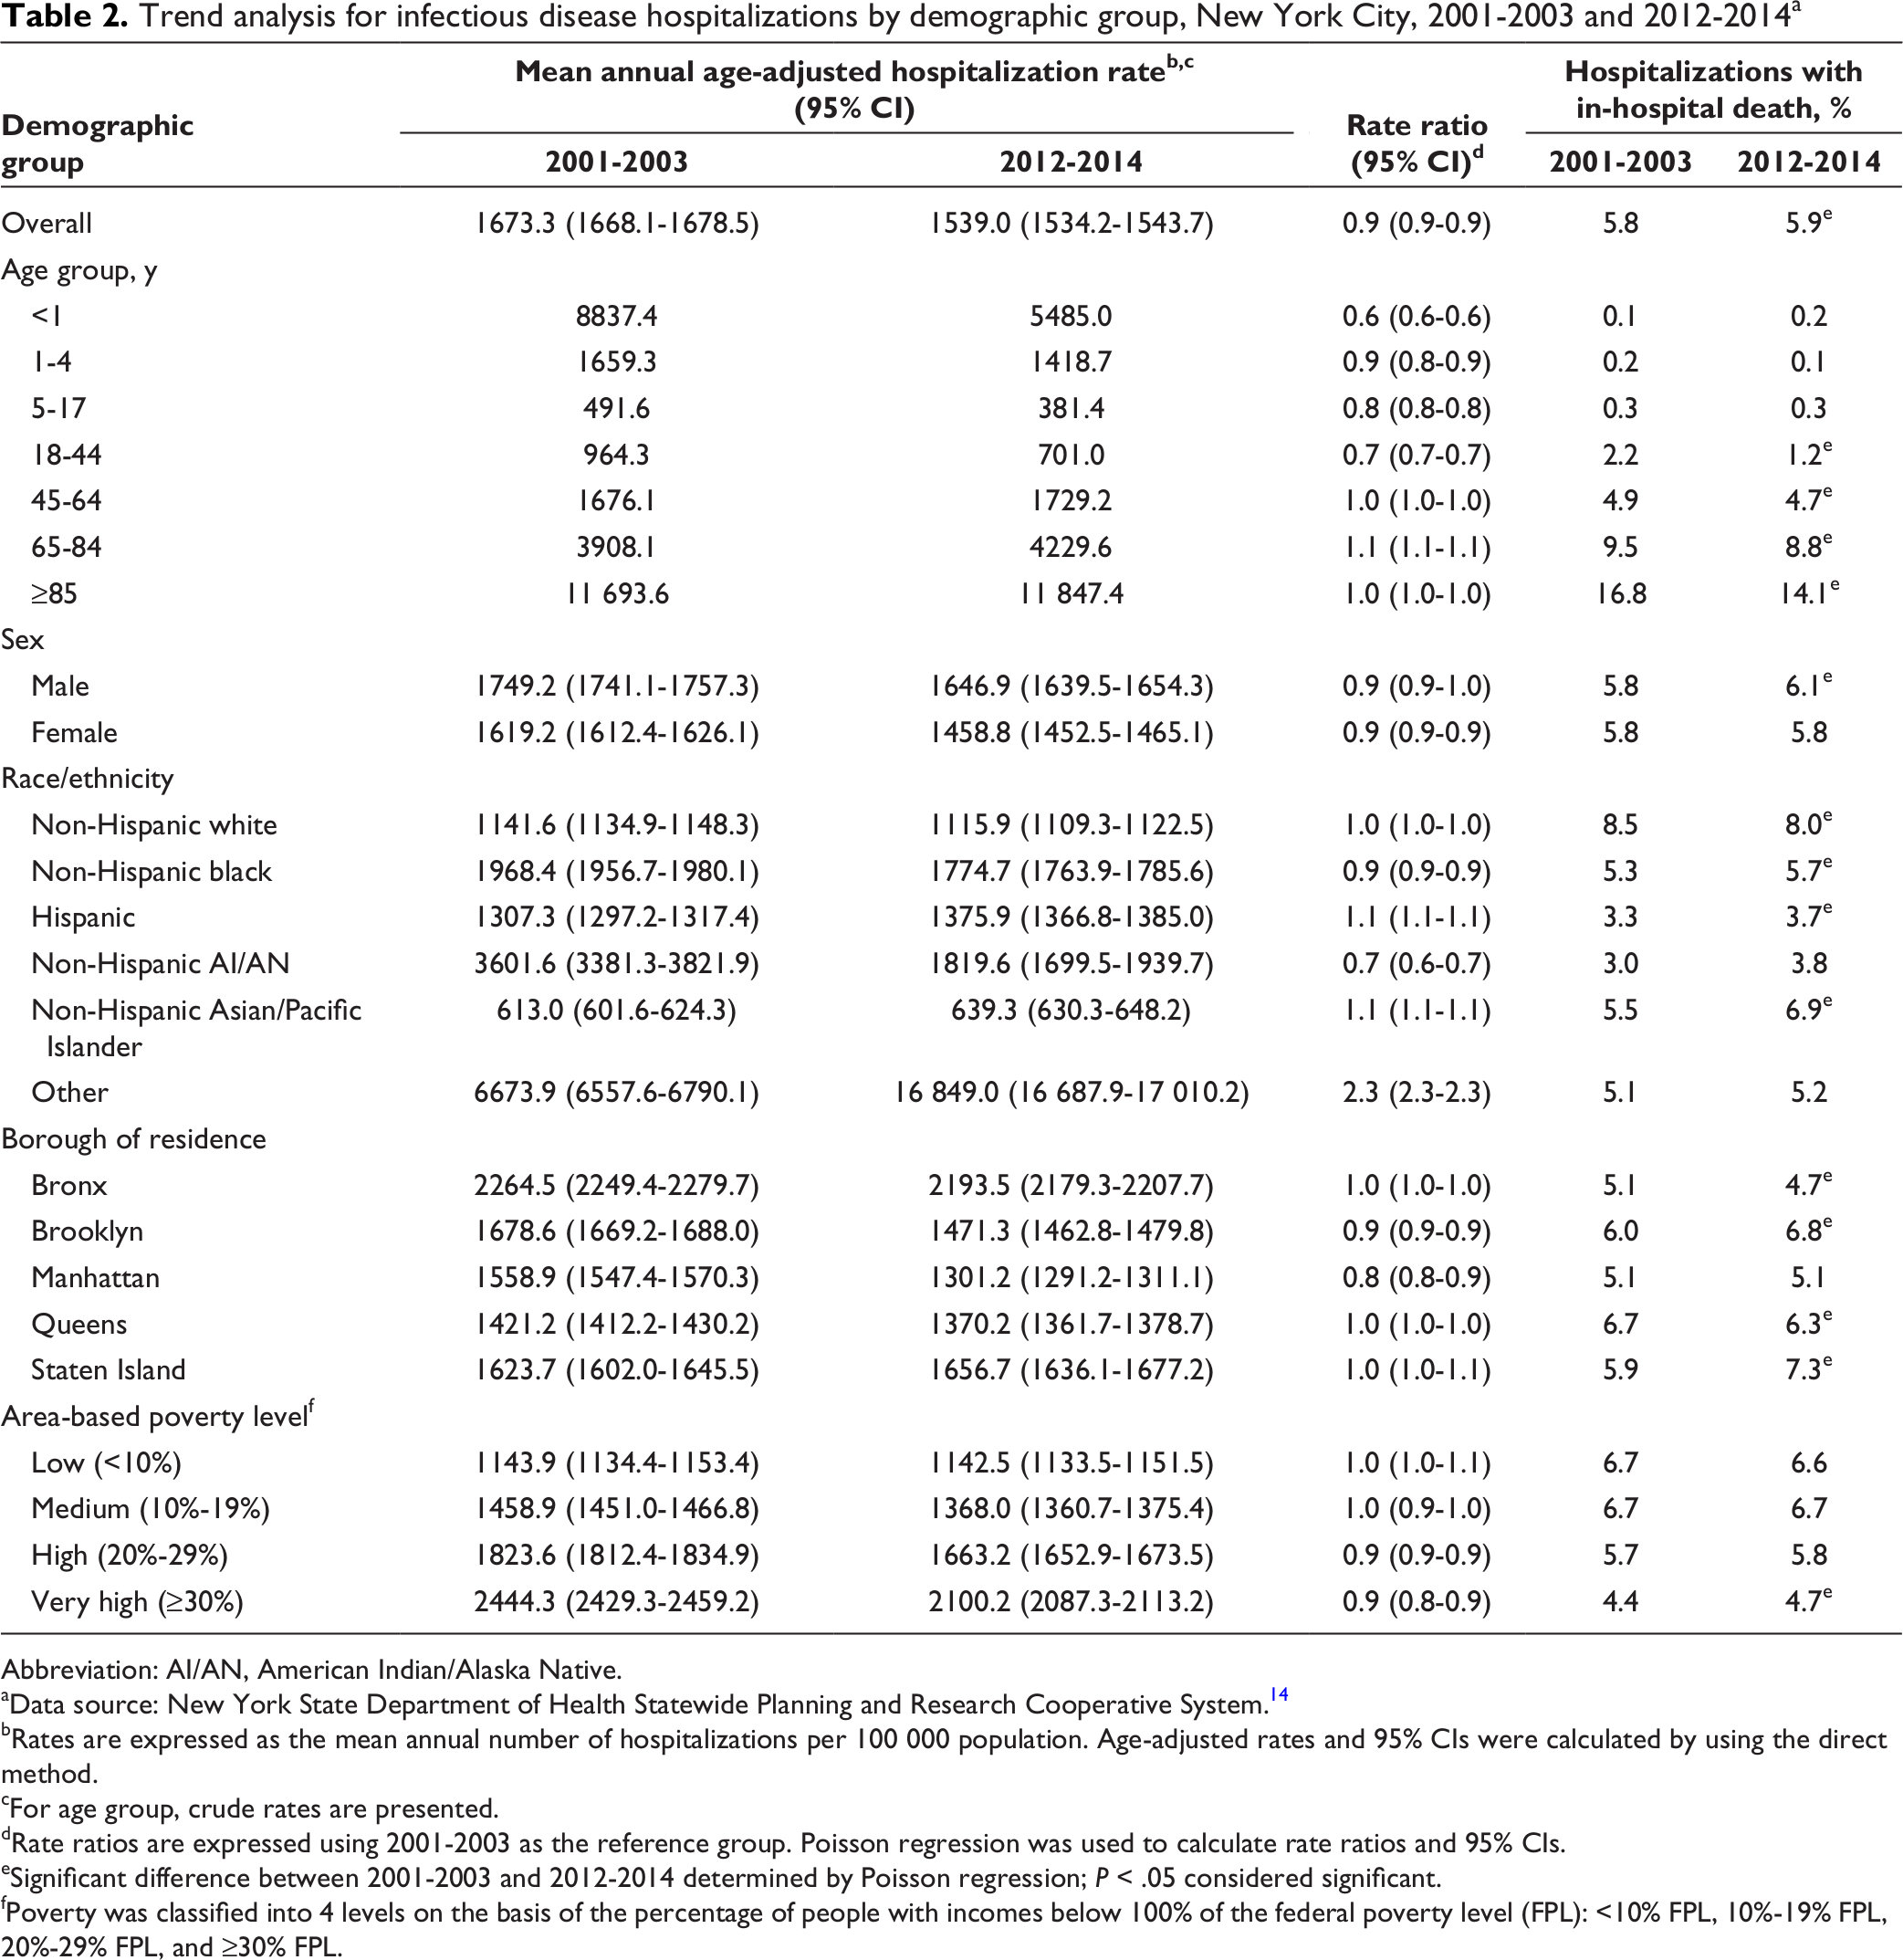
Abbreviation: AI/AN, American Indian/Alaska Native.
aData source: New York State Department of Health Statewide Planning and Research Cooperative System. 14
bRates are expressed as the mean annual number of hospitalizations per 100 000 population. Age-adjusted rates and 95% CIs were calculated by using the direct method.
cFor age group, crude rates are presented.
dRate ratios are expressed using 2001-2003 as the reference group. Poisson regression was used to calculate rate ratios and 95% CIs.
eSignificant difference between 2001-2003 and 2012-2014 determined by Poisson regression; P < .05 considered significant.
fPoverty was classified into 4 levels on the basis of the percentage of people with incomes below 100% of the federal poverty level (FPL): <10% FPL, 10%-19% FPL, 20%-29% FPL, and ≥30% FPL.
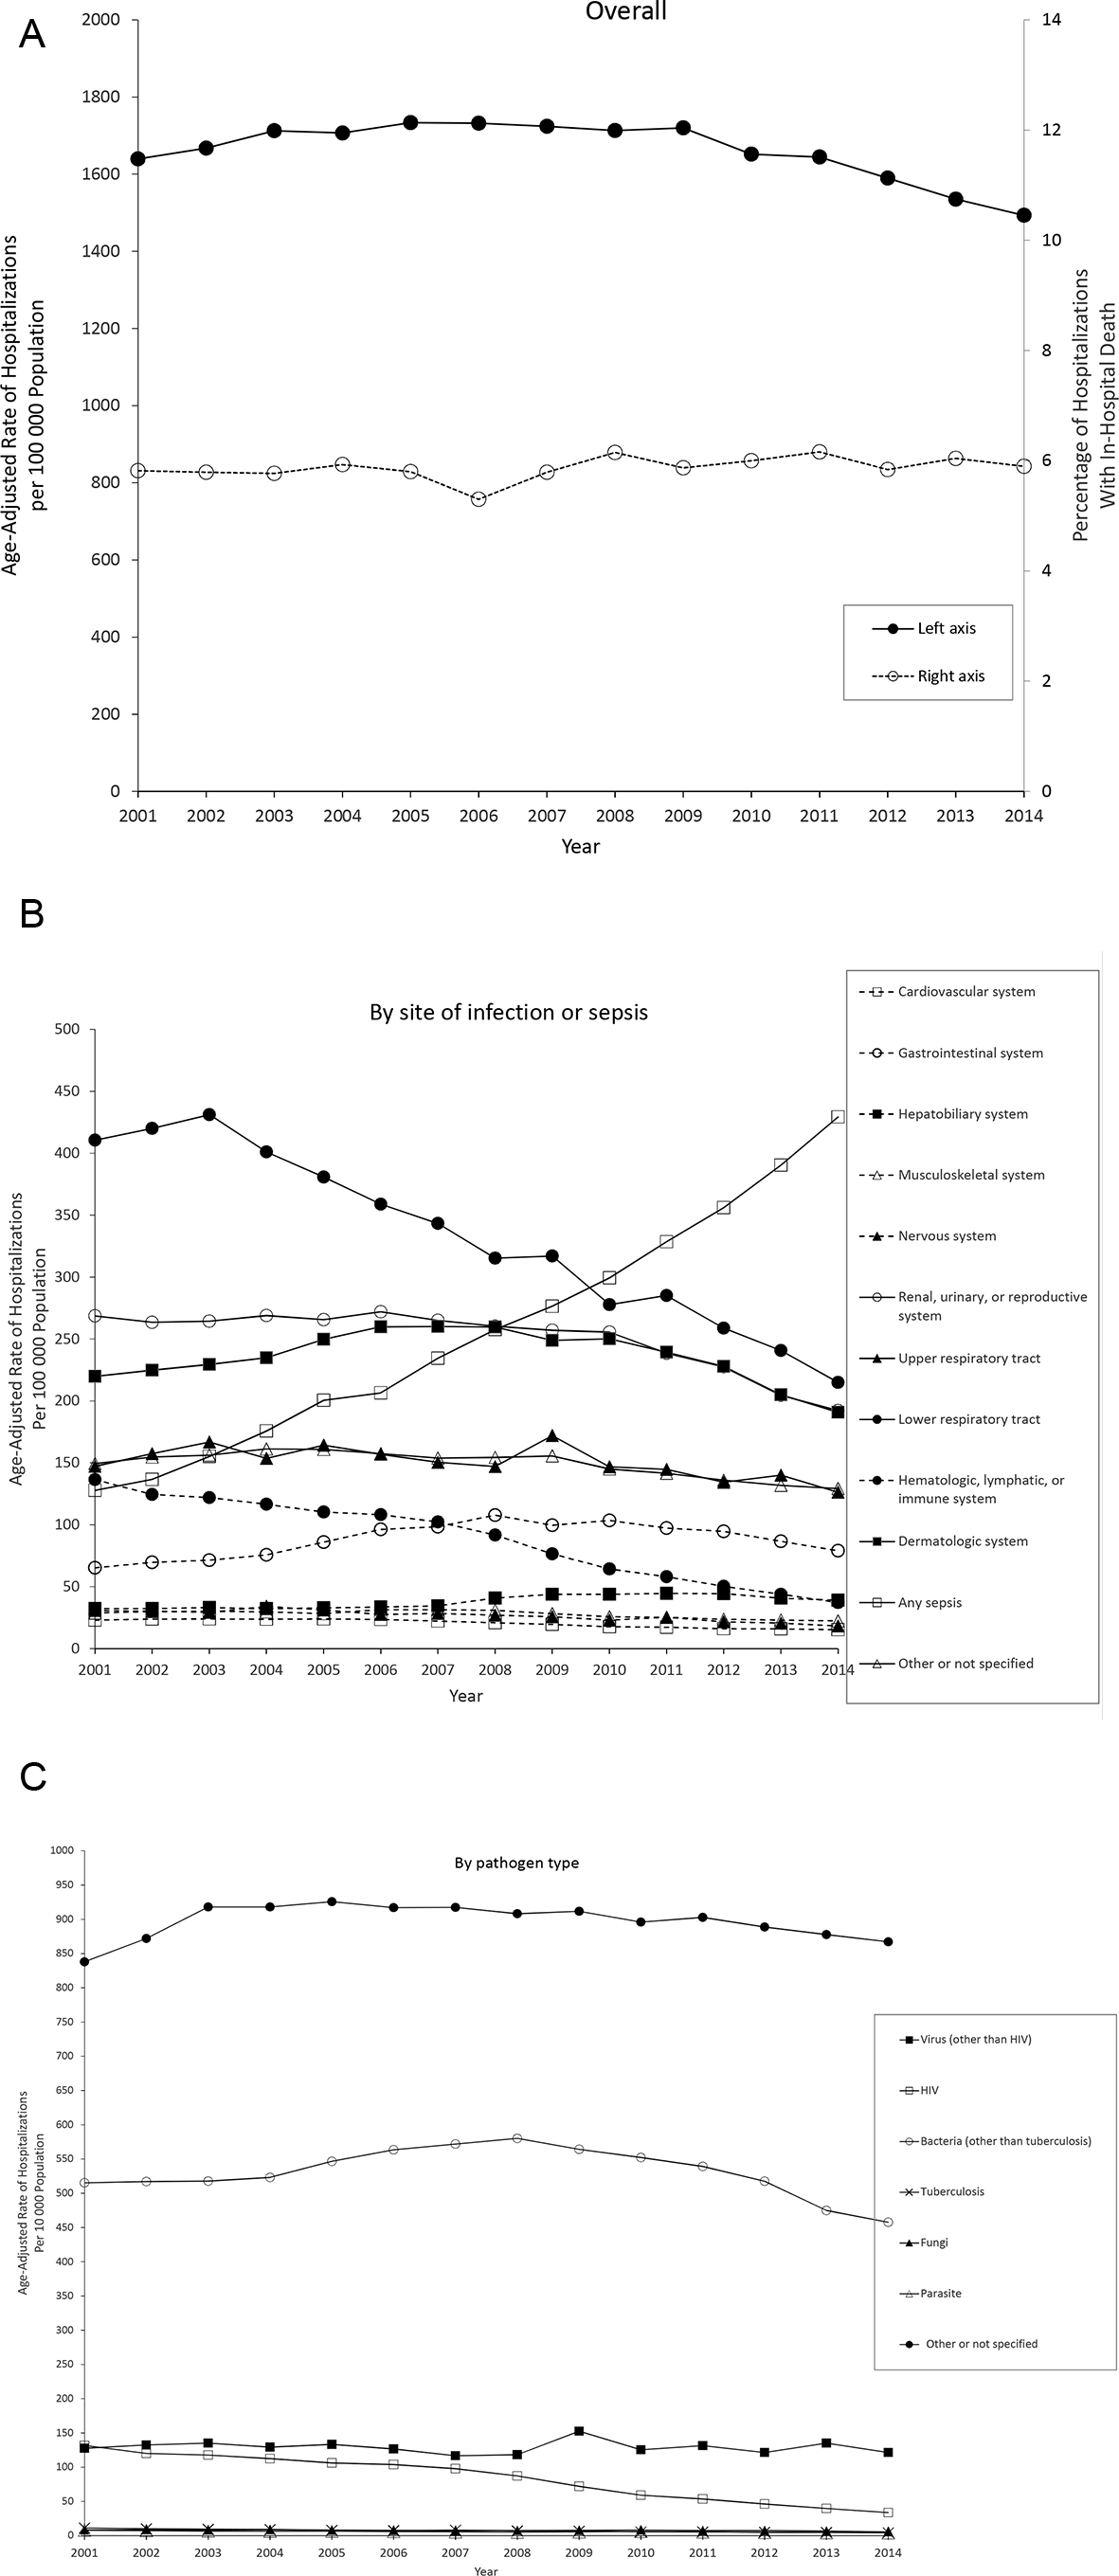
Annual age-adjusted rates of infectious disease hospitalizations, New York City, 2001-2014. (A) Overall. (B) By site of infection or sepsis. (C) By pathogen type. Data source: New York State Department of Health Statewide Planning and Research Cooperative System. 14
Leading Principal Diagnoses Among Infectious Disease Hospitalizations
The 10 most commonly listed principal diagnoses of infectious disease hospitalizations were pneumonia, organism unspecified (16.6% of hospitalizations); unspecified septicemia (9.7%); urinary tract infection (8.2%); other cellulitis and abscess of leg, except foot (6.5%); HIV (5.3%); other postoperative infection (2.4%); acute bronchiolitis due to other infectious organisms (1.7%); acute bronchitis (1.7%); unspecified viral infection (1.6%); and acute pyelonephritis without renal medullary necrosis (1.5%). In-hospital death occurred in 1 in 4 unspecified septicemia hospitalizations, and 41.3% of all infectious disease in-hospital deaths had a principal diagnosis of unspecified septicemia.
Infectious Disease Hospitalizations by Demographic Group
Mean annual age group–specific rates of infectious disease hospitalizations had a U shape as age increased, with a nadir for persons aged 5-17 (Table 1). Persons aged ≥85 had the highest mean annual infectious disease hospitalization rate (12 035.9 per 100 000 population) and the highest percentage of in-hospital death (15.5%) among all age groups. Mean annual rates of infectious disease hospitalizations decreased from 2001-2003 to 2012-2014 for groups aged <45, increased for the group aged 65-84, and did not change for groups aged 45-64 and ≥85 (Table 2). From 2001-2003 to 2012-2014, we found the largest decrease in mean annual rate of infectious disease hospitalization among persons aged <1 (RR, 0.6 [95% CI, 0.6-0.6]).
Female patients had a lower mean annual age-adjusted rate of infectious disease hospitalization per 100 000 population (1591.3 [95% CI, 1588.2-1594.4]) than male patients (1756.3 [95% CI, 1752.6-1760.0]) and a lower percentage of in-hospital death (5.8% vs 5.9%) (Table 1).
By race/ethnicity, the mean annual age-adjusted rates of infectious disease hospitalization were highest among non-Hispanic American Indian/Alaska Native, non-Hispanic black, and “other” persons and lowest among non-Hispanic Asian/Pacific Islander persons (Table 1). The percentage of in-hospital death was highest for non-Hispanic white persons (8.4%) and lowest for Hispanic persons (3.5%).
By borough, the Bronx had the highest mean annual age-adjusted rate of infectious disease hospitalization per 100 000 population (2350.1 [95% CI, 2343.1-2357.1]), and Queens had the lowest (1441.0 [95% CI, 1436.9-1445.2]). However, the Bronx had the lowest percentage of in-hospital death (4.8%), and Staten Island had the highest (7.0%) (Table 1).
By area-based poverty level, the mean annual age-adjusted rate of infectious disease hospitalization was lowest among persons in the lowest area-based poverty level group and highest among persons in the highest area-based poverty level group (Table 1). However, the lowest area-based poverty level group had the highest percentage of in-hospital death of all area-based poverty level groups.
Infectious Disease Hospitalizations by Site of Infection or Sepsis
By site of infection, the highest mean annual age-adjusted rates of hospitalization per 100 000 population occurred for the lower respiratory tract (329.3 [95% CI, 328.3-330.4] hospitalizations) and the lowest for the cardiovascular system (20.4 [95% CI, 20.1-20.6] hospitalizations) (Table 3, Figure B).
Infectious disease hospitalizations by site of infection or sepsis and pathogen type, New York City, 2001-2014 a
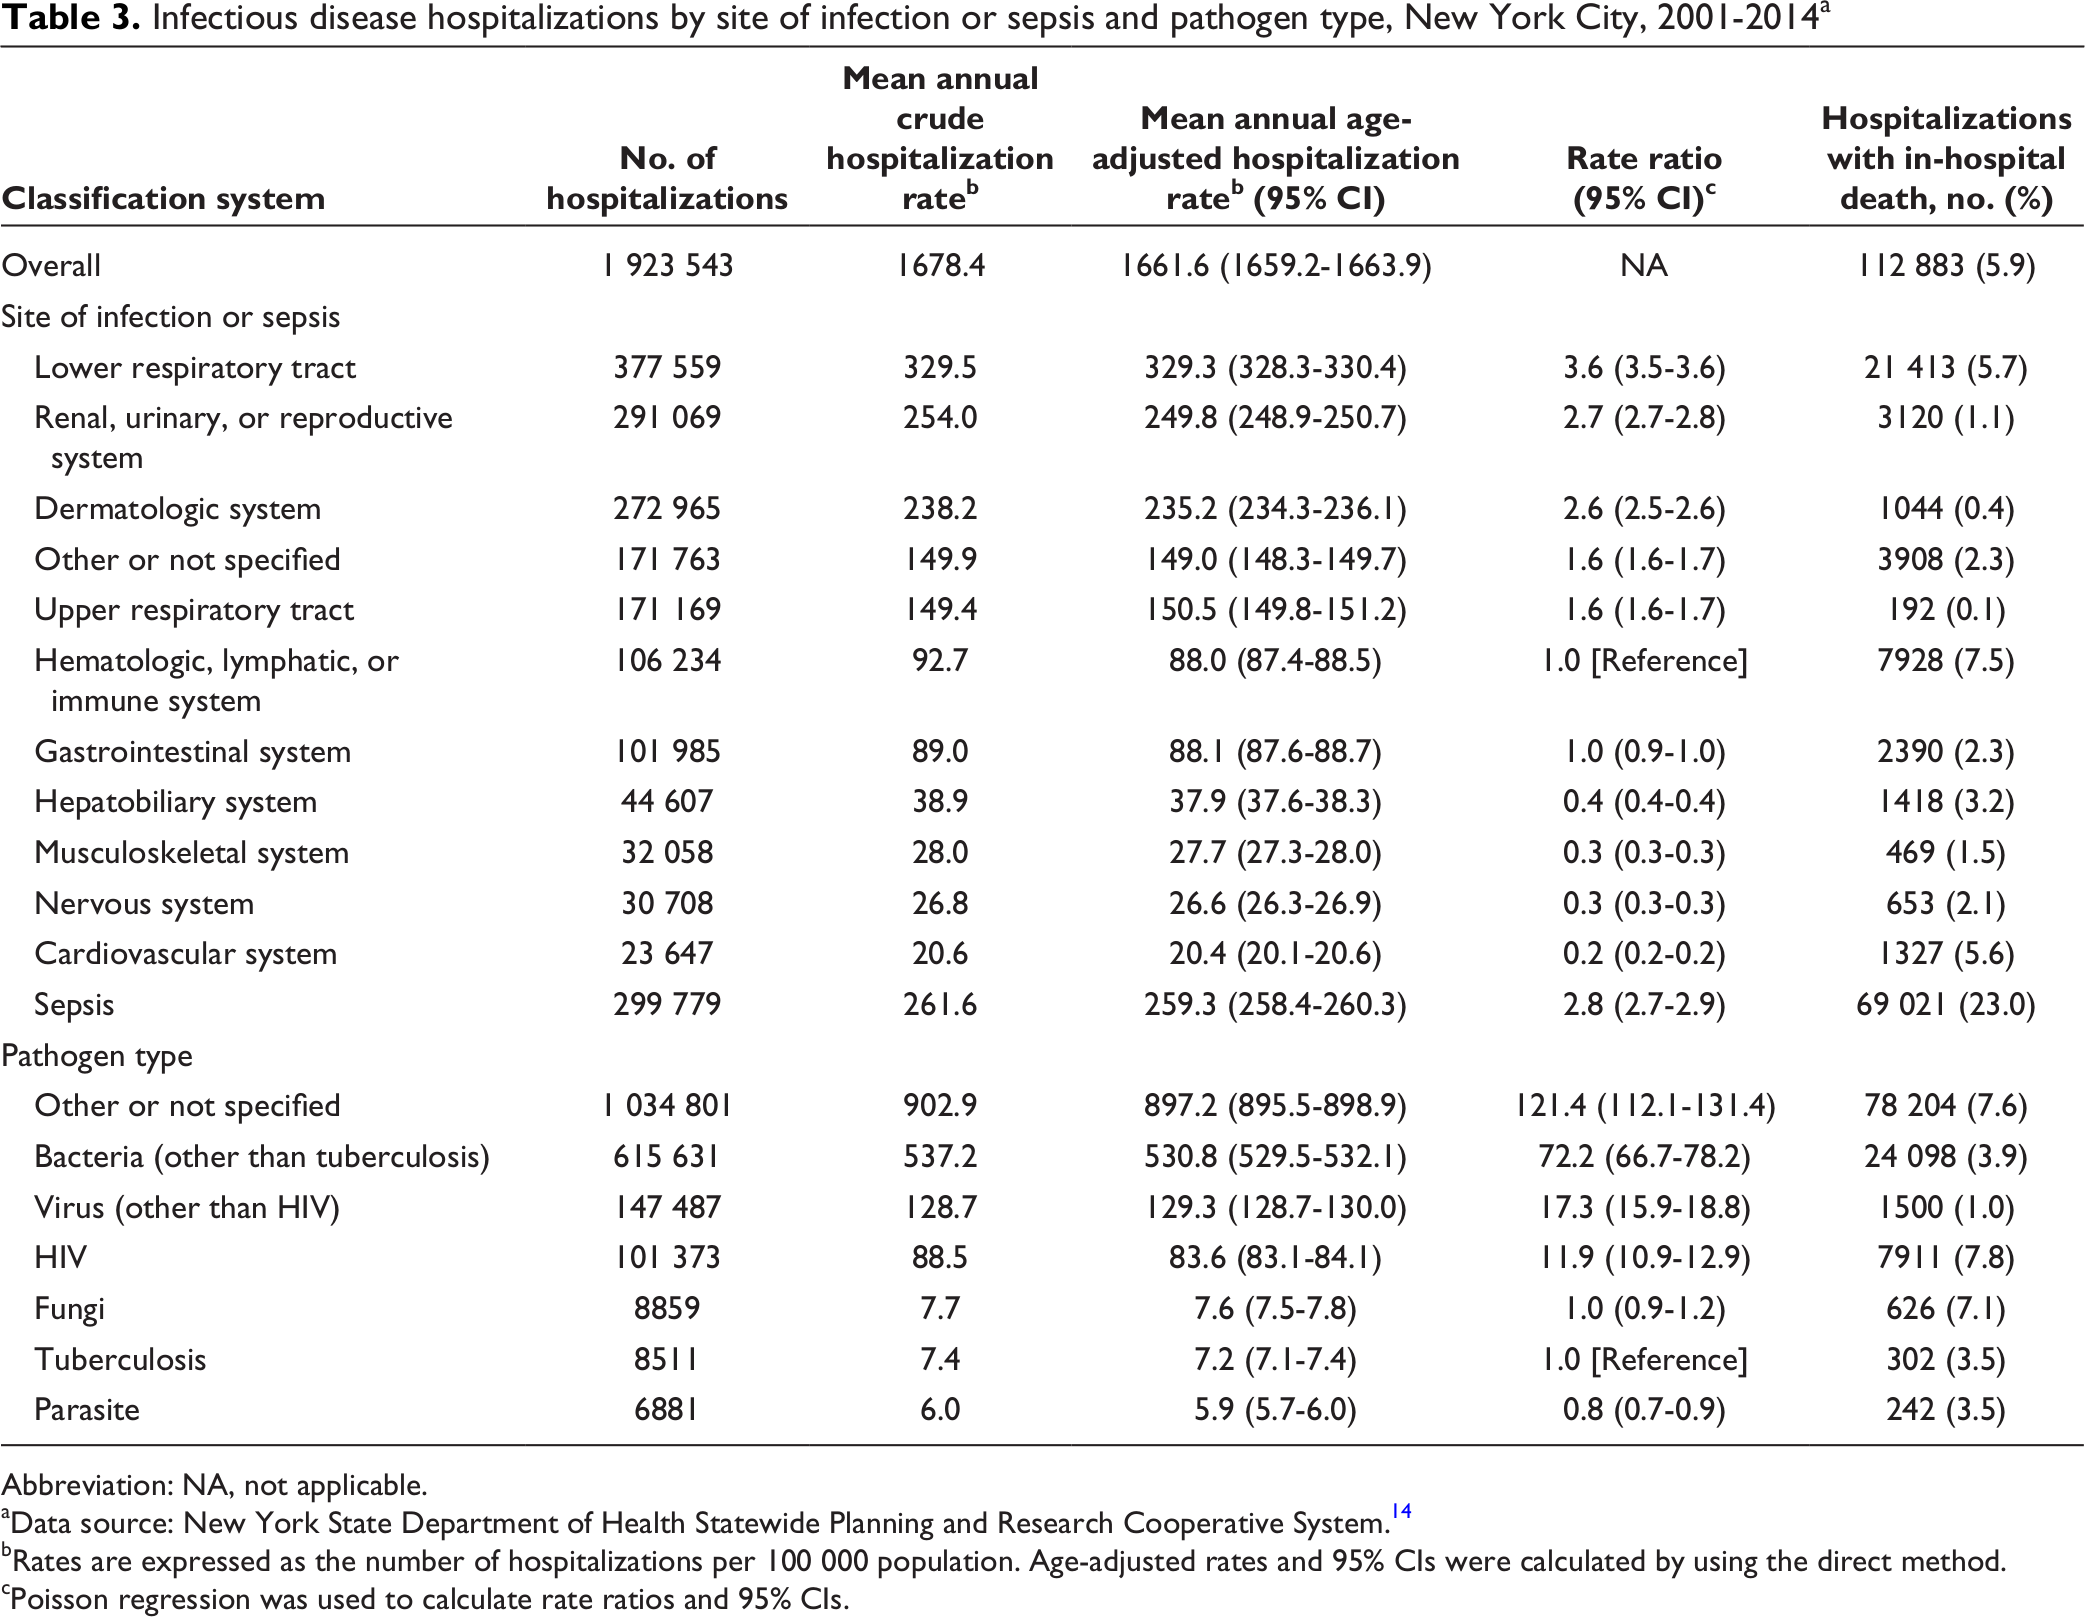
Abbreviation: NA, not applicable.
aData source: New York State Department of Health Statewide Planning and Research Cooperative System. 14
bRates are expressed as the number of hospitalizations per 100 000 population. Age-adjusted rates and 95% CIs were calculated by using the direct method.
cPoisson regression was used to calculate rate ratios and 95% CIs.
The mean annual age-adjusted rate of sepsis hospitalizations was 259.3 (95% CI, 258.4-260.3) per 100 000 population, the second highest among all sites of infection (Table 3). Sepsis had the highest percentage of in-hospital death (23.0%) of all sites of infection. The most common non-sepsis infectious disease secondary diagnoses among sepsis hospitalizations were urinary tract infection (38.7%) and pneumonia, organism unspecified (29.5%). Among sepsis hospitalizations, the percentage of in-hospital death was highest for the non-sepsis infectious disease secondary diagnoses of pneumonia, organism unspecified (29.4%), and intestinal infection due to Clostridium [Clostridioides] difficile (28.6%).
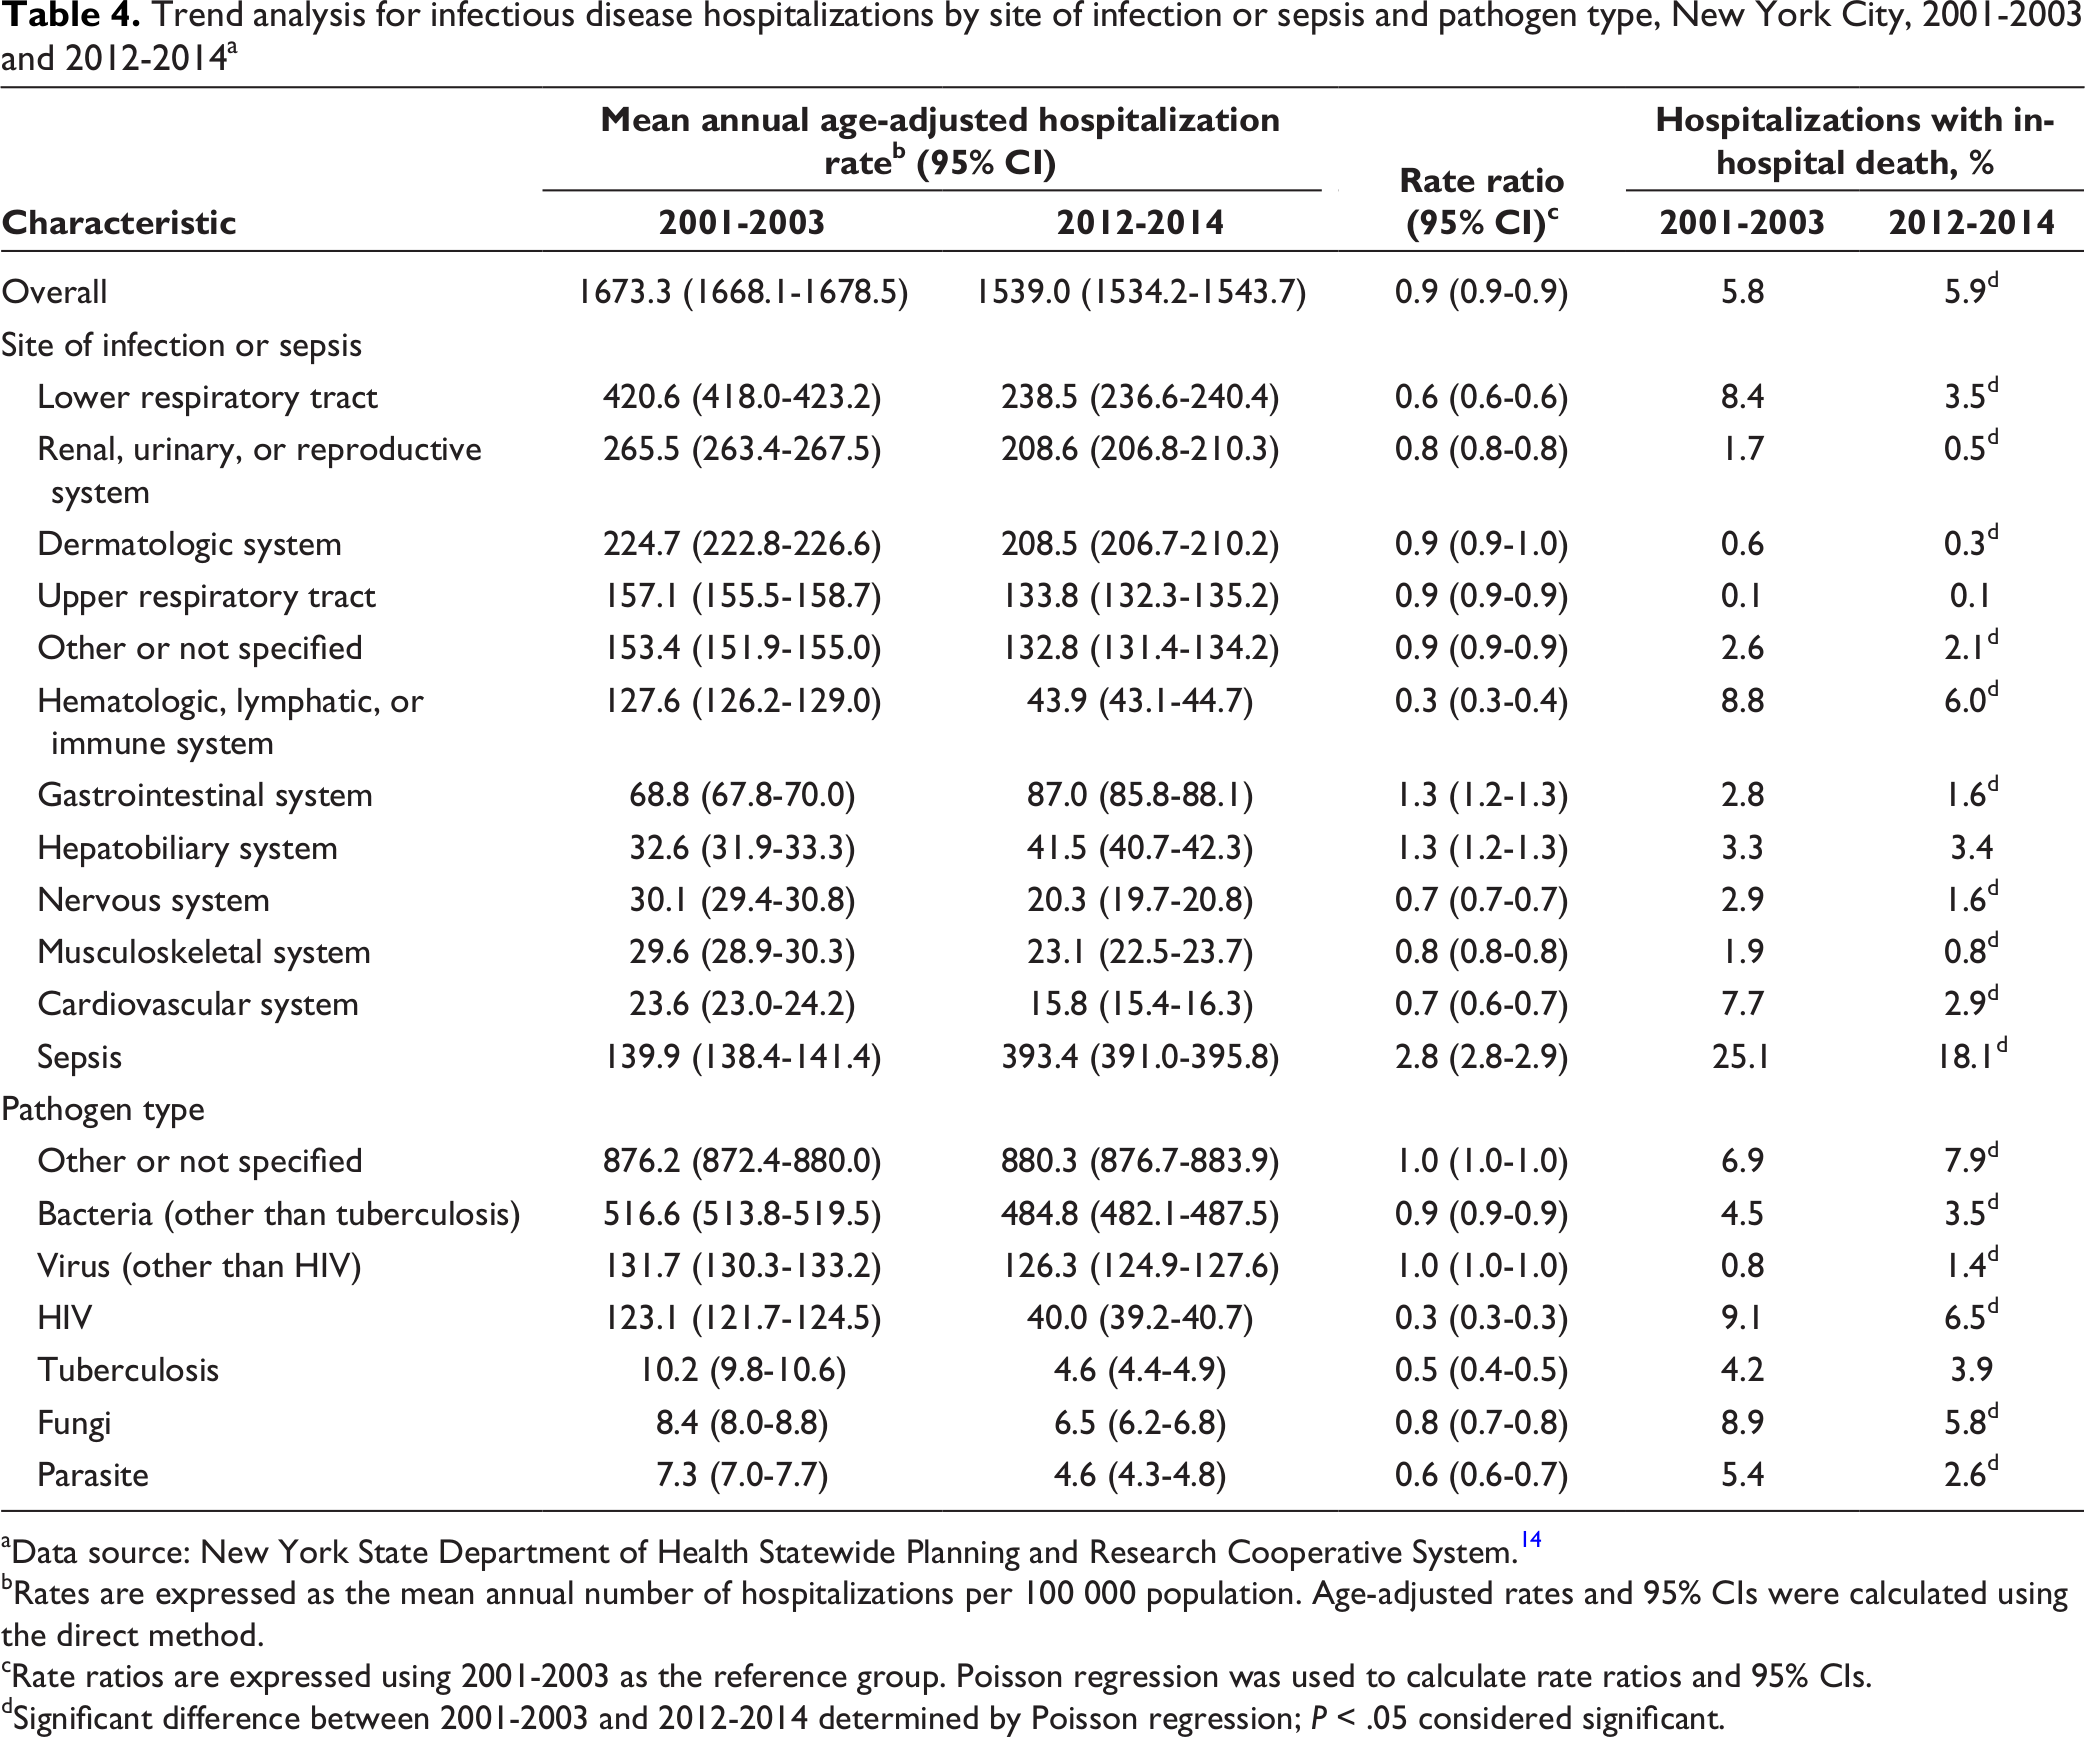
The mean annual age-adjusted rate of infectious disease hospitalization increased from 2001-2003 to 2012-2014 for infectious disease hospitalization due to sepsis (RR = 2.8 [95% CI, 2.8-2.9]), gastrointestinal system (RR = 1.3 [95% CI, 1.2-1.3]), and hepatobiliary system (RR = 1.3 [95% CI, 1.2-1.3]) (Table 4). The mean annual age-adjusted rate of infectious disease hospitalization decreased from 2001-2003 to 2012-2014 for all other sites of infection except the dermatologic system, for which the rate did not change. The percentage of in-hospital death decreased for all sites of infection from 2001-2003 to 2012-2014, except for the hepatobiliary system and upper respiratory tract, which remained unchanged.
Trend analysis for infectious disease hospitalizations by site of infection or sepsis and pathogen type, New York City, 2001-2003 and 2012-2014 a
aData source: New York State Department of Health Statewide Planning and Research Cooperative System. 14
bRates are expressed as the mean annual number of hospitalizations per 100 000 population. Age-adjusted rates and 95% CIs were calculated using the direct method.
cRate ratios are expressed using 2001-2003 as the reference group. Poisson regression was used to calculate rate ratios and 95% CIs.
dSignificant difference between 2001-2003 and 2012-2014 determined by Poisson regression; P < .05 considered significant.
Infectious Disease Hospitalizations by Pathogen Type
The pathogen types that occurred at the highest mean annual age-adjusted rates of hospitalization per 100 000 population were “other or not specified” (897.2 [95% CI, 895.5-898.9]) and bacteria (other than tuberculosis) (530.8 [95% CI, 529.5-532.1]); the lowest rate occurred for parasite (5.9 [95% CI, 5.7-6.0]) (Table 3, Figure C). The most commonly listed infectious disease diagnoses among “other or not specified” pathogen type hospitalizations were pneumonia, organism unspecified, and unspecified septicemia, which accounted for 30.8% and 18.0% of “other or not specified” pathogen type hospitalizations, respectively. The percentage of in-hospital death was highest for infectious disease hospitalization for HIV infection (7.8%) and lowest for virus (other than HIV infection) (1.0%).
The mean annual age-adjusted hospitalization rate for virus (other than HIV infection) and “other or not specified” pathogen type did not change from 2001-2003 to 2012-2014 (RR = 1.0 [95% CI, 1.0-1.0]) but declined for all other pathogen types (most notably for HIV infection and tuberculosis). The percentage of in-hospital deaths increased from 2001-2003 to 2012-2014 for infectious disease hospitalizations attributed to virus (other than HIV infection) and “other or not specified” pathogen type but declined or stayed the same for all other pathogen types (Table 4).
Discussion
This study describes infectious disease hospitalizations in New York City during 2001-2014. Rates of infectious disease hospitalizations decreased slightly from the beginning to the end of the study period, and the percentage of in-hospital deaths increased slightly. Furthermore, lower respiratory tract infections (specifically, pneumonia) and sepsis stood out among all sites of infection, in terms of both their high incidence and the percentage of in-hospital death. We found evidence that hospitalization rates for HIV infection and tuberculosis improved over time. 20,21
Although we observed that the mean annual rate of all infectious disease hospitalizations declined from the beginning to the end of the study period, the percentage of in-hospital deaths among them increased. The magnitude of these changes was small, and given the observational nature of SPARCS, the data we present cannot be used to draw definitive conclusions. Of note, however, is that the mean annual rate of infectious disease hospitalizations during the study period was higher in New York City than it was during the same period in the United States (1661.6 vs 1468.2 per 100 000 population). 22 Furthermore, the percentage of in-hospital death among infectious disease hospitalizations was higher in New York City than in the United States during this same period (5.9% vs 4.2%). Factors that may contribute to these differences between New York City and the United States include the high population density of New York City and high mobility of the New York City population (including international travel). 10 However, our data do not confirm whether true differences in infectious disease epidemiology exist between New York City and the United States, and caution should be taken when comparing these findings. For example, the methods by which other jurisdictions compile discharge data may differ from methods in New York City, thereby affecting aggregate estimates of infectious disease hospitalizations in those jurisdictions. Further investigation into rates of infectious disease hospitalizations and outcomes during these hospitalizations in New York City is therefore warranted. Further investigation should include such factors as the settings in which infectious diseases are acquired, risk factors for infection, and infectious disease transmission patterns in New York City.
We observed health disparities by race/ethnicity and socioeconomic status. The factors that drive such health disparities may include the limited access to primary and preventive health care, quality of health care received, and social and physical environmental conditions. 23 Advancing racial/ethnic equity across New York City to decrease health disparities is an area of increasing attention. 24 This study also showed that, among all racial/ethnic groups, non-Hispanic white persons had the highest proportion of deaths during infectious disease hospitalizations. The reasons for this disparity are unclear, but they may be related to comorbidities such as chronic liver disease and opioid use. 25 -27
The lower respiratory tract was the most commonly listed site of infection among infectious disease hospitalizations, largely driven by pneumonia (1 in 6 infectious disease hospitalizations listed pneumonia, organism unspecified, as the principal diagnosis). Furthermore, pneumonia, organism unspecified, was listed as a secondary diagnosis in nearly one-third of infectious disease hospitalizations with a principal diagnosis of sepsis. Although the rate of lower respiratory tract infectious disease hospitalizations in New York City was slightly lower than in the United States (329.3 vs 367.9 per 100 000 population), the percentage of in-hospital deaths among these hospitalizations was higher in New York City than in the United States (5.7% vs 4.0%). 22 These findings are consistent with data documenting that pneumonia is a leading cause of death in New York City and that the reported pneumonia death rate is higher in New York City than in the United States. 28 -30 Differences in hospitalization rates and percentage of in-hospital deaths associated with lower respiratory tract infection (specifically, pneumonia) between New York City and the United States, however, should be interpreted with caution. Just as with overall infectious diseases, these data are based on hospital discharge data, and any observed differences between New York City and the United States may reflect artifact. Regardless, lower respiratory tract infections are an important cause of morbidity in New York City, just as in many other jurisdictions, and further investigation into the risk of pneumonia and outcomes from pneumonia in New York City is warranted.
Sepsis stood out among all sites of infection. The rate of sepsis hospitalizations nearly tripled from the beginning to the end of the study period, likely because of changes in discharge coding practices during the study period that favored listing of sepsis as the principal diagnosis over other infectious diseases and improved awareness about sepsis. 31 (In a secondary analysis not described here, the rate of increase for listing of sepsis as a secondary diagnosis from 2001-2003 to 2012-2014 was similar to the rate of increase for listing of sepsis as a principal diagnosis.) These coding practices presumably have led to a dilution effect in which patients with less severe illness are increasingly given a principal diagnosis of sepsis, which potentially explains why the percentage of in-hospital deaths decreased among sepsis hospitalizations from the beginning to the end of the study period. Indeed, that hospital discharge data are a poor means of tracking sepsis is well documented. 32 Nevertheless, it is concerning, though perhaps not surprising, that in-hospital death occurred in nearly one-quarter of reported sepsis hospitalizations during the study period. Furthermore, although the rate of sepsis hospitalizations was similar between New York City and the United States during the study period (259.3 and 240.6 per 100 000 population, respectively), the percentage of in-hospital deaths was higher in New York City than in the United States (23.0% vs 14.9%). 22 Trends and outcomes in sepsis in New York City warrant further monitoring, including using data sets beyond hospital discharge data, especially in light of the recently passed regulations for sepsis care in New York State. 33,34
We note several findings by pathogen type. The pathogen type with the highest hospitalization rate was “other or not specified,” and the diagnoses of pneumonia, organism unspecified, and unspecified septicemia accounted for nearly 50% of these “other or not specified” pathogen type hospitalizations. The only pathogen type with a higher percentage of in-hospital deaths than “other or not specified” was HIV infection. We observed a large reduction in both the mean annual hospitalization rate and percentage of in-hospital deaths for HIV infection from the beginning to the end of the study period, likely related to the widespread availability of antiretroviral therapy and guidelines recommending treatment for HIV infection regardless of stage. 35 We also observed that the mean annual hospitalization rate for tuberculosis halved from 2001-2003 to 2012-2014, which likely reflects improved management of HIV infection through antiretroviral therapy and successful management of tuberculosis with directly observed therapy. 36
Limitations
This study had several limitations. First, hospital discharge data, the basis for this study, are subject to bias and other pressures that might affect discharge coding practices over time, such as reimbursement rates. 31,37 Second, we did not verify the accuracy of the discharge records in SPARCS. In particular, data on race/ethnicity in SPARCS should be interpreted with caution, and the high proportion of missing data on race/ethnicity might have affected the data stratified by race/ethnicity. Third, we used a narrow definition for an infectious disease hospitalization that focused on principal diagnosis; therefore, we did not capture data on other hospitalizations during which a patient might have undergone treatment for an infectious disease if those hospitalizations did not list the infectious disease as the principal diagnosis. That said, the principal diagnosis refers to “the condition established after study to be chiefly responsible for occasioning the admission of the patient to the hospital for care”; therefore, the definition of an infectious disease hospitalization used in our study may be more specific than a definition that includes secondary diagnoses for infectious diseases. 22 Fourth, our study did not provide information about the setting in which an infectious disease was acquired (eg, whether an infectious disease hospitalization was related to a hospital-acquired infection). Finally, our study included only inpatient data and no outpatient data.
Conclusion
Our study highlights the morbidity and mortality among New York City residents attributed to infectious diseases. Rates of hospitalization for infectious diseases such as HIV infection and tuberculosis declined, and prevention of infections that lead to sepsis would likely decrease the overall rate of infectious disease hospitalizations in New York City.
Footnotes
Appendix
Categorization of ICD-9-CM codes for infectious diseases by site of infection or sepsis used to evaluate infectious disease hospitalizations, New York City, 2001-2014
Acknowledgments
The findings and conclusions in this article are those of the authors and do not necessarily represent the official position of the Centers for Disease Control and Prevention or the New York City Department of Health and Mental Hygiene.
Authors’ Note
The following supplementary tables are available from the authors: the 10 most commonly listed principal diagnoses among infectious disease hospitalizations, the 10 leading non-sepsis infectious disease secondary diagnoses for hospitalizations with a principal diagnosis of sepsis, and the 10 most commonly listed infectious disease diagnoses within the “other or not specified” category by site of infection and pathogen type, New York City, 2001-2014. Each table provides the ICD-9-CM code, diagnosis, number (%) of hospitalizations, mean annual age-adjusted hospitalization rate (95% CI), and number (%) of hospitalizations with in-hospital death.
Declaration of Conflicting Interests
The authors declared no potential conflicts of interest with respect to the research, authorship, and/or publication of this article.
Funding
The authors received no financial support for the research, authorship, and/or publication of this article.