
Abstract
Objectives
HIV testing identifies persons living with HIV and can lead to treatment, decreased risk behaviors, and reduced transmission. The objective of our study was to describe state-level trends in HIV testing in the general US adult population aged 18-64 years, for both ever tested for HIV and tested for HIV in the previous 12 months.
Methods
Using 2011-2017 Behavioral Risk Factor Surveillance System data, we estimated the percentage of the state population, plus the District of Columbia, aged 18-64 years ever tested for HIV and tested for HIV in the previous 12 months. The 50 states and the District of Columbia were grouped according to the estimated prevalence of HIV in 2011. We used orthogonal contrasts to calculate P values for linear trends.
Results
The percentage of the population ever tested for HIV increased significantly in 23 states during 2011-2017, whereas the percentage tested for HIV in the previous 12 months increased significantly in 8 states. In 2017, the mean percentage ever tested for HIV in states with a high prevalence of HIV was 8.6 percentage points higher than the mean percentage in states with a low prevalence of HIV (48.5% vs 39.9%); the mean increase in the percentage ever tested was highest (11.4%) in states with a low prevalence of HIV.
Conclusion
Enhanced efforts by states to make HIV testing simple, accessible, and routine are needed to reduce the number of persons who are not aware of their infection.
Approximately 1.1 million persons are living with HIV infection in the United States, of whom 86% have received a diagnosis and are aware of their HIV infection. 1 The percentage of persons aware of their HIV infection (with relative standard error <30%) varies across the 50 states and the District of Columbia, ranging from 81.8% in Louisiana to 92.4% in Pennsylvania. 1 Overall, persons living with undiagnosed HIV infection account for approximately 38% of HIV transmissions. 2 HIV testing is key to reducing HIV transmissions, by increasing awareness of HIV serostatus that can lead to treatment, decreased risk behaviors, and viral suppression. 3 -8 A key strategy in the proposed initiative, Ending the HIV Epidemic: A Plan for America, is to diagnose all HIV infections as early as possible by making HIV testing simple, accessible, and routine. 9
In 2006, the Centers for Disease Control and Prevention (CDC) released revised recommendations for HIV testing, which recommended screening for persons aged 13-64 years at least once in health care settings (ie, routine HIV screening) and at least yearly screening for persons at increased risk of HIV infection (eg, gay, bisexual, and other men who have sex with men [MSM]; persons who inject drugs). 7 Routine HIV screening is more effective than risk-based testing in identifying persons with HIV, results in earlier diagnosis of HIV infection, and destigmatizes HIV testing. 7,10,11 In 2013, the US Preventive Services Task Force (USPSTF) revised its HIV testing recommendation to include routine HIV screening of all adolescents and adults aged 15-65 years, thus more closely aligning with CDC recommendations. 12 This revision was an important change insofar as private and public health insurers base their coverage and payments on USPSTF recommendations. 12
Implementation of routine HIV screening in health care settings is not consistent across states. For example, at the end of January 2011, 5 states had laws that were not compatible with CDC’s recommendation for routine HIV screening. 13 In 2014, only 1 state had incompatible laws, and these laws became compatible in early 2018. 14 As of 2014, 34 states and the District of Columbia covered routine HIV screening under their Medicaid programs. 15 In a comparison of states that had expanded Medicaid by December 2015 with states that had not expanded Medicaid, the probability of an HIV test increased by 5% over time for low-income, nonelderly adults in expansion states and did not increase in nonexpansion states. 16
Other factors shown to influence HIV testing at the state level include the amount of federal funding for HIV testing 17,18 (as federal funding increases, testing increases) and the percentage of the population residing in urban areas (as the percentage of persons in urban areas increases, testing increases). 19
In 2017, nearly half (45.9%) of US adults aged 18-64 years reported having ever been tested for HIV and 1 of 7 (14.8%) reported having been tested in the previous year. 20 Although published studies describe national trends in HIV testing overall and for population subgroups (by age, sex, race/ethnicity, and HIV risk behavior), 20,21 less information is available on state trends in HIV testing. State HIV testing estimates have been reported by individual states. However, none of CDC’s state HIV prevention progress reports reported trends for all 50 states or the District of Columbia. 22 -25
The objective of our study was to describe state-level trends in HIV testing in the general US adult population aged 18-64 years, for both ever tested for HIV and tested for HIV in the previous 12 months. Monitoring trends in state HIV testing is important for understanding where progress is likely being made toward incorporating HIV screening as part of routine clinical care. Each state has an important role in contributing toward national goals and monitoring progress in key indicators—reducing the number of new HIV infections, increasing knowledge of HIV seropositive status, and increasing viral suppression.
Methods
Data Sources
The Behavioral Risk Factor Surveillance System (BRFSS) is a state-based, annual, cross-sectional telephone survey of persons aged ≥18 years that collects information on health risk behaviors, preventive health practices, and health care access among noninstitutionalized US adults. 26 BRFSS completes 400 000 interviews annually in all 50 states, the District of Columbia, and 3 US territories. Respondents’ data are weighted to generalize sampled adults to the adult general population and provide national and state estimates. Before 2011, BRFSS was conducted by using random-digit–dialing sampling of landline telephones only. In 2011, BRFSS began including respondents who received 100% of their calls on a cell phone, in addition to respondents using a landline telephone. Because of this change in methodology, we did not include pre-2011 data in our analysis. 27 The median response rates for all states and territories in 2017 for both cell phones and landline telephones was approximately 45%. 28
Inclusion Criteria
BRFSS interviewers asked respondents if they had ever been tested for HIV, excluding tests that were part of a blood donation, and the date of their last HIV test. We included in our analysis respondents who met the following criteria: (1) resided in the 50 states or the District of Columbia in 2011-2017, (2) reported a valid age (ie, 18-64), (3) reported a yes or no response for having ever been tested, and (4) had a valid or imputable date (ie, year provided) of their most recent test. For the purpose of this analysis, we restricted respondents to adults aged 18-64 to match the age range in the CDC HIV testing guidelines. 7 For records with a most recent HIV test date in the preceding calendar year but an unknown or missing month, we assigned the month of June, and we categorized interviews conducted through June of the following year as having a test in the previous 12 months. This process resulted in counting approximately half of the tests in the previous year with an unknown month as taking place in the 12 months before the survey, which we would expect, assuming that HIV testing is uniformly distributed throughout the year. We used date of last HIV test and interview date to calculate the estimated number and percentage of adults aged 18-64 years who had been tested for HIV in the previous 12 months.
Data Analysis
We estimated the percentage of the state population ever tested for HIV and tested for HIV in the previous 12 months during 2011-2017. We completed all statistical analyses in SAS version 9.4 29 and SUDAAN 30 to account for the complex sample design of BRFSS and incorporated analysis weights provided. We measured each outcome as a weighted percentage (and 95% confidence intervals [CIs]) of persons tested. For each state, we used orthogonal contrasts in SUDAAN to calculate P values for linear trends for ever tested for HIV and tested in the previous 12 months. A significant linear trend indicated that testing increased or decreased during the study period; a nonsignificant linear trend suggested stable rates or no clear pattern of change. We used the significance threshold of P < .01.
To quantify the magnitude of linear trends during 2011-2017, we calculated estimated annual percentage change (EAPC). Using the assumption of linearity on the log scale (ie, assuming a constant rate of change), we calculated the EAPC as the difference in the model-predicted prevalence for each year divided by the baseline prevalence. 31 The EAPC quantifies the rate of change over time, as well as the direction of change: a positive EAPC corresponds to an increasing trend, whereas a negative EAPC corresponds to a decreasing trend; a slope of 0 implies no change between the beginning and ending points. We calculated EAPCs to quantify change, and we used the method of contrasts to test for the significance of that change (ie, P values refer to the significance of the linear trend, not the EAPC). The significance of trends generally leads to the same conclusions despite the different underlying assumptions of contrasts and EAPC. The relationship between EAPC and P values may not be monotonic (eg, a larger EAPC may not necessarily result in a smaller P value); a smaller P value may be due to the differing sizes of subpopulations.
We grouped states by HIV prevalence based on HIV prevalence in 2011 32 to reflect similarities in the prevalence of HIV and the amount of CDC funding for HIV testing. We expected to see higher rates of HIV testing in areas with a high prevalence of HIV because of more CDC funding in those areas. 17 We defined the following categories of prevalence: high prevalence, ≥20 000 persons living with HIV infection; medium prevalence, 4000-19 999 persons living with HIV infection; low-medium prevalence, 1000-3999 persons living with HIV infection; and low prevalence, <1000 persons living with HIV infection. We used HIV prevalence rather than incidence to group states because incidence estimates are not stable for all states, whereas prevalence data are available for every state and are used by CDC to determine state funding levels.
We conducted all analyses using data from publicly available data sets; institutional review board approval was not required.
Results
Ever Tested for HIV
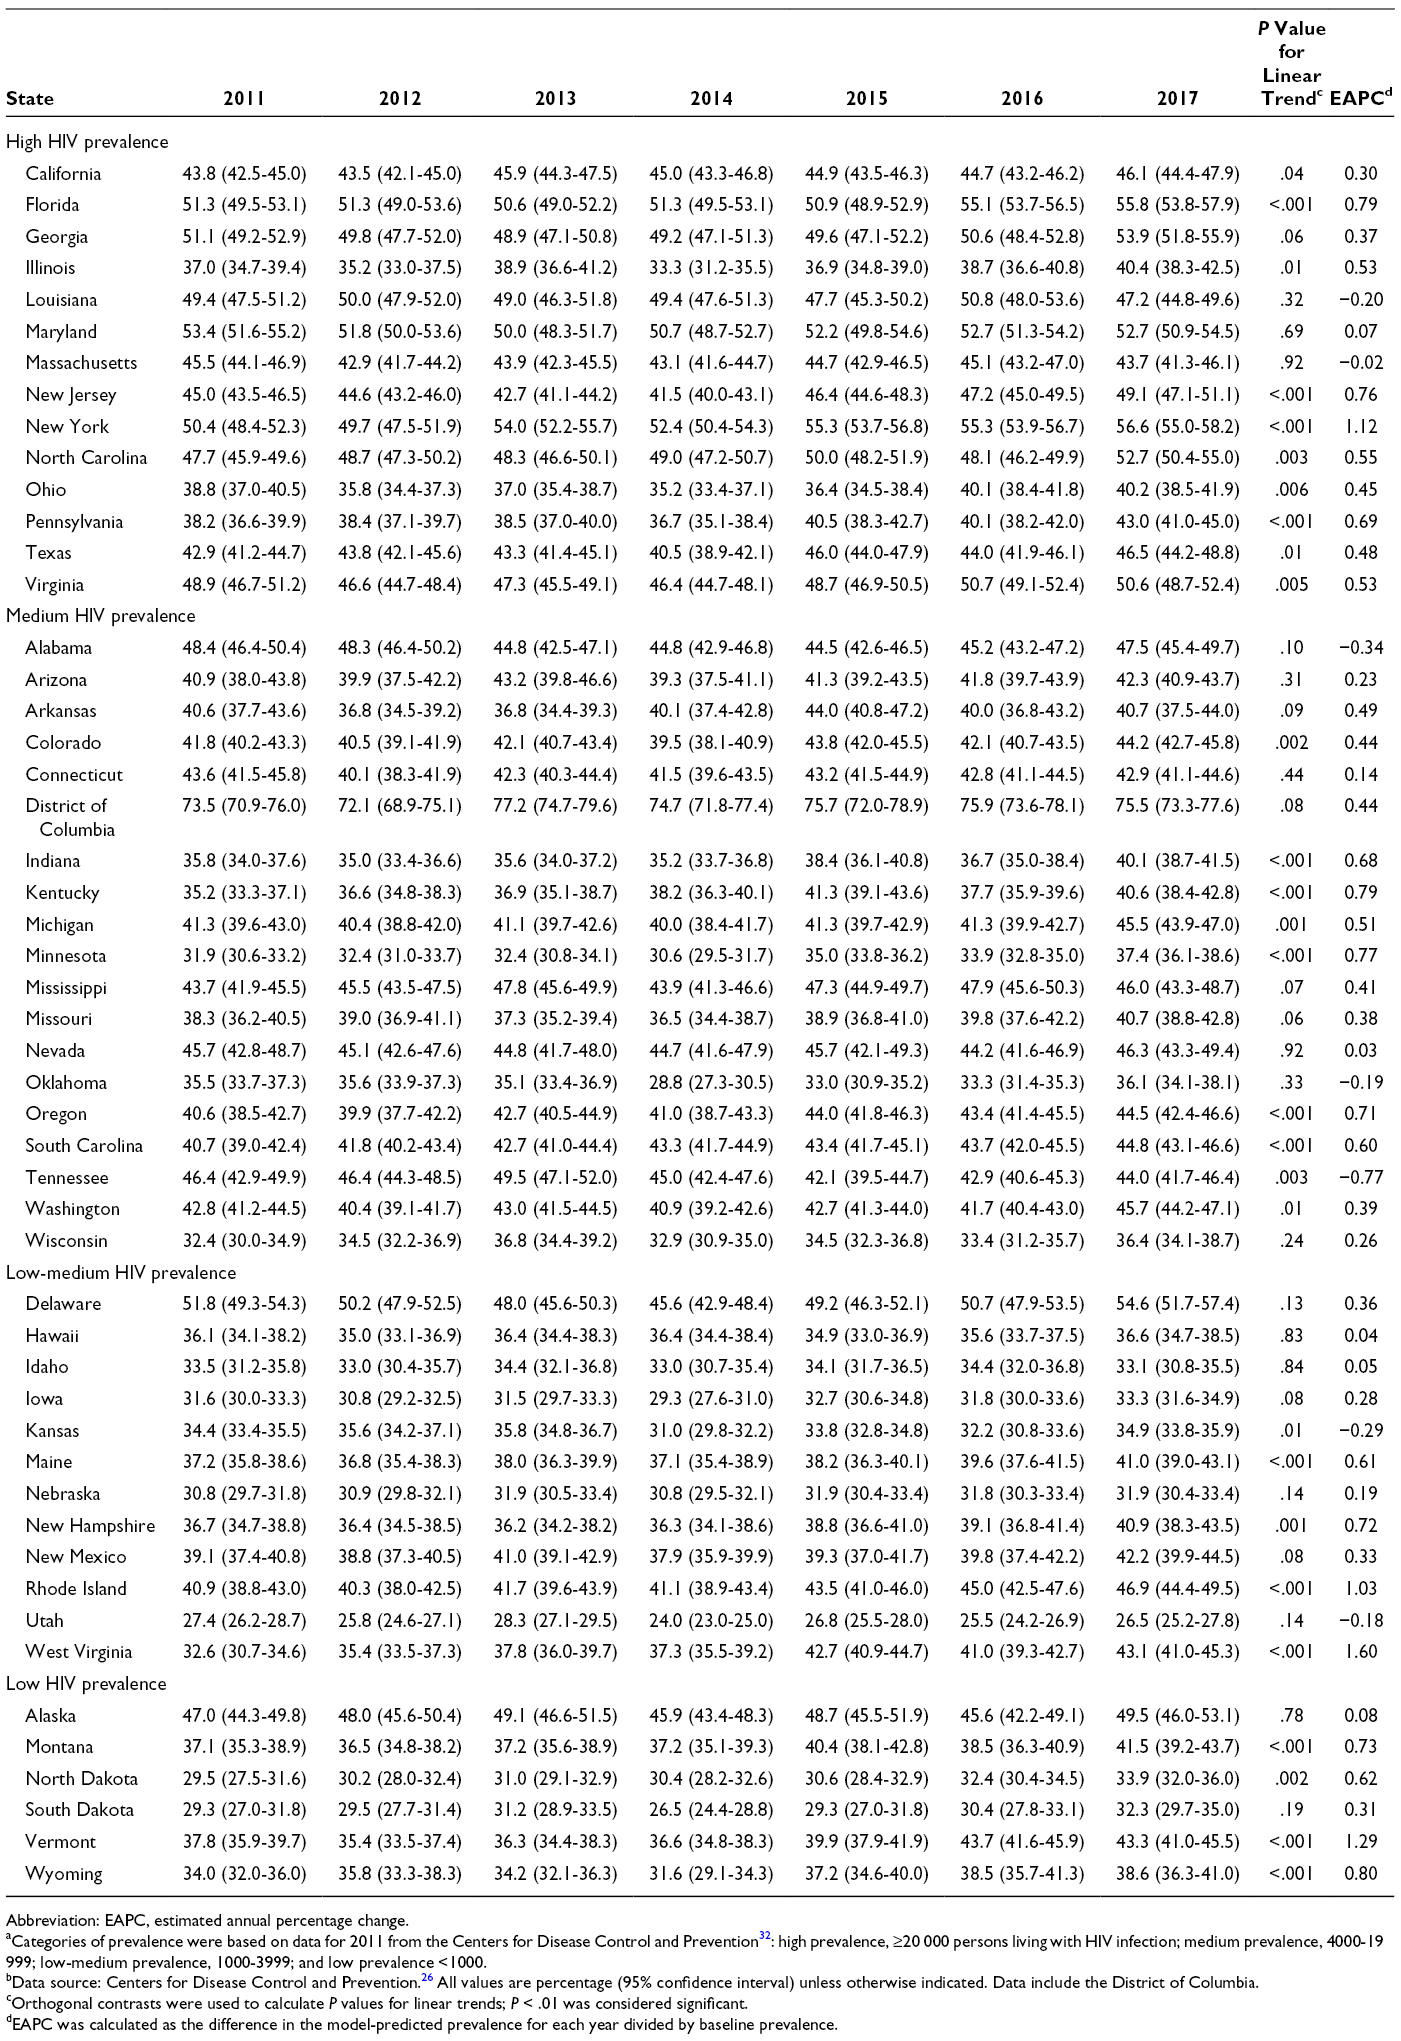
In 2017, among the 50 states, the percentage of persons aged 18-64 years reporting having ever been tested for HIV ranged from 26.5% (Utah) to 56.6% (New York) (Figure 1 and Table 1). The percentage ever tested in 2017 was ≥19 percentage points higher in the District of Columbia than in any state, and it was >50% in 7 states (Delaware, Florida, Georgia, Maryland, New York, North Carolina, and Virginia).
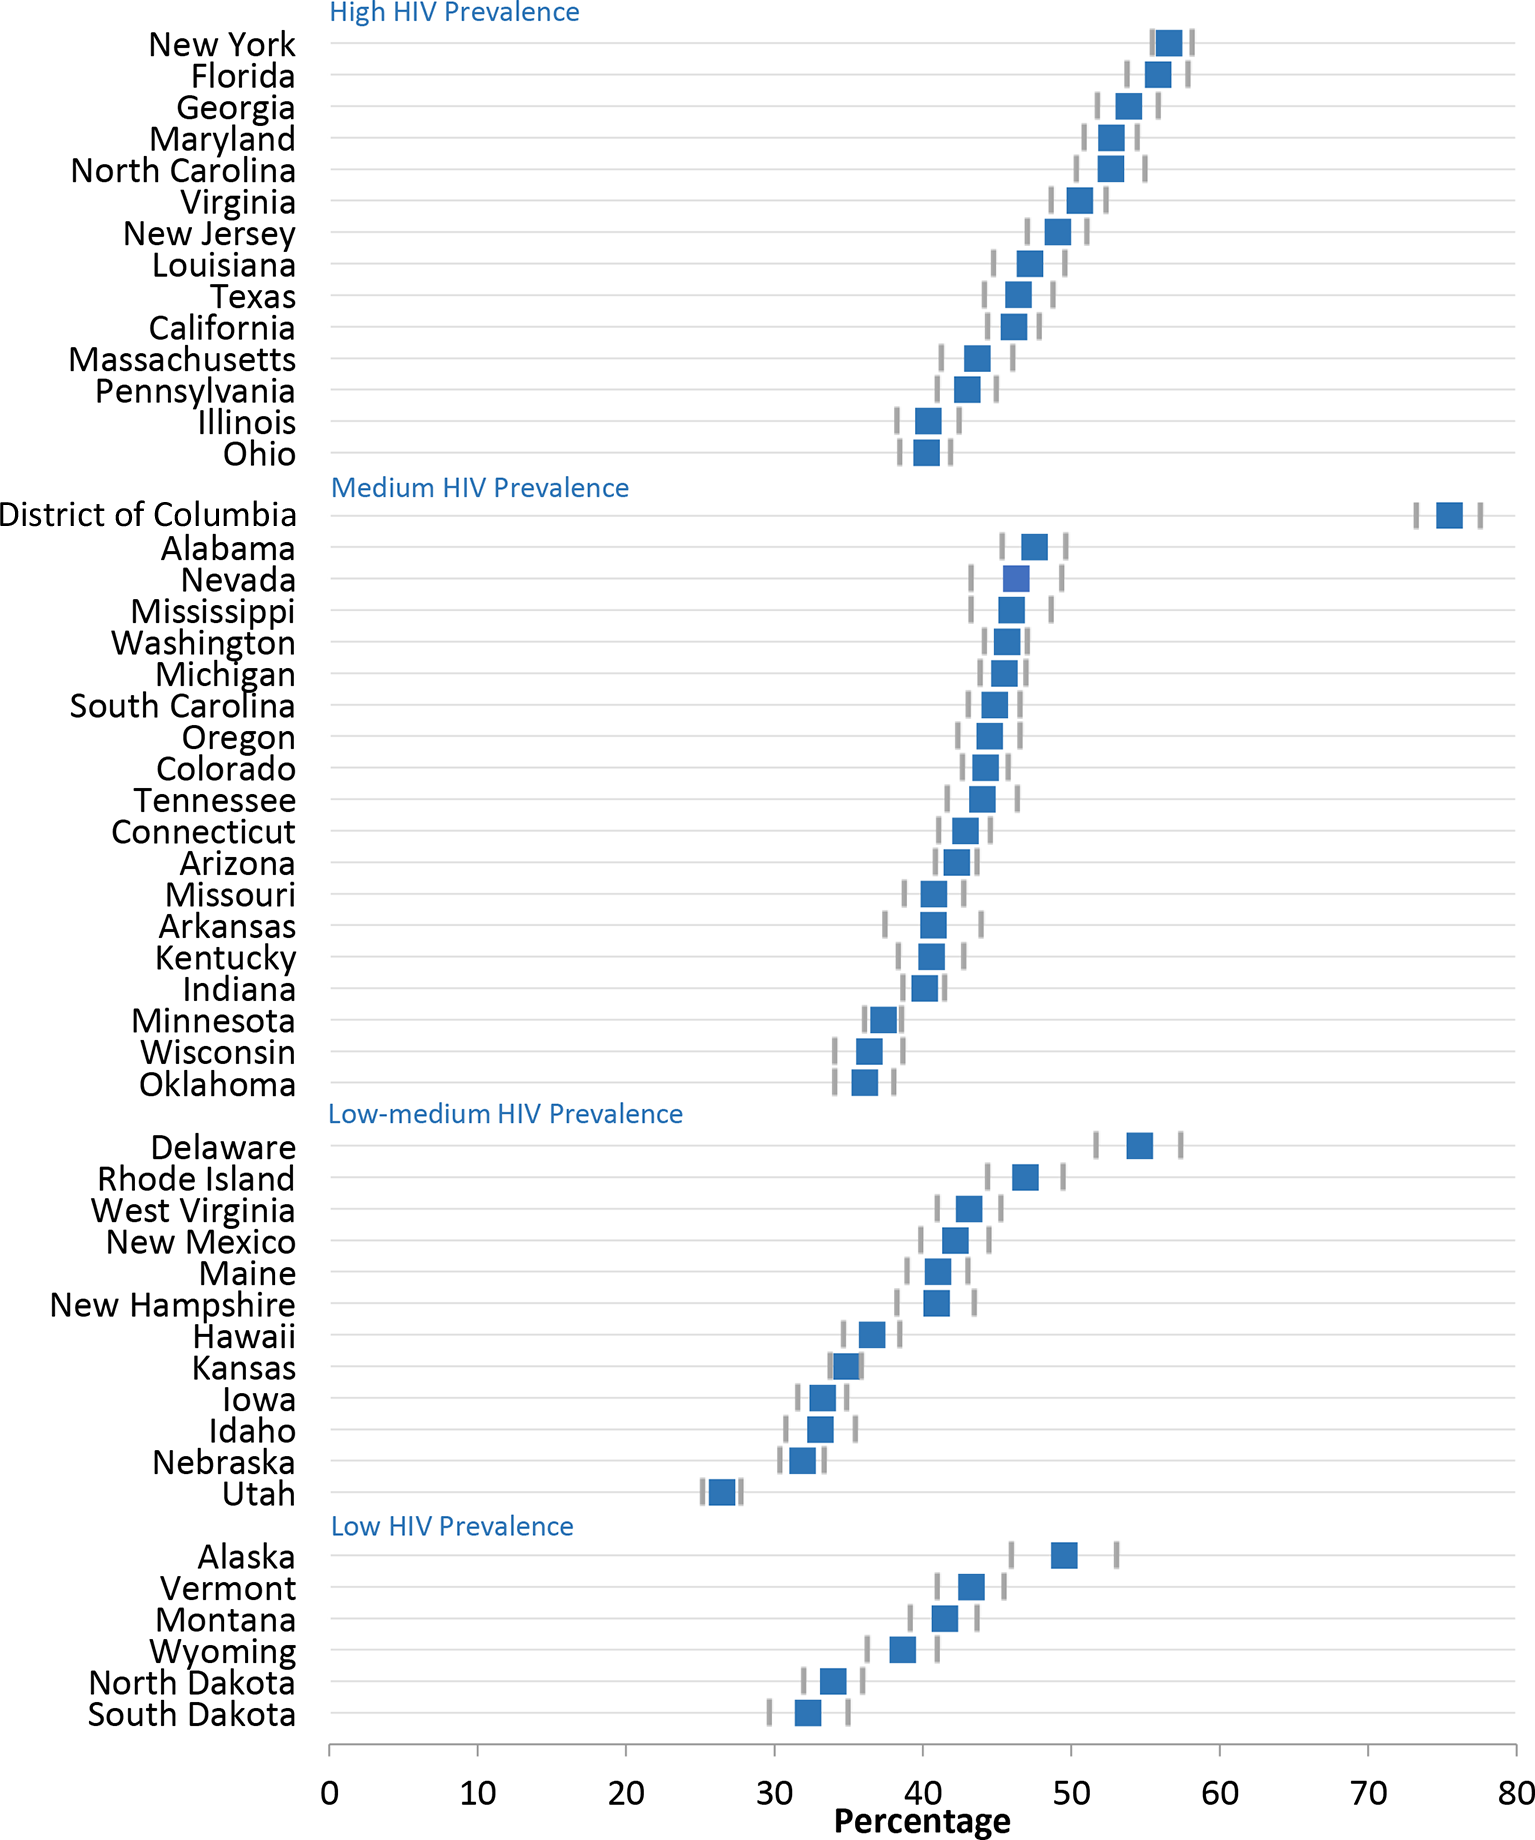
Percentage of US adults aged 18-64 years ever tested for HIV, by state and HIV prevalence, Behavioral Risk Factor Surveillance System, 2017. Categories of prevalence were based on data for 2011 from the Centers for Disease Control and Prevention 32 : high prevalence, ≥20 000 persons living with HIV infection; medium prevalence, 4000-19 999; low-medium prevalence, 1000-3999; and low prevalence, <1000. Error bars indicate 95% confidence intervals. Data source: Centers for Disease Control and Prevention. 26
Abbreviation: EAPC, estimated annual percentage change.
aCategories of prevalence were based on data for 2011 from the Centers for Disease Control and Prevention 32 : high prevalence, ≥20 000 persons living with HIV infection; medium prevalence, 4000-19 999; low-medium prevalence, 1000-3999; and low prevalence <1000.
bData source: Centers for Disease Control and Prevention. 26 All values are percentage (95% confidence interval) unless otherwise indicated. Data include the District of Columbia.
cOrthogonal contrasts were used to calculate P values for linear trends; P < .01 was considered significant.
dEAPC was calculated as the difference in the model-predicted prevalence for each year divided by baseline prevalence.
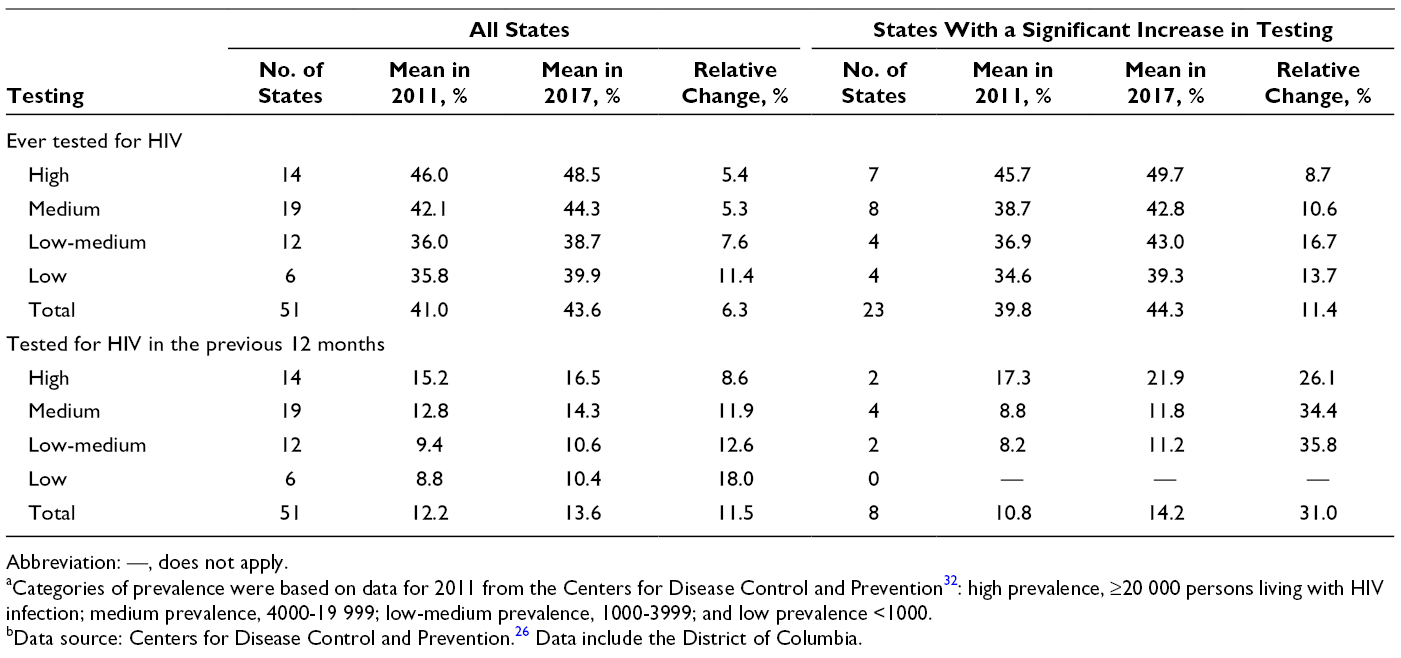
We found a significant linear trend during 2011-2017 in 24 states for persons ever tested for HIV (Table 1). Of these 24 states, 23 had a significant increase in the percentage ever tested for HIV (EAPC range = 0.39% [Washington] to 1.60% [West Virginia]), and 1 state (Tennessee) had a significant decline in the percentage ever tested for HIV (EAPC = −0.77%; P = .003). In 2017, the mean percentage ever tested for HIV in states with a high prevalence of HIV was 8.6 percentage points higher than the mean percentage in states with a low prevalence of HIV (48.5% vs 39.9%); however, the low-prevalence states had the greatest relative percentage change (11.4%) (Table 2). For the categories of medium and low-medium prevalence, the relative percentage change in the 23 states that had a significant increase in the percentage ever tested for HIV during 2011-2017 was twice as high as the relative percentage change in all states combined (medium prevalence: 10.6% [23 states] vs 5.3% [all states]; low-medium prevalence: 16.7% [23 states] vs 7.6% [all states]) (Table 3).
Abbreviation: —, does not apply.
aCategories of prevalence were based on data for 2011 from the Centers for Disease Control and Prevention 32 : high prevalence, ≥20 000 persons living with HIV infection; medium prevalence, 4000-19 999; low-medium prevalence, 1000-3999; and low prevalence <1000.
bData source: Centers for Disease Control and Prevention. 26 Data include the District of Columbia.
Abbreviation: EAPC, estimated annual percentage change.
aHigh prevalence, ≥20 000 persons living with HIV infection; medium prevalence, 4000-19 999; low-medium prevalence, 1000-3999; and low prevalence <1000.
bAll values are percentage (95% confidence interval) unless otherwise indicated.
cOrthogonal contrasts were used to calculate P values for linear trends; P < .01 was considered significant.
dEAPC was calculated as the difference in the model-predicted prevalence for each year divided by baseline prevalence.
Tested for HIV in the Previous 12 Months
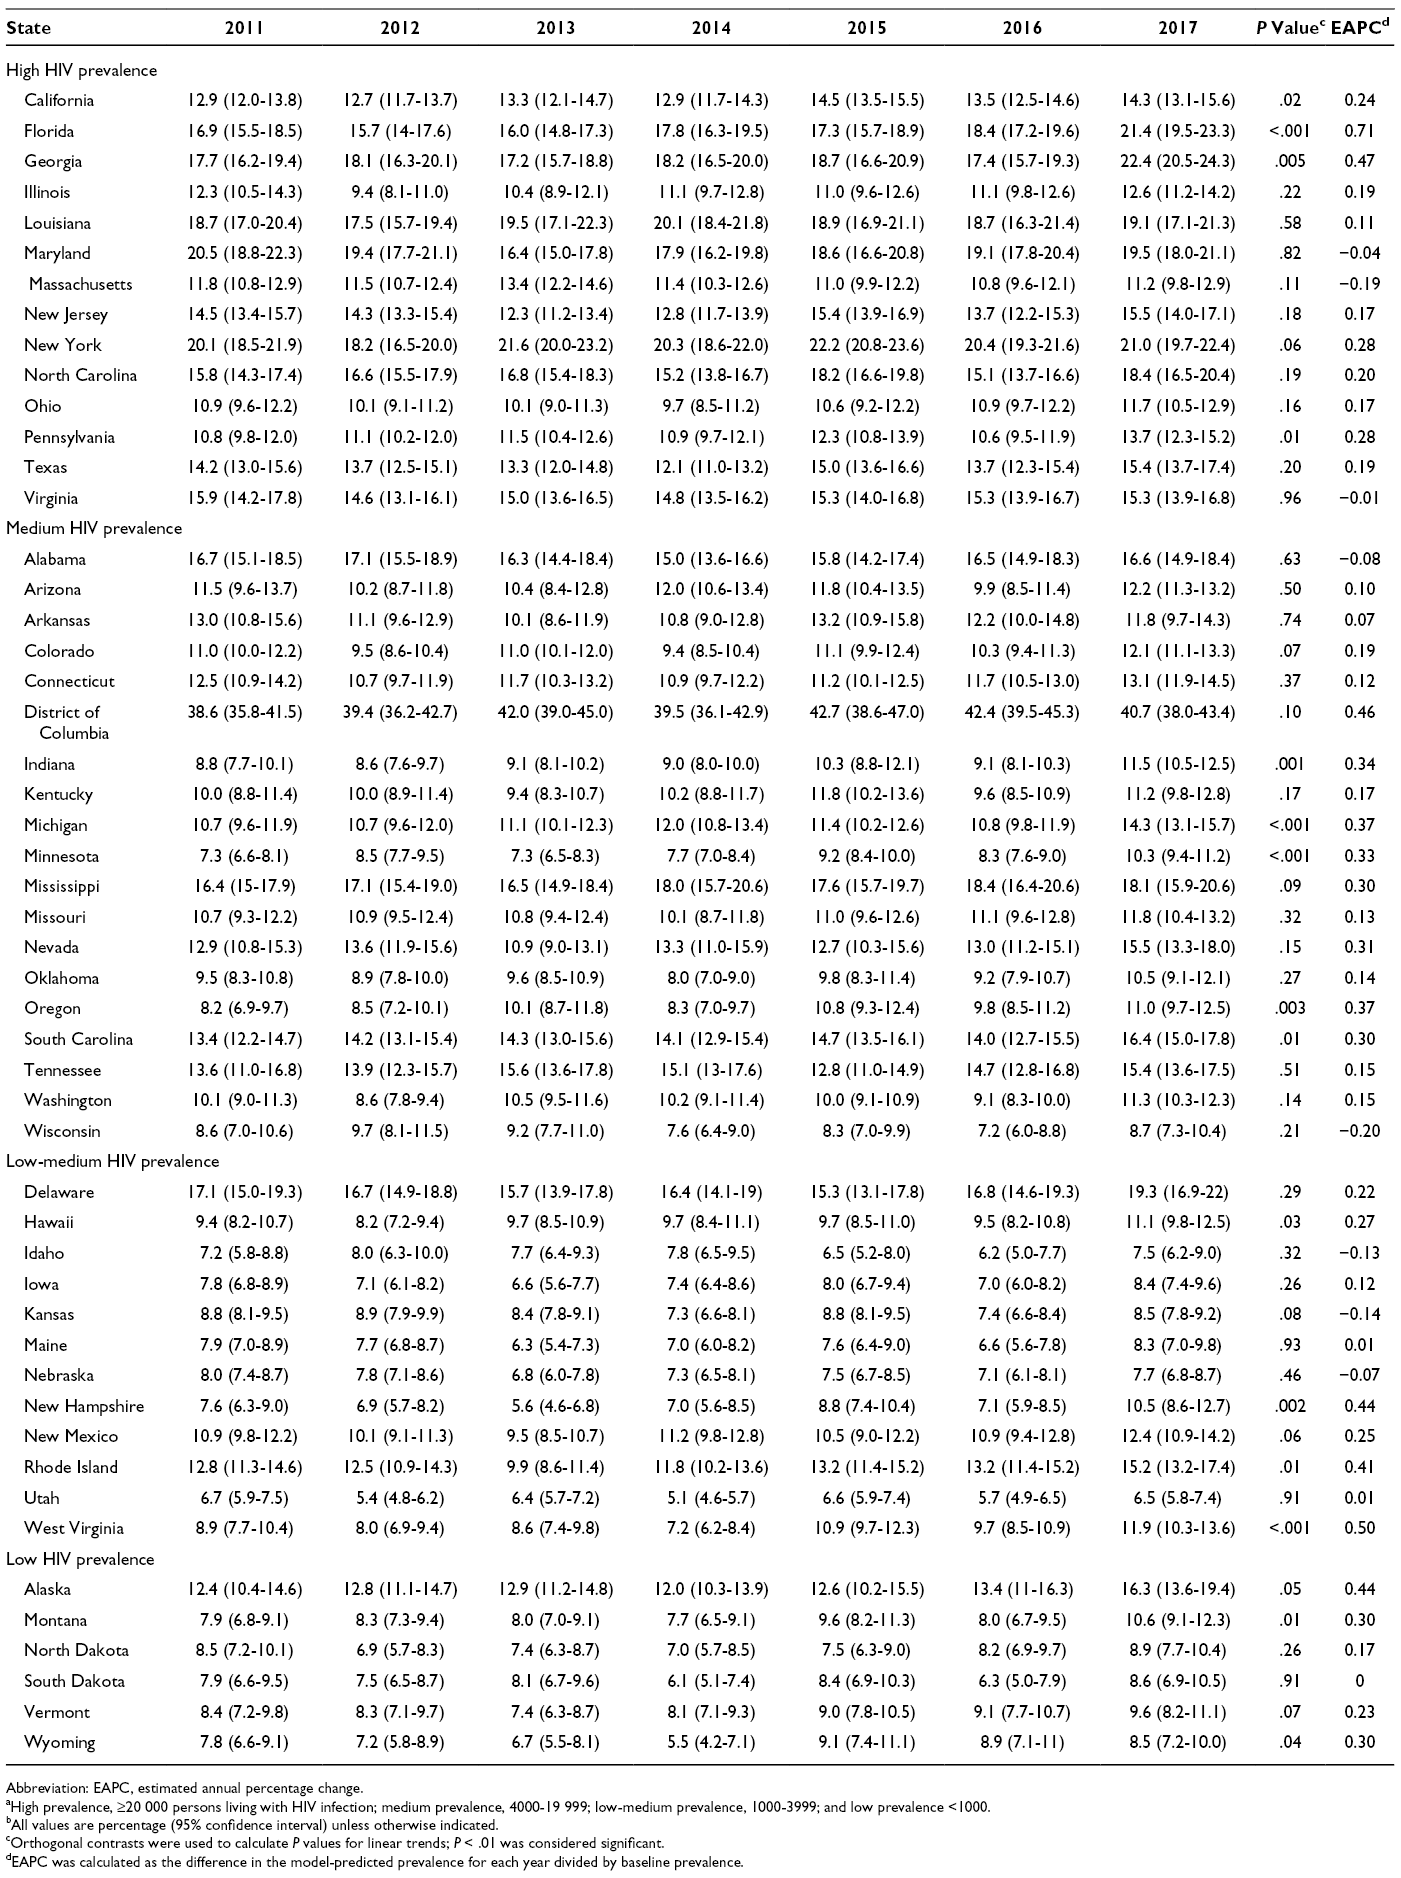
In 2017, among the 50 states, the percentage of adults tested in the previous 12 months ranged from 6.5% (Utah) to 22.4% (Georgia) (Figure 2 and Table 3). The percentage of adults tested in the previous 12 months was ≥18% percentage points higher in the District of Columbia than in any state. The percentage of adults tested in the previous 12 months was >20% in 3 states (Florida, Georgia, and New York). We found a significant positive linear trend during 2011-2017 (EAPC range = 0.33 [Minnesota] to 0.71 [Florida]) in the percentage of adults tested in the previous 12 months in 8 states: Florida, Georgia, Indiana, Michigan, Minnesota, New Hampshire, Oregon, and West Virginia (Table 3); we found no significant declines. In 2017, the mean percentage of adults tested in the previous 12 months was 6.1 percentage points higher in states with a high prevalence of HIV infection than in states with a low prevalence of HIV infection (16.5% vs 10.4%); however, the low-prevalence states had the greatest relative percentage change (18.0%) (Table 2). Comparing the 8 states that had a significant increase in the percentage of adults tested in the previous 12 months during 2011-2017 with all 50 states and the District of Columbia, we found that the relative percentage in the 8 states with a significant increase was nearly 3 times higher in each prevalence category (high prevalence: 26.1% [8 states] vs 8.6% [all states]; medium prevalence: 34.4% [8 states] vs 11.9% [all states]; low-medium prevalence: 35.8% [8 states] vs 12.6% [all states]) (Table 2).
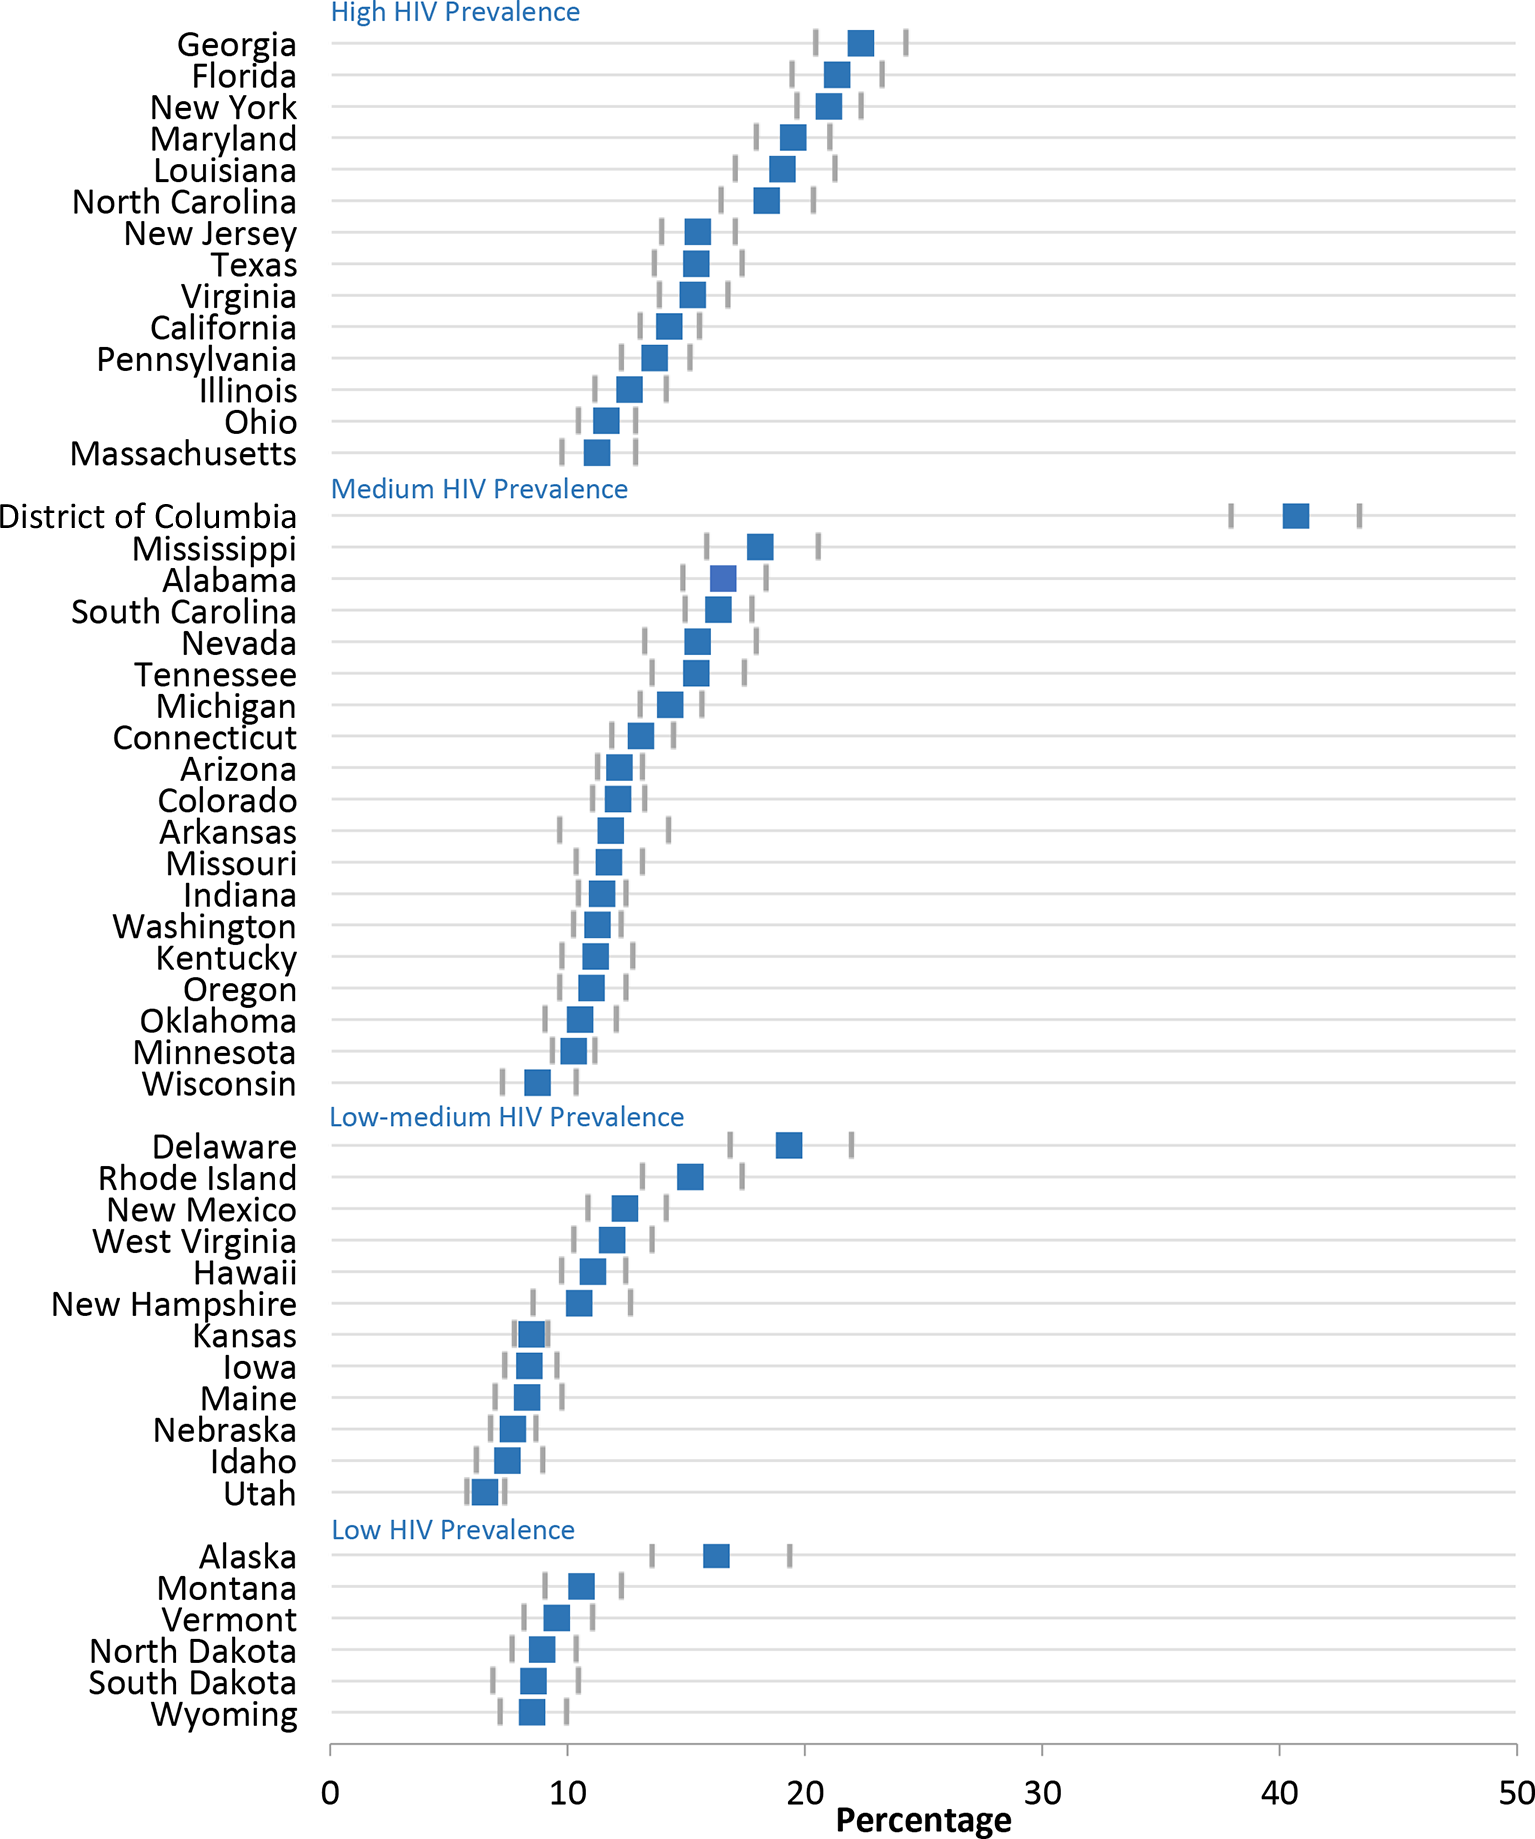
Percentage of US adults aged 18-64 years tested for HIV in the previous 12 months, by state and HIV prevalence, Behavioral Risk Factor Surveillance System, 2017. Categories of prevalence were based on data for 2011 from the Centers for Disease Control and Prevention 32 : high prevalence, ≥20 000 persons living with HIV infection; medium prevalence, 4000-19 999; low-medium prevalence, 1000-3999; and low prevalence, <1000. Error bars indicate 95% confidence intervals. Data source: Centers for Disease Control and Prevention. 26
Discussion
The percentage of the population ever tested for HIV increased significantly in 23 states during 2011-2017, whereas the percentage tested for HIV in the previous 12 months increased in 8 states. HIV testing in the previous 12 months is useful for interpreting trends in the number of HIV diagnoses. However, other data are needed to assess the extent to which testing in the previous 12 months includes persons at high risk of HIV infection who should be tested/retested at least annually per the 2006 testing recommendations. 7,33
Progress has been made for both ever-tested and tested for HIV in the previous 12 months nationally, 20 but in our analysis, progress varied by state. Accelerated testing is needed to diagnose HIV infections among persons unaware of their infection. CDC analyses published in 2017 suggested that without increased testing, an infection could be undiagnosed for many years and that 1 in 2 persons had been living with HIV for ≥3 years before an infection had been diagnosed. 34,35 Ideally, HIV is diagnosed within months of infection, rather than years later. Increasing routine HIV testing and narrowing the time frames between testing, diagnoses, and treatment are essential to stopping HIV. Testing is particularly important in states where the percentage of diagnosed HIV infections is below the National HIV/AIDS Strategy target of 90%. 1,36
Increasing the percentage of persons tested for HIV will require that more health care providers implement both the CDC and USPSTF recommendations for routine HIV screening of adolescents and adults. In addition, HIV testing in populations and neighborhoods with high rates of HIV infection will continue to be important in identifying persons living with HIV who are unaware of their infection. Testing in these populations and neighborhoods will also present an opportunity to provide prevention services (eg, preexposure prophylaxis) to persons who receive a negative test result for HIV. Routinely monitoring the implementation of HIV testing programs will help address any gaps or issues and ultimately improve these programs. State testing efforts can be supported by existing HIV campaigns that encourage adolescents and adults to get tested and health care providers to increase routine testing in health care settings (eg, CDC’s Let’s Stop HIV Together). 37 Increasing the amount of routine testing is likely to result in an increase in both ever tested and tested in the previous 12 months.
Limitations
This study had several limitations. First, we could not assess state trends in HIV testing by race/ethnicity or age because the sample sizes for each state varied, and many states were missing data as a result of unstable estimates. In addition, the distribution of racial/ethnic populations and age groups varied by state. These differences in state populations could explain some of the differences in HIV testing found in our study. Second, we could not assess trends related to reported HIV risk behaviors because of small numbers of survey respondents at the state level. In addition, the question about HIV risk behaviors changed during the study period, and it was not asked annually; thus, we could not compare trends in responses to this question. Finally, the BRFSS is based on self-reported data, which may be subject to recall bias, whereby respondents may not remember being tested in previous years. This limitation could have resulted in an underestimation of testing.
Conclusions
Routine HIV screening, repeat screening for persons likely to be at high risk for HIV, and targeted HIV testing efforts have reduced the number of persons with undiagnosed HIV infection. 1 Enhanced efforts by states to make HIV testing simple, accessible, and routine will contribute toward reaching national goals to end the HIV epidemic.
Footnotes
Declaration of Conflicting Interests
The authors declared no potential conflicts of interest with respect to the research, authorship, and/or publication of this article.
Funding
The authors received no financial support for the research, authorship, and/or publication of this article.