
Abstract
Bullying is a serious public health issue among children and adolescents in the United States. The purpose of this study was to estimate the prevalence of bullying victimization (defined as a child being bullied, picked on, or excluded by children) in the 50 states and the District of Columbia. We used data on bullying victimization from the 2016-2017 National Survey of Children’s Health (NSCH). We stratified the sample by age: children aged 6-11 years (n = 21 142) and adolescents aged 12-17 years (n = 29 011). We conducted bivariate analyses to determine the prevalence of bullying victimization by state for each age group. In the survey, parents/caregivers responded to a question about whether it was “definitely true,” “somewhat true,” or “not true” that their child “is being bullied, picked on, or excluded by other children.” We combined “definitely true” and “somewhat true” responses to create a dichotomous variable for bullying victimization. Parents reported 22.4% of children aged 6-11 years and 21.0% of adolescents aged 12-17 years as experiencing bullying victimization during 2016-2017. The prevalence of bullying victimization among children ranged from 16.5% in New York State to 35.9% in Wyoming and among adolescents ranged from 14.9% in Nevada to 31.6% in Montana. The prevalence of bullying victimization among children or adolescents was >30% in 7 states: Arkansas, Kentucky, Maine, Montana, North Dakota, South Dakota, and Wyoming. These data can be used to inform state programs and policies to support bullying prevention efforts and services for children and adolescents who experience bullying. NSCH will continue to collect data on bullying victimization to track annual trends in national and state-level prevalence rates among children and adolescents.
Bullying is defined as “any unwanted aggressive behavior(s) by another youth or group of youths, who are not siblings or current dating partners, that involves an observed or perceived power imbalance and is repeated multiple times or is highly likely to be repeated.” 1 Bullying behaviors include physical bullying (such as hitting or tripping), verbal bullying (such as name calling or taunting), and social or relational bullying (such as leaving someone out on purpose or spreading rumors). A child is a victim of bullying when he or she repeatedly experiences negative actions by others and is unable to defend himself or herself. Bullying may inflict harm or distress on the targeted young person, including physical, psychological, social, or educational harm.1,2 Being bullied in childhood can have an immediate effect on a child’s behavioral health, as well as long-term effects into adulthood, including an increased risk of developing depression, anxiety, substance misuse, and suicidality. 3 A 2015 study found that US young adults aged 18-26 who were bullied by their peers during childhood had 4 times greater odds of having mental health problems (including any anxiety, depression, self-harm, or suicidality) than those who were maltreated by an adult during childhood. 4
Although no federal antibullying laws exist, federal civil rights and antidiscrimination laws apply when certain classes of persons (based on race, national origin, color, sex, disability, religion) are harassed or discriminated against. 5 In these cases, federally funded schools are legally obligated to resolve the situation. Additionally, the Individuals with Disabilities Education Act enables supports to be provided to students when bullying affects their access to a free and appropriate public education. 6 All states, the District of Columbia, and US territories address bullying differently. Some have laws, policies, or regulations to address bullying, whereas others have created model policies that local schools and school districts can use to develop their own local laws, policies, or regulations. 7 In 2011, the US Department of Education identified key legislative and policy components in states and school districts that focused on bullying. 8 The components included in laws and policies can directly affect bullying behaviors in schools. For example, a 2011 study of students in grades 9 through 12 in 25 states found that 3 components of state-level antibullying legislation were associated with a reduced risk of being bullied in schools: statement of scope, description of prohibited behaviors, and requirements for school districts to develop and implement local policies. 9
In addition to policy interventions, states administer programs that address bullying in the context of a safe school environment and as a public health issue. State departments of education and local school districts are often the epicenter of bullying prevention programming. Many evidence-based interventions are intended for implementation in the school environment, including curricula that teach social and emotional skills, awareness-raising campaigns, and small group activities. 10 Furthermore, state agencies that receive federal funds through the Title V block grant program can choose bullying prevention as one of the focus areas on which their performance will be measured.
In this study, we used data from the 2016-2017 National Survey of Children’s Health (NSCH) 11 to estimate national and state-level prevalence rates of bullying victimization (defined as a child being bullied, picked on, or excluded by other children) among children aged 6-11 years and adolescents aged 12-17 years. These data represent the latest estimates of parent-reported bullying victimization and include data on children of younger ages than were available in other national surveys (ie, School Crime Supplement to the National Crime Victimization Survey, Youth Risk Behavior Survey, Health Behaviour in School-aged Children study) at the time we conducted the study. We hypothesized that national parent-reported rates of bullying victimization from the NSCH would be lower than self-reported rates of young persons from other national data sources, because children may not inform their parents about their bullying experiences at school, especially as they age.
Methods
The NSCH is an annual cross-sectional survey of noninstitutionalized children and adolescents aged 0-17 years living in all 50 US states and the District of Columbia. 11 Funded and directed by the Health Resources and Services Administration (HRSA) Maternal and Child Health Bureau and conducted by the US Census Bureau, the NSCH provides both state-level and nationally representative estimates of key indicators of child health and wellbeing. State-level samples are allocated with the goal of producing an approximately equal number of completed questionnaires in each state. Respondents are parents or other caregivers (hereinafter referred to as “parents”) familiar with the child’s health and health care needs. A letter is sent to randomly selected households by postal mail with an invitation to participate in an online survey; nonresponders receive multiple mailings, including a paper questionnaire to complete and return by mail. The survey is available in English and Spanish, and a telephone questionnaire assistance line is available to assist respondents in completing the survey.
The US Census Bureau uses a 2-phased data collection approach. First, respondents complete an initial household screener that assesses the presence, basic demographic characteristics, and special health care needs of all children in the home. If multiple children are present, the US Census Bureau randomly selects 1 child and provides respondents with 1 of 3 detailed age-specific topical questionnaires. Questionnaires include slightly different topics and questions for each age category (0-5 years, 6-11 years, 12-17 years). Additional information on the survey’s methodology is available elsewhere.12,13
For this analysis, we combined the 2 most recent years of data available at the time the study was conducted (2016 and 2017) to increase state-level sample sizes. The 2016 NSCH was conducted from June 2016 through February 2017, and the 2017 NSCH was conducted from August 2017 through February 2018. The total sample for 2016-2017 was 71 811 children and adolescents aged 0-17 years. The sample size per state ranged from 1070 (Mississippi) to 1784 (Minnesota). In 2016, the overall response rate was 40.7%, and the survey completion rate (ie, the proportion of households with children who completed a topical questionnaire) was 69.7%. In 2017, the overall weighted response rate was 37.4% and the survey completion rate was 70.9%.
We based the bullying victimization estimates on parents’ responses to a question inquiring about current bullying experiences. For 2016, the NSCH asked: “How well [does] the following phrase describe this child? This child is bullied, picked on, or excluded by other children.” Response options were “definitely true,” “somewhat true,” and “not true.” For 2017, the stem question on current bullying experiences was reworded to “How true [is] the following statement about this child? This child is bullied, picked on, or excluded by other children.” We examined data on the distribution of responses for each year and confirmed that the slightly different question wording between years was not associated with substantial response differences, supporting our decision to combine the 2 years of data. In addition, we found that parents rarely endorsed the “definitely true” option, resulting in small sample sizes that precluded use of the original 3-category variable. Therefore, we combined “definitely true” and “somewhat true” responses to create a dichotomous (yes/no) variable for bullying victimization, consistent with previous studies.14 -16
For this analysis, we excluded data on children aged ≤5 years because the bullying question was not asked for this age group. We estimated the prevalence of bullying victimization and corresponding 95% confidence intervals (CIs) among children aged 6-11 years and adolescents aged 12-17 years at the national level and for all 50 states and the District of Columbia. The analytic sample included 21 142 children aged 6-11 years and 29 011 adolescents aged 12-17 years who had nonmissing data on bullying victimization. We applied sampling weights produced by the US Census Bureau to account for the probability of selection into the sample, nonresponse, and population controls from the American Community Survey.12,17 We weighted analyses based on the survey’s sampling design to produce estimates that were representative of children and adolescents nationally and within each state by using Stata/SE 15.1. 18 For each age group, we also created quartiles of bullying victimization rates (12.0%-17.9%, 18.0%-23.9%, 24.0%-29.9%, 30.0%-35.9%) and produced maps using mapchart.net to indicate quartiles for each state. 19 Because we used secondary, de-identified data, the study did not fall under the purview of human subjects research; therefore, it was not subject to institutional review board review.
Results
Approximately 22% of children aged 6-11 years were bullied during 2016-2017 (Table). The state-level prevalence of bullying victimization among children ranged from 16.5% in New York State to 35.9% in Wyoming. The prevalence of bullying victimization among children was lowest among states in the Northeast region (16.5% in New York State, 17.2% in Pennsylvania) and highest among states in the West region (35.9% in Wyoming), the South region (32.3% in Kentucky, 30.1% in Arizona), and the Northeast region (31.3% in Maine) (Figure 1).
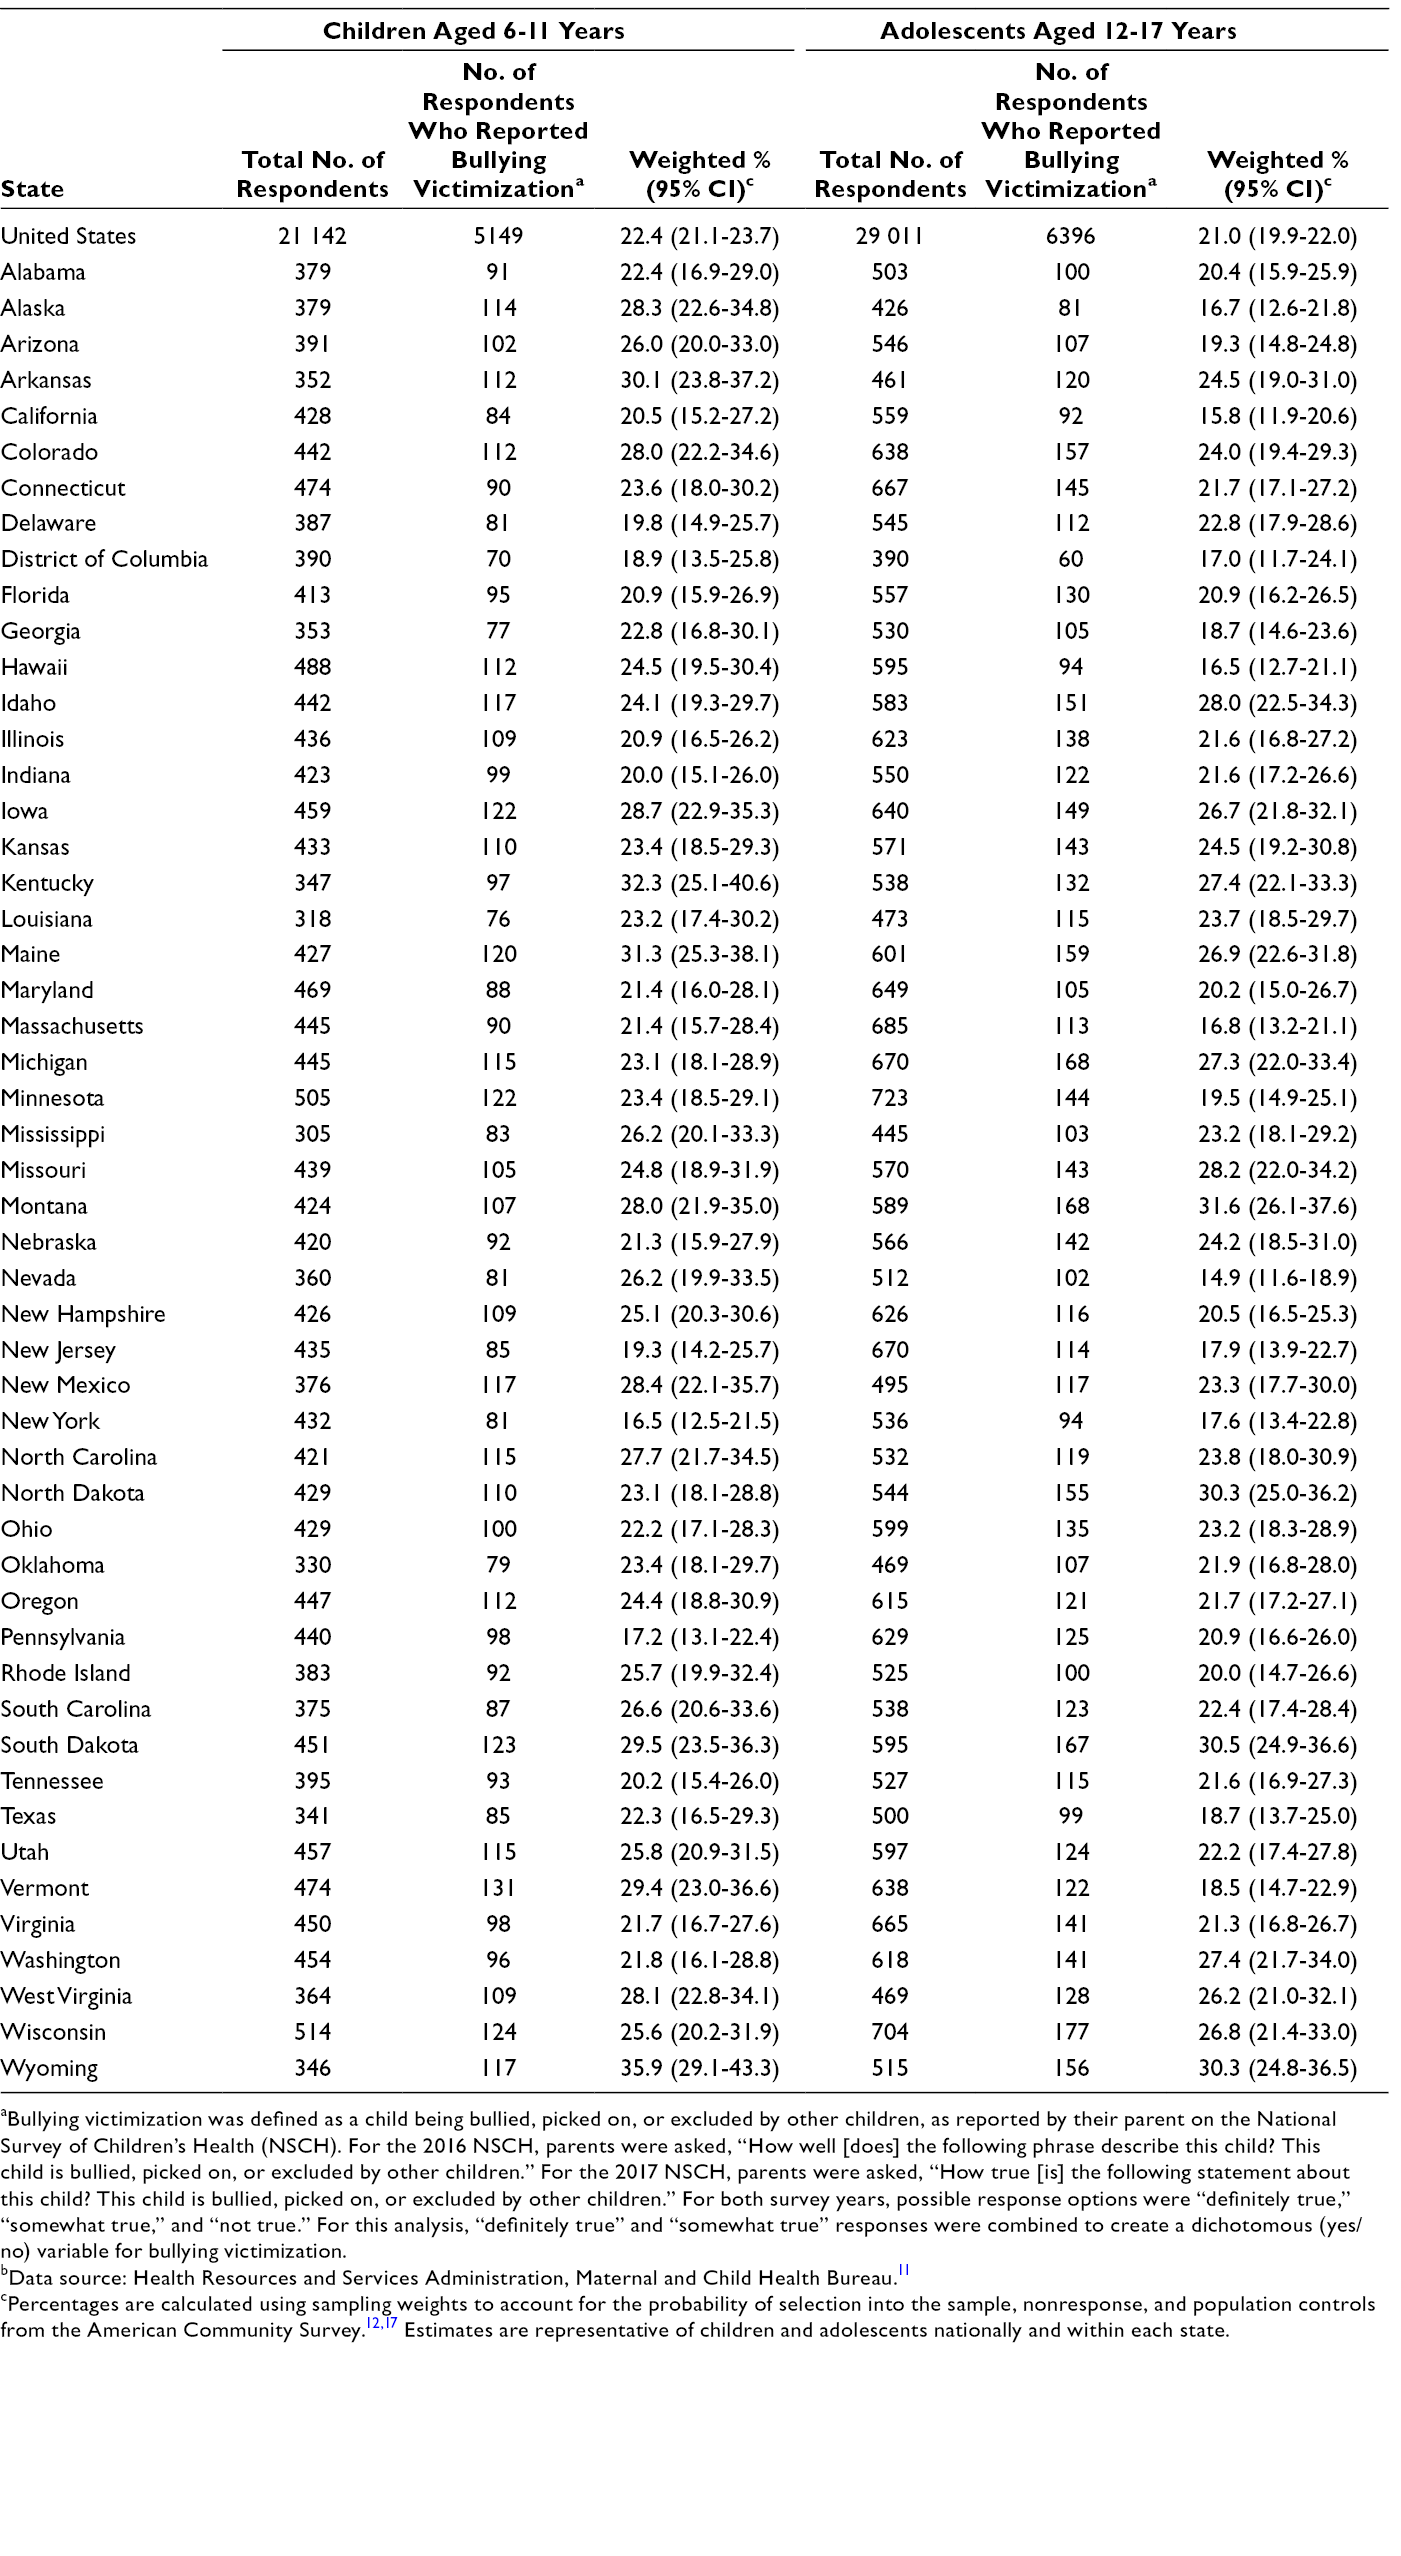
aBullying victimization was defined as a child being bullied, picked on, or excluded by other children, as reported by their parent on the National Survey of Children’s Health (NSCH). For the 2016 NSCH, parents were asked, “How well [does] the following phrase describe this child? This child is bullied, picked on, or excluded by other children.” For the 2017 NSCH, parents were asked, “How true [is] the following statement about this child? This child is bullied, picked on, or excluded by other children.” For both survey years, possible response options were “definitely true,” “somewhat true,” and “not true.” For this analysis, “definitely true” and “somewhat true” responses were combined to create a dichotomous (yes/no) variable for bullying victimization.
bData source: Health Resources and Services Administration, Maternal and Child Health Bureau. 11
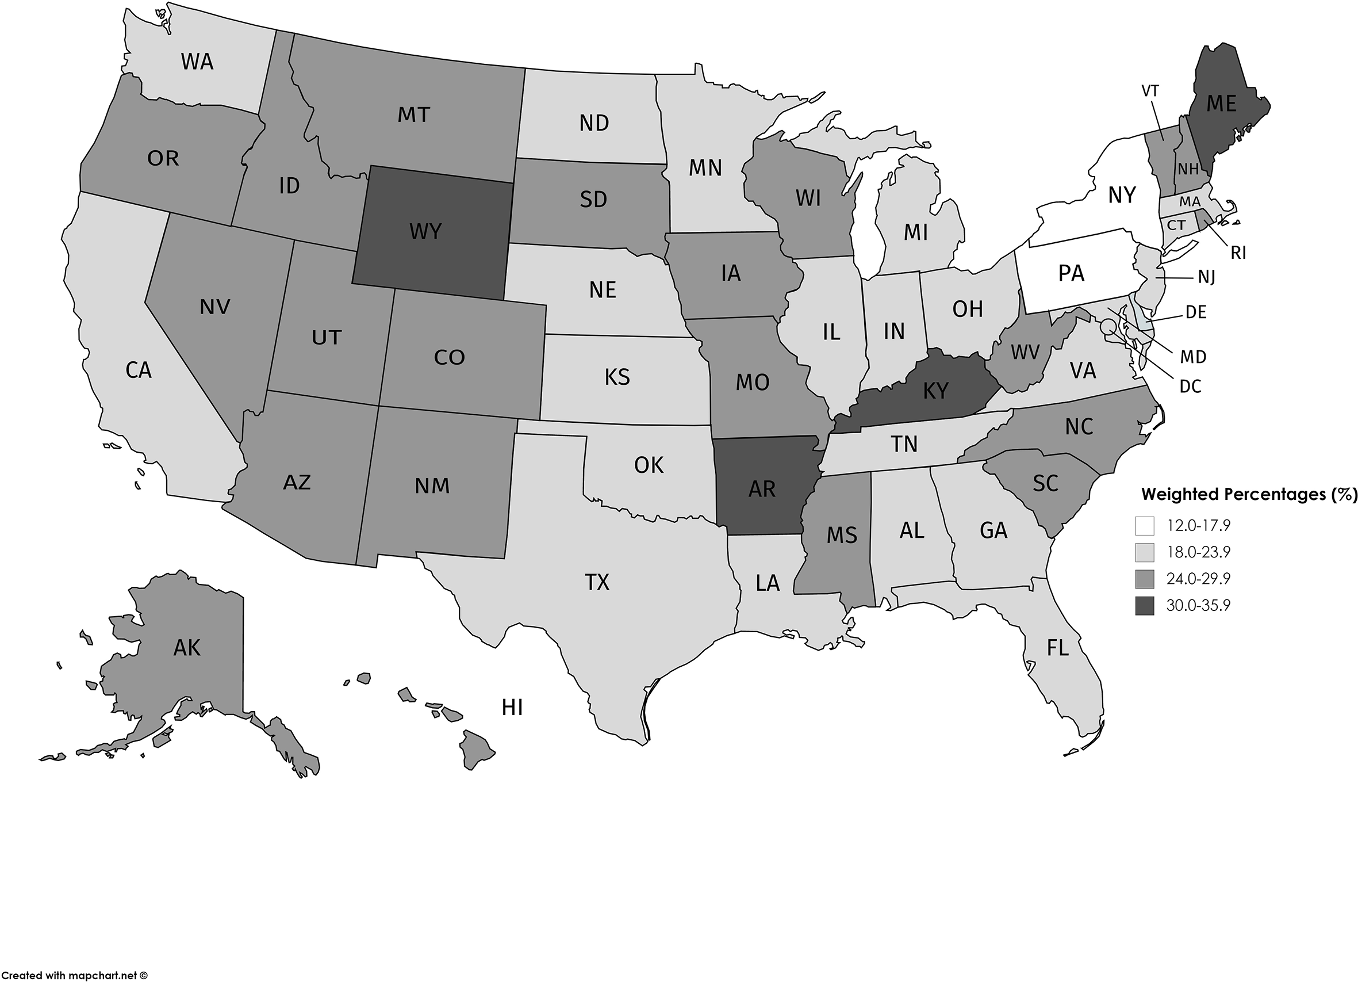
State-level prevalence of bullying victimization among children aged 6-11 years (n = 21 142), by quartile groups, National Survey of Children’s Health, 2016-2017. Data source: Health Resources and Services Administration, Maternal and Child Health Bureau. 11
Approximately 21% of adolescents aged 12-17 years were bullied by during 2016-2017 (Table). The prevalence of bullying victimization among adolescents ranged from 14.9% in Nevada to 31.6% in Montana. The prevalence of bullying victimization among adolescents was lowest in the West region (14.9% in Nevada, 15.8% in California, 16.5% in Hawaii, 16.7% in Alaska), the Northeast region (16.8% in Massachusetts, 17.6% in New York State, 17.9% in New Jersey), and the South region (17.0% in the District of Columbia) and highest in the Midwest region (30.5% in South Dakota, 30.3% in North Dakota) and the West region (31.6% in Montana, 30.3% in Wyoming) (Figure 2).
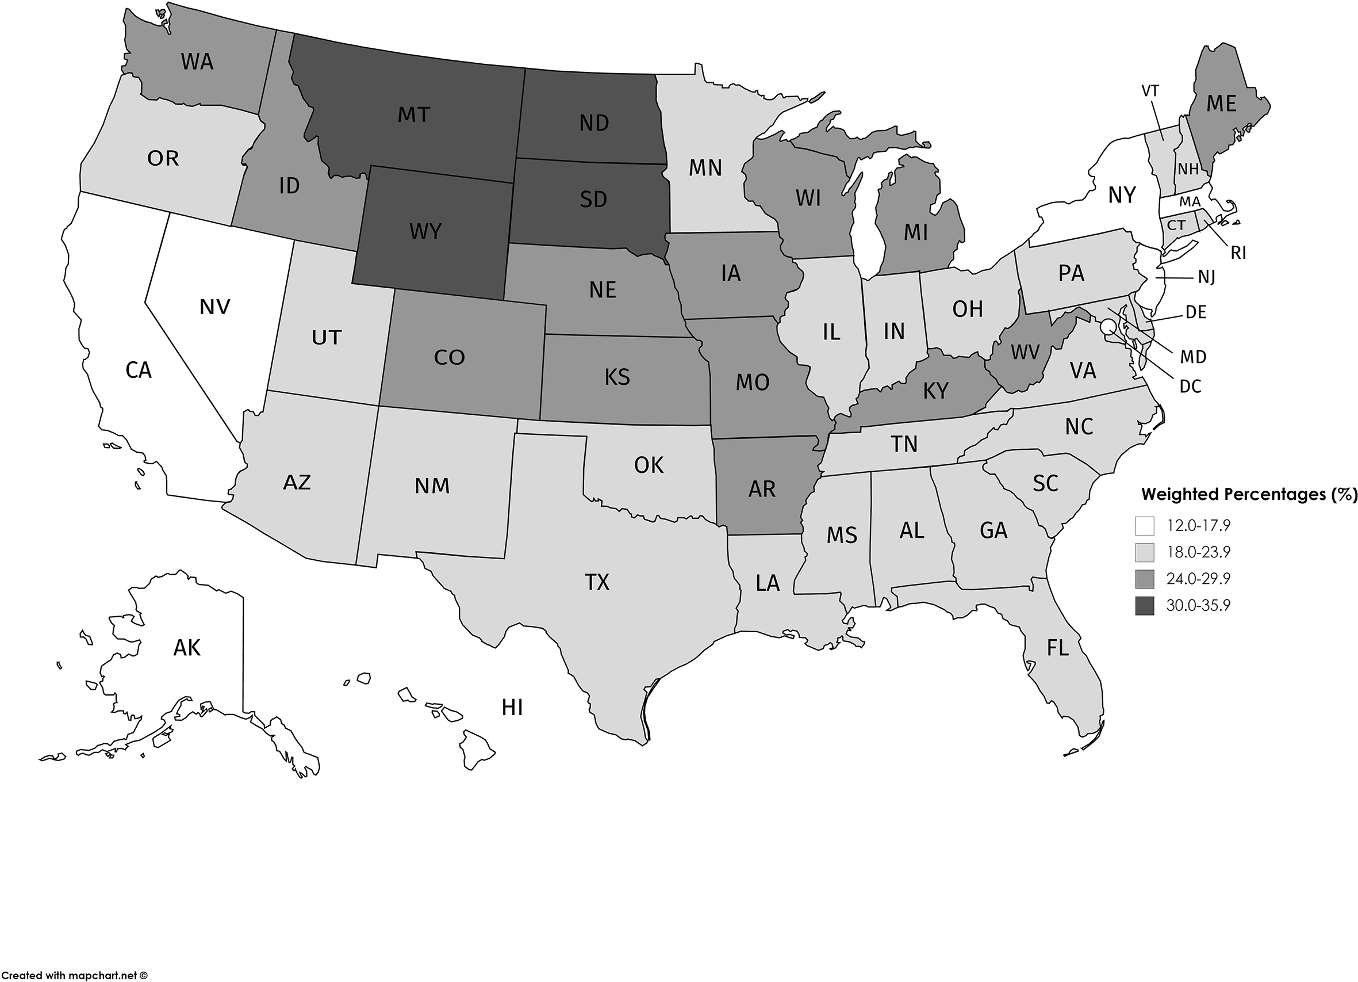
State-level prevalence of bullying victimization among adolescents aged 12-17 years (n = 29 011), by quartile groups, National Survey of Children’s Health, 2016-2017. Data source: Health Resources and Services Administration, Maternal and Child Health Bureau. 11
Discussion
At the national level, we expected to find that parent-reported rates of bullying victimization from the NSCH would be lower than self-reported rates of young persons from other national data sources. However, our parent-reported estimate of bullying victimization among adolescents aged 12-17 years (21.0% in 2016-2017) was similar to estimates from the 2015 Youth Risk Behavior Survey (20.2% of students in ninth through 12th grade reported being bullied on school property in the 12 months before the survey) 20 and the School Crime Supplement to the 2015 National Crime Victimization Survey (20.8% of students aged 12-18 years reported being bullied at school during the school year). 21 This finding suggests that parents may be reliable sources of reports on bullying victimization. National estimates for children aged <12 years are not available in other data sources; as such, we could not compare our finding that 22.4% of children aged 6-11 years were bullied during 2016-2017 with data from other studies. Nevertheless, the data are an important contribution to the literature.
These data can be used to inform states, programs, and policies to support efforts in bullying prevention and services for children and adolescents who experience bullying. Several agencies within the US Department of Health and Human Services and other departments (US Departments of Education, Justice, Defense, Agriculture, and Interior; Federal Trade Commission; White House Initiative on Asian Americans and Pacific Islanders) partner on initiatives such as Federal Partners in Bullying Prevention, which was established in 2010 to coordinate federal efforts on bullying prevention. 22 Each office and agency can use data on bullying victimization from the NSCH to strategically focus on technical and financial assistance efforts in bullying prevention. For example, HRSA administers Title V block grant funds to state health departments, which use the funds to address several priority maternal and child health–related topics, including reducing the prevalence of bullying victimization (and bullying perpetration) among adolescents. 23 Using data on bullying victimization from the NSCH, HRSA could target its technical assistance to states with high bullying rates using its “Assessing Prevention Capacity and Implementing Change” tool. 24 This web-based document includes a user guide and assessment instrument to help Title V agencies conduct bullying prevention capacity self-assessments and implement evidence-based and evidence-informed strategies for bullying prevention. HRSA will continue to annually administer the NSCH to collect data on the health and wellbeing of children, including information on parent-reported bullying victimization. The NSCH also collects data on parent-reported bullying perpetration, which we did not examine. These data can be used to track national and state-level trends on the bullying experiences of children and adolescents aged 6-17 years.
Limitations
This study had several limitations. First, because of small sample sizes in the “definitely true” response for the bullying victimization question, we combined “definitely true” and “somewhat true” responses, resulting in some loss of nuance in data. In addition, small samples at the state level precluded any adjusted analyses to control for factors that might have varied across states and been associated with an increased risk of bullying victimization. However, the NSCH has been an annual survey since 2016; as such, future analyses may combine ≥3 years of data to increase sample sizes at the state level and enable multivariable analyses. Second, response bias may have occurred because of the wording for the bullying question. Past iterations of the survey (before 2016) used a similar question but asked it in the context of “the past month.” The 2016 and 2017 surveys dropped the reference to the past month. Without this guidance, parents may have considered various other periods (eg, in the past year, in the past week) when they answered the question. Finally, the NSCH is a household survey designed to be representative of noninstitutionalized children; as such, estimates may not be generalizable to children who are homeless, children in temporary housing, or incarcerated young persons, among others. Despite these limitations, the NSCH is uniquely designed to produce estimates of bullying victimization among children and adolescents at the state level.
Conclusion
Rates of bullying victimization varied across states. These findings highlight the need for universal prevention efforts and targeted services for children and adolescents to address bullying, especially among children in younger age groups and in states with the highest rates of bullying victimization.
Footnotes
Authors’ Note
The findings and conclusions in this article are those of the authors, who are responsible for its content, and do not necessarily represent the views of the Health Resources and Services Administration (HRSA). No statement in this article should be construed as an official position of HRSA or of the US Department of Health and Human Services.
Declaration of Conflicting Interests
The authors declared no potential conflicts of interest with respect to the research, authorship, and/or publication of this article.
Funding
The authors declared no financial support with respect to the research, authorship, and/or publication of this article.