
Abstract
Objectives:
The incidence of gestational diabetes mellitus (GDM) in the United States has increased during the past several decades. The objective of this study was to use birth records and a combination of statistical and geographic information system (GIS) analyses to evaluate GDM rates among subgroups of pregnant women in Michigan.
Materials and Methods:
We obtained data on maternal demographic and health-related characteristics and regions of residence from 2013 Michigan birth records. We geocoded (ie, matched to maternal residence) the birth data, calculated proportions of births to women with GDM, and used logistic regression models to determine predictors of GDM. We calculated odds ratios (ORs) from the exponentiated beta statistic of the logistic regression test. We also used kernel density estimations and local indicators of spatial association (LISA) analyses to determine GDM rates in regions in the state and identify GDM hot spots (ie, areas with a high GDM rate surrounded by areas with a high GDM rate).
Results:
We successfully geocoded 104 419 of 109 168 (95.6%) births in Michigan in 2013. Of the geocoded births, 5185 (5.0%) were to mothers diagnosed with GDM. LISA maps showed a hot spot of 8 adjacent counties with high GDM rates in southwest Michigan. Of 11 064 births in the Southwest region, 829 (7.5%) were to mothers diagnosed with GDM, the highest rate in the state and a result confirmed by geospatial analyses.
Practice Applications:
Birth data and GIS analyses may be used to measure statewide pregnancy-associated disease risk and identify populations and geographic regions in need of targeted public health and maternal–child health interventions.
Because of varying and evolving screening and diagnostic criteria, it is difficult to compare the prevalence of gestational diabetes mellitus (GDM) across populations. However, several large-scale reviews have concluded that the prevalence of GDM is rising across the United States and North America, with estimates ranging from 3.0% to 17.0%. 1,2 The incidence of obesity has also been increasing, and obesity is associated with a higher risk of GDM compared with mothers who are at a healthy weight. 3 According to birth records for 2008, approximately 5% of pregnant women in the United States had GDM. However, according to the 2010 Pregnancy Risk Assessment Monitoring System (PRAMS) survey, the incidence of GDM was as high as 9%, involving 1 of every 360 000 US births that year. 2
GDM is associated with increased morbidity for affected women and both increased morbidity and mortality for their infants. 4 Half of women diagnosed with GDM during pregnancy will progress to type 2 diabetes mellitus (hereinafter, type 2 diabetes) within 5 years of delivery, 5 and 60% will develop type 2 diabetes at some point in their lifetime. 6 Yet, some women in groups at high risk for GDM, such as African American and Asian Indian women, may be less aware of their need to seek evaluation for and treatment of this condition than women in other racial/ethnic groups. 7,8 The increasing incidence, high morbidity, and misperceptions of GDM point to the importance of targeted public health programming aimed at pregnant women.
The percentage of GDM in Michigan during 2013-2015, the most recent 3-year period for which data were available, was 5.1% of all births. 9 However, the risk of GDM for women in certain high-risk groups (eg, overweight women) in Michigan may be higher or lower than the state average, and the relative risk may be unpredictable. For example, based on Michigan Department of Health and Human Services birth statistics for 2013, mothers living in poverty-level census tracts in Michigan had a significantly lower incidence of GDM than mothers living in census tracts classified as affluent or upper-middle class (4.6% vs 5.3%). 9
Because some variations in Michigan’s GDM rates seem to contradict expectations and previously published work on national GDM rates, 6,7 we examined the relationships between GDM risk and various maternal demographic and health-related characteristics and regions of residence in Michigan. The objective of this study was to use state birth records data and geographic information systems (GIS) analyses to measure and compare GDM risks among maternal subgroups and to identify contiguous geographic hot spots of high GDM densities and rates in Michigan.
Materials and Methods
We retrospectively analyzed birth records data for 109 968 singleton live births to Michigan residents in 2013. We obtained these data from Michigan Vital Birth Records, Michigan Department of Health and Human Services, through a data-sharing agreement between the Health Data Research, Analysis and Mapping Center at Western Michigan University and the Kalamazoo County Health and Community Services Department (unpublished data, Michigan Department of Health and Human Services, June 2015). The Human Subjects Institutional Review Board of Western Michigan University approved this study.
Measures and Operationalized Definitions
We created a database that treated GDM as a dichotomous maternal outcome variable (ie, yes or no). The database also included information about maternal demographic characteristics and health risk factors, which we categorized as follows: age (≤20, 21-30, and ≥31), body mass index (BMI; underweight, healthy weight, overweight/obese), 10 education level (<high school diploma, high school diploma or equivalent, associate or bachelor degree, or graduate or professional degree), race/ethnicity (non-Hispanic white, non-Hispanic black, Hispanic, Asian Indian, other Asian [Filipino, Asian/Pacific Islander], or race unknown [not specified]), Medicaid-paid delivery of baby (yes or no) as a proxy for income, tobacco use during pregnancy (yes or no), alcohol use during pregnancy (yes or no), and level of prenatal care (using levels from the Kotelchuk Index or the Adequacy of Prenatal Care Utilization Index 11 : adequate plus, adequate, intermediate, or inadequate). Inadequate refers to prenatal care begun after the fourth month of pregnancy or <50% of recommended visits received. Intermediate refers to prenatal care begun by the fourth month of pregnancy and 50%-79% of recommended visits received. Adequate refers to prenatal care begun by the fourth month of pregnancy and 80%-109% of recommended visits received. Adequate plus refers to prenatal care begun by the fourth month of pregnancy and ≥110% of recommended visits received. 11
We analyzed data by using descriptive, linear-by-linear association (Pearson χ2 test) and logistic regression analyses to supplement our GDM regional mapping analyses. We tabulated results of the descriptive analysis as percentages, with P values generated by using the Pearson χ2 test, linear-by-linear association results as χ2 and P values, and regression results as odds ratios (ORs) and 95% confidence intervals (CIs). We used SPSS version 22 12 for statistical analyses, and we considered P < .05 to be significant.
We attempted to geocode (ie, match to a maternal residence) the record of each singleton birth in Michigan in 2013 (n = 109 168). We then added the relevant Michigan Department of Transportation (MDOT) region to the record of each successfully geocoded birth in the database. The 7 MDOT regions, which we also included in the logistic regression analysis, were Superior, North, Grand, Southwest, University, Bay, and Metro (Figure 1). 13 Births not able to be geocoded did not return a street address match when the location information was analyzed by ArcGIS and may have belonged to a post office box or apartment building address. 14
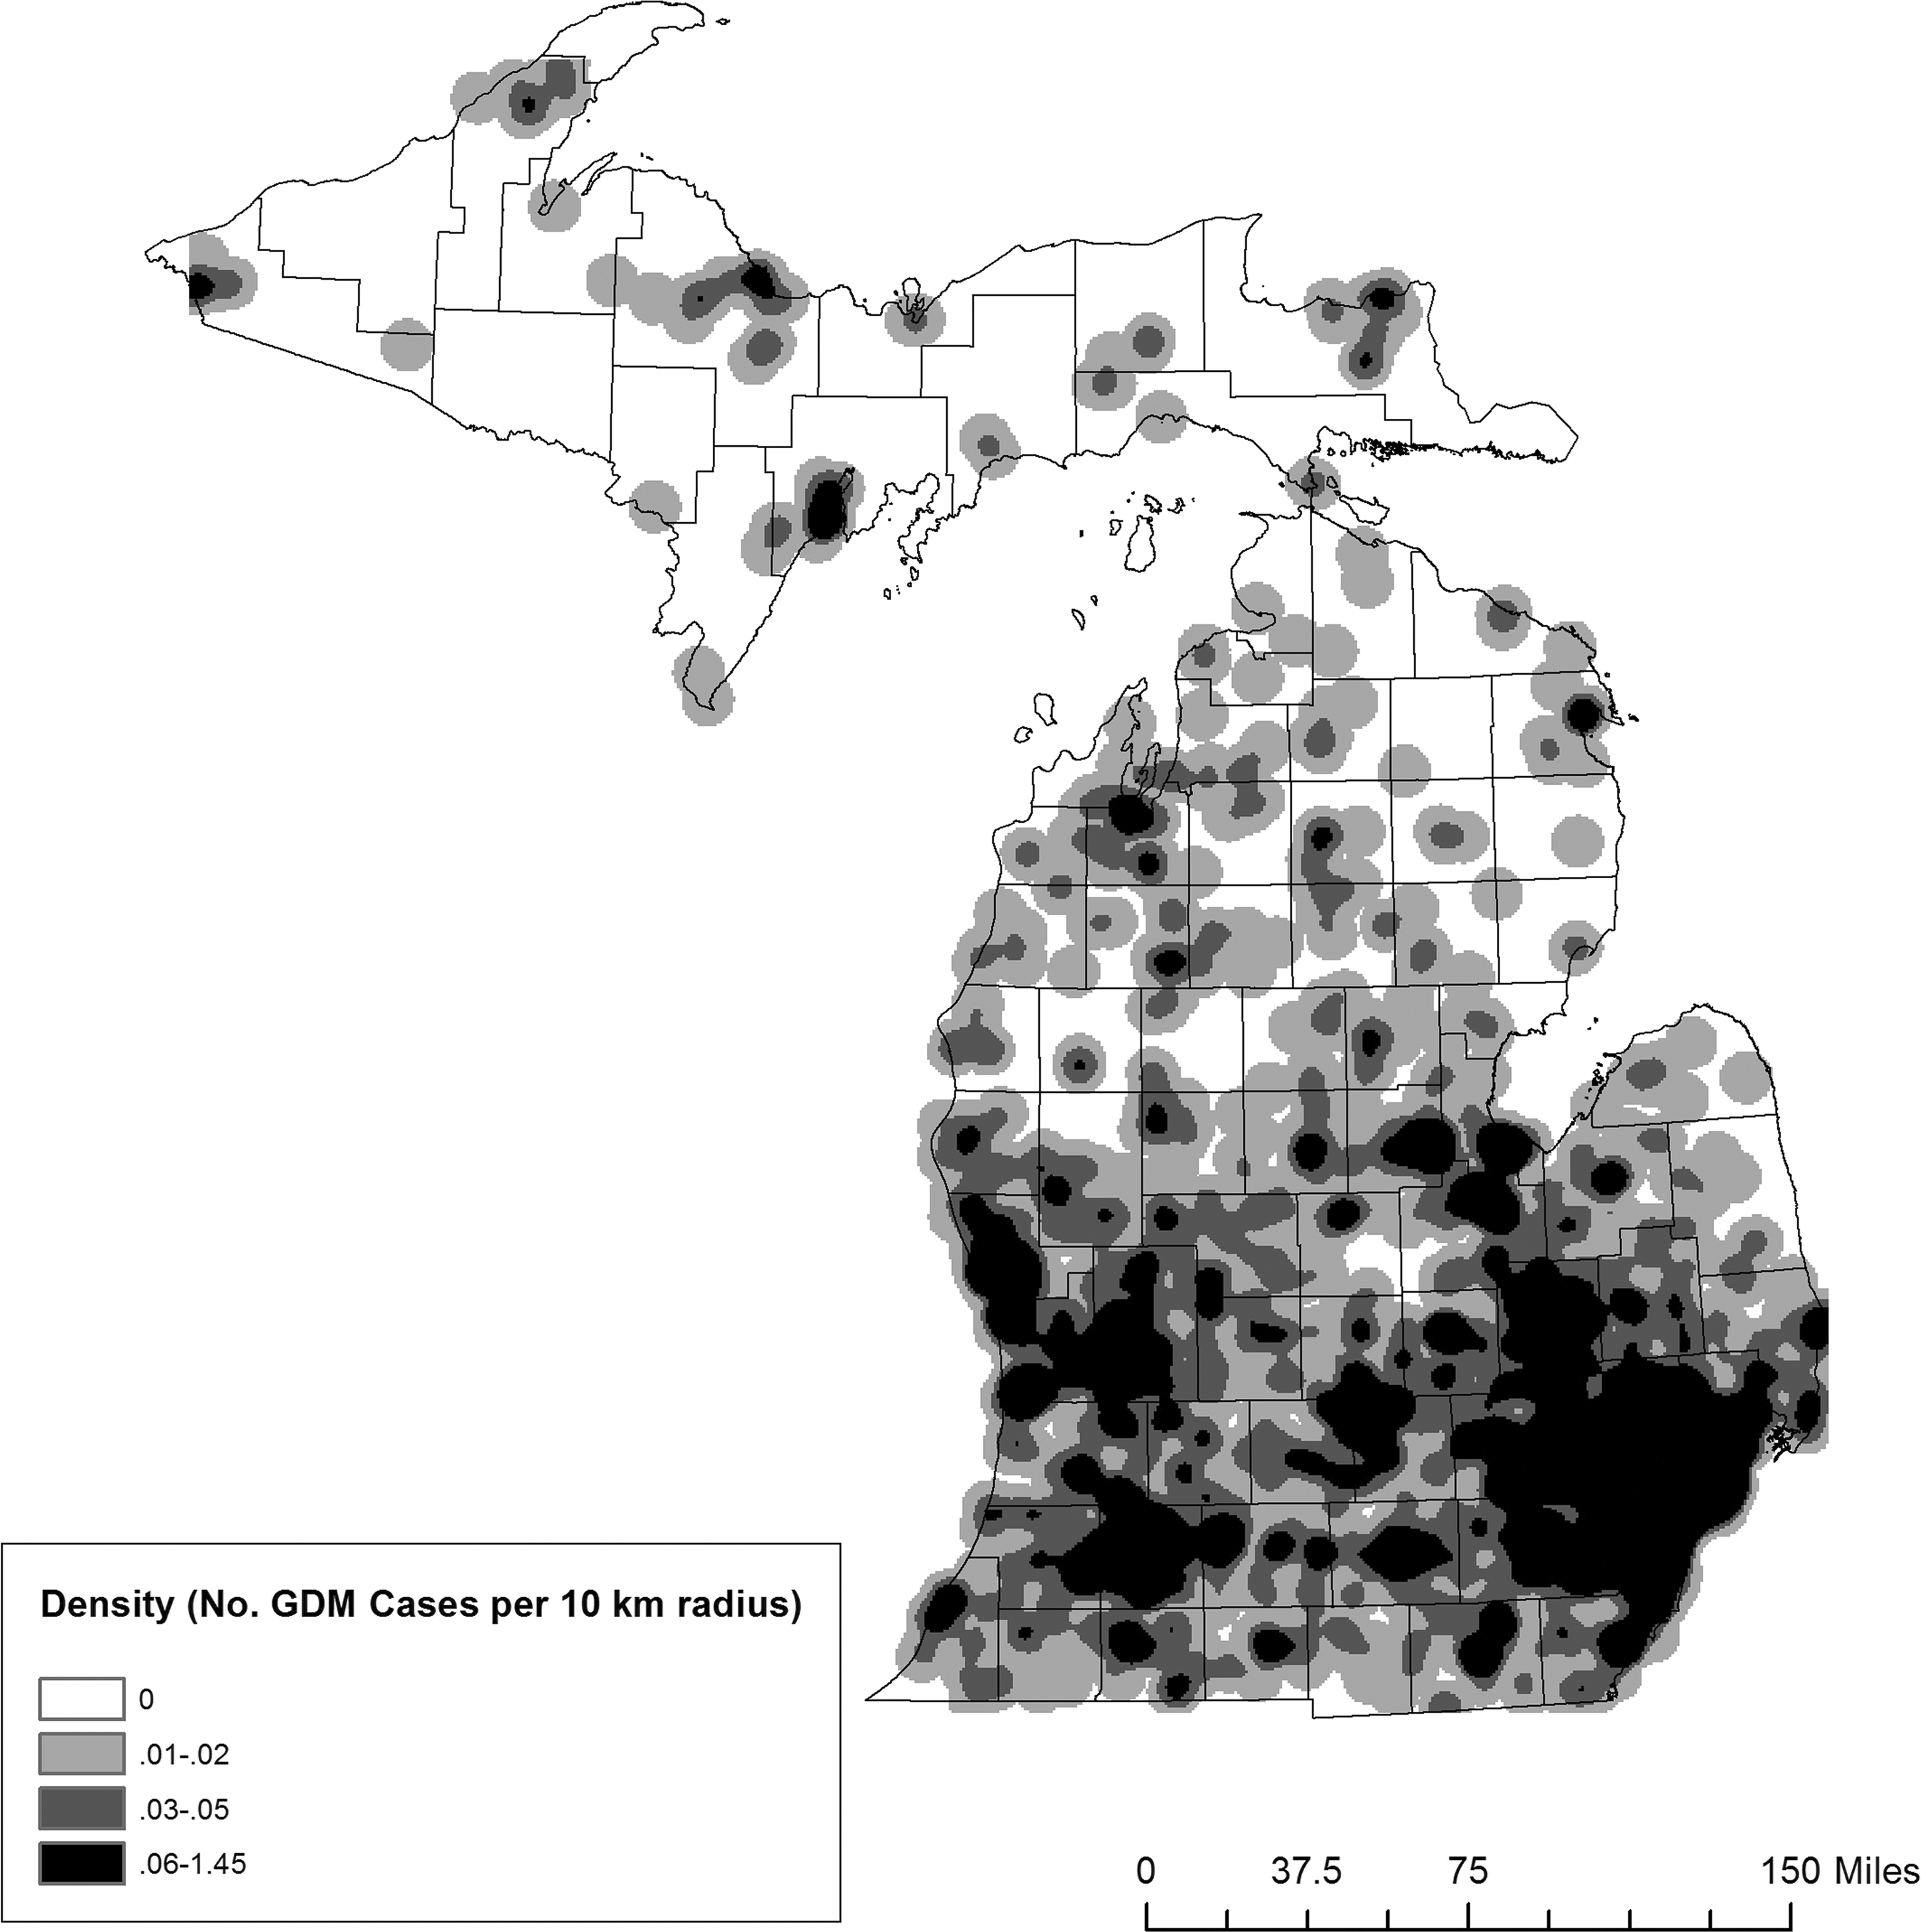
Density of gestational diabetes mellitus (GDM)–related births per 10-km radius area of maternal residence, Michigan, 2013. Hot spots of highest density of GDM-related births located in the most densely populated areas of the state: the urban centers of Metro Detroit, Lansing, and Grand Rapids, centered within the Metro, University, and Grand Michigan Department of Transportation (MDOT) regions, respectively. 13 Density of GDM-related births in these high-density areas ranged from 0.27 to 1.45 births per 10-km radius. Kernel density estimation map of maternal residence created by using ArcGIS version 10.3.1. 14 Birth data obtained from Michigan Vital Birth Records (unpublished report, Michigan Department of Health and Human Services, June 2015).
Geospatial Analyses
We analyzed the geospatial patterns of GDM rates for mothers in Michigan by using ArcGIS version 10.3.1, 14 which allowed us to create kernel density estimation maps of GDM densities and rates, by location of maternal residence. Some public health researchers advocate the use of variable-distance kernel density estimation, which incorporates knowledge of the underlying population distribution. 15 We used the density of total births in each 10-km radius area of Michigan, because visualization was clearest at that level.
We calculated GDM rates per 10-km area by dividing the densities of births to mothers with GDM by the total births for each 500-m geospatial grid cell (ie, square area around the point marking a mother’s residence). We also calculated GDM rates for each county in Michigan. With these results, we then conducted a local indicators of spatial association (LISA) analysis by using GeoDa 1.12. 16 We conducted a LISA analysis to evaluate the extent of geospatial clustering of counties with similar GDM rates. This analysis allowed us to determine the presence of significant clusters across the state where counties with high GDM rates were surrounded by other counties with high GDM rates. GeoDa defined significance as P < .01.
Results
Of 109 168 singleton live births to Michigan mothers in 2013, we successfully geocoded 104 419 (95.6%) births. Of the 5405 births to mothers who had a diagnosis of GDM, we successfully geocoded 5185 (95.9%) births (Table 1).
All geocodeda births and geocoded births involving maternal gestational diabetes mellitus (GDM), by Michigan Department of Transportation (MDOT) region, 13 Michigan Vital Birth Records, Michigan, 2013
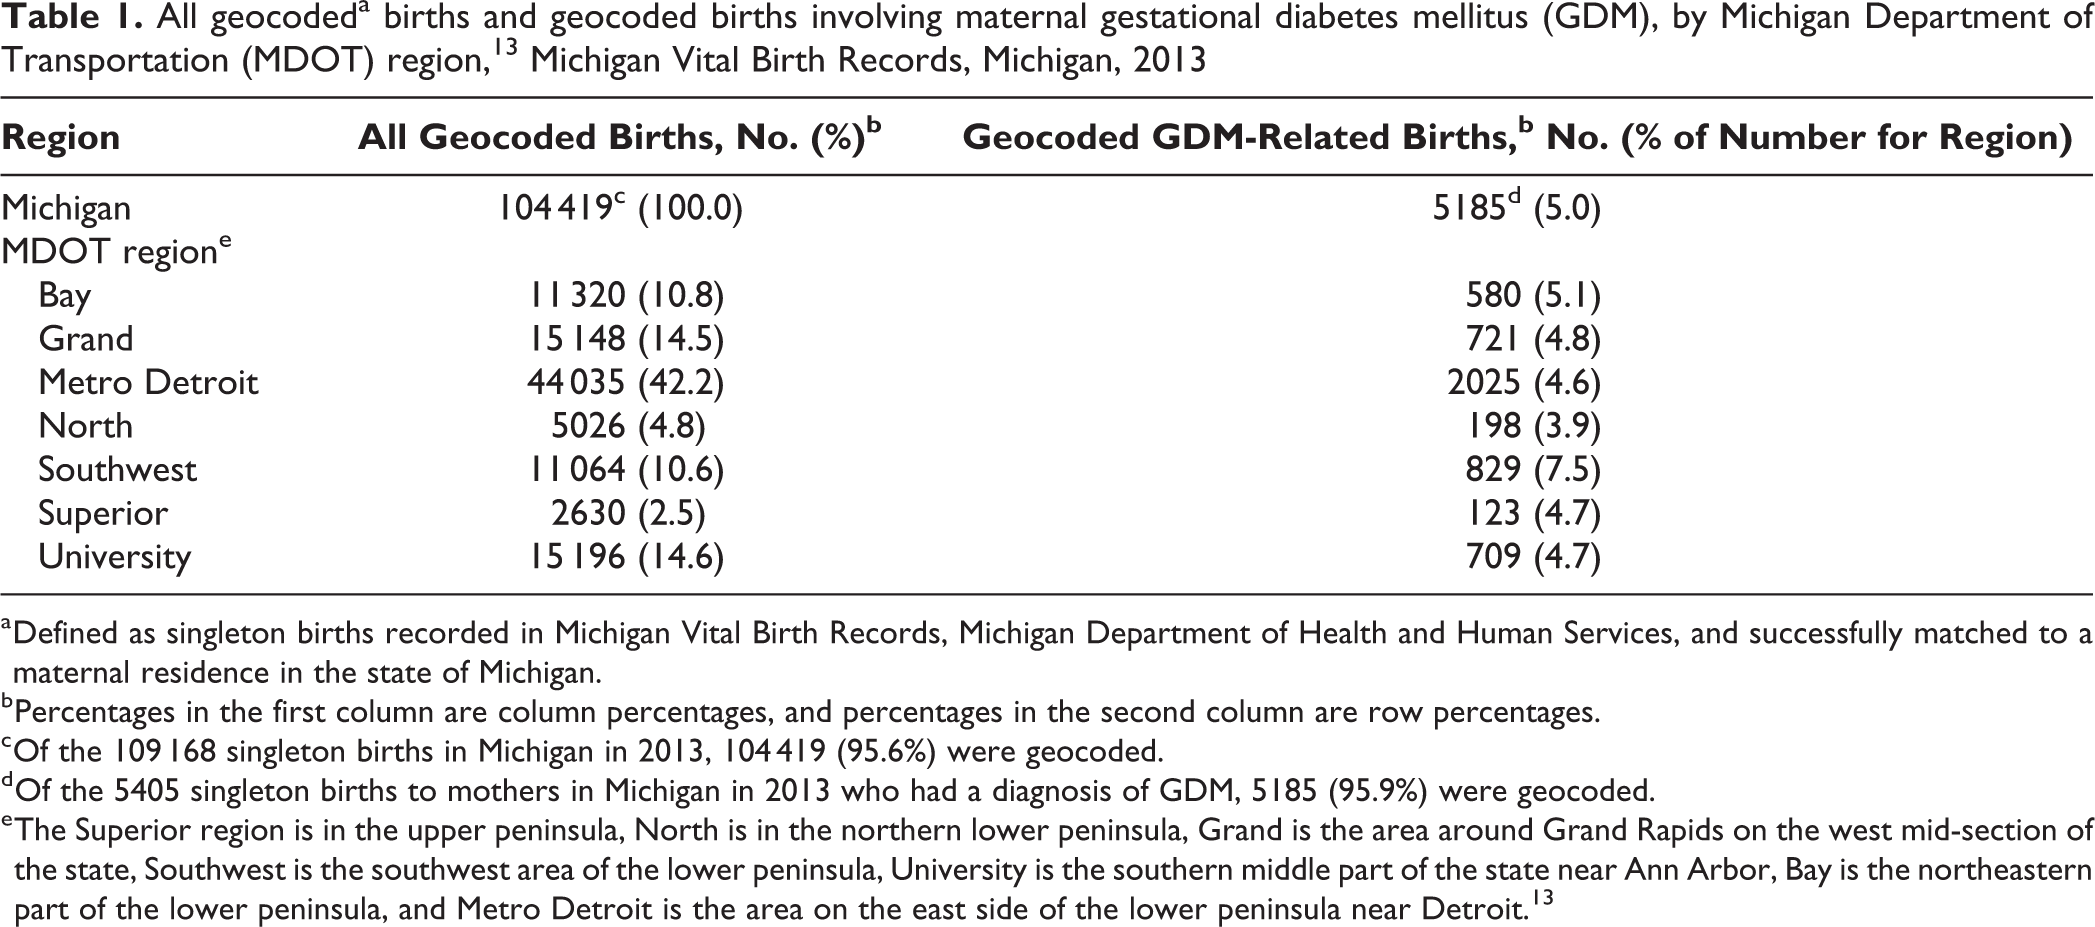
a Defined as singleton births recorded in Michigan Vital Birth Records, Michigan Department of Health and Human Services, and successfully matched to a maternal residence in the state of Michigan.
b Percentages in the first column are column percentages, and percentages in the second column are row percentages.
c Of the 109 168 singleton births in Michigan in 2013, 104 419 (95.6%) were geocoded.
d Of the 5405 singleton births to mothers in Michigan in 2013 who had a diagnosis of GDM, 5185 (95.9%) were geocoded.
e The Superior region is in the upper peninsula, North is in the northern lower peninsula, Grand is the area around Grand Rapids on the west mid-section of the state, Southwest is the southwest area of the lower peninsula, University is the southern middle part of the state near Ann Arbor, Bay is the northeastern part of the lower peninsula, and Metro Detroit is the area on the east side of the lower peninsula near Detroit. 13
GDM Rates
Rates of GDM varied by MDOT region. Of 11 064 births in the Southwest region, 829 (7.5%) occurred among mothers with GDM. This GDM rate was higher than the state average GDM rate (5.0%) and the GDM rate in any of the other MDOT regions (range, 3.9%-5.1%). In addition, whereas the 11 064 births in the Southwest region represented only 10.6% of all geocoded births in the state, the 829 births to mothers diagnosed with GDM in that region represented 16.0% (829 of 5185) of all GDM-related births in the state (Table 1).
The GDM rates increased significantly as maternal age increased, ranging from 148 of 7782 (1.9%) births to women aged ≤20 to 2675 of 35 347 (7.6%) births to women aged ≥31 (P < .001; Table 2). Similarly, GDM rates rose significantly as maternal BMI increased, ranging from 77 of 3665 (2.1%) births to underweight mothers to 3813 of 54 218 (7.0%) births to overweight or obese mothers (P < .001).
All births and births involving maternal gestational diabetes mellitus (GDM), by maternal demographic and health-related characteristics, Michigan Vital Birth Records, Michigan, 2013a
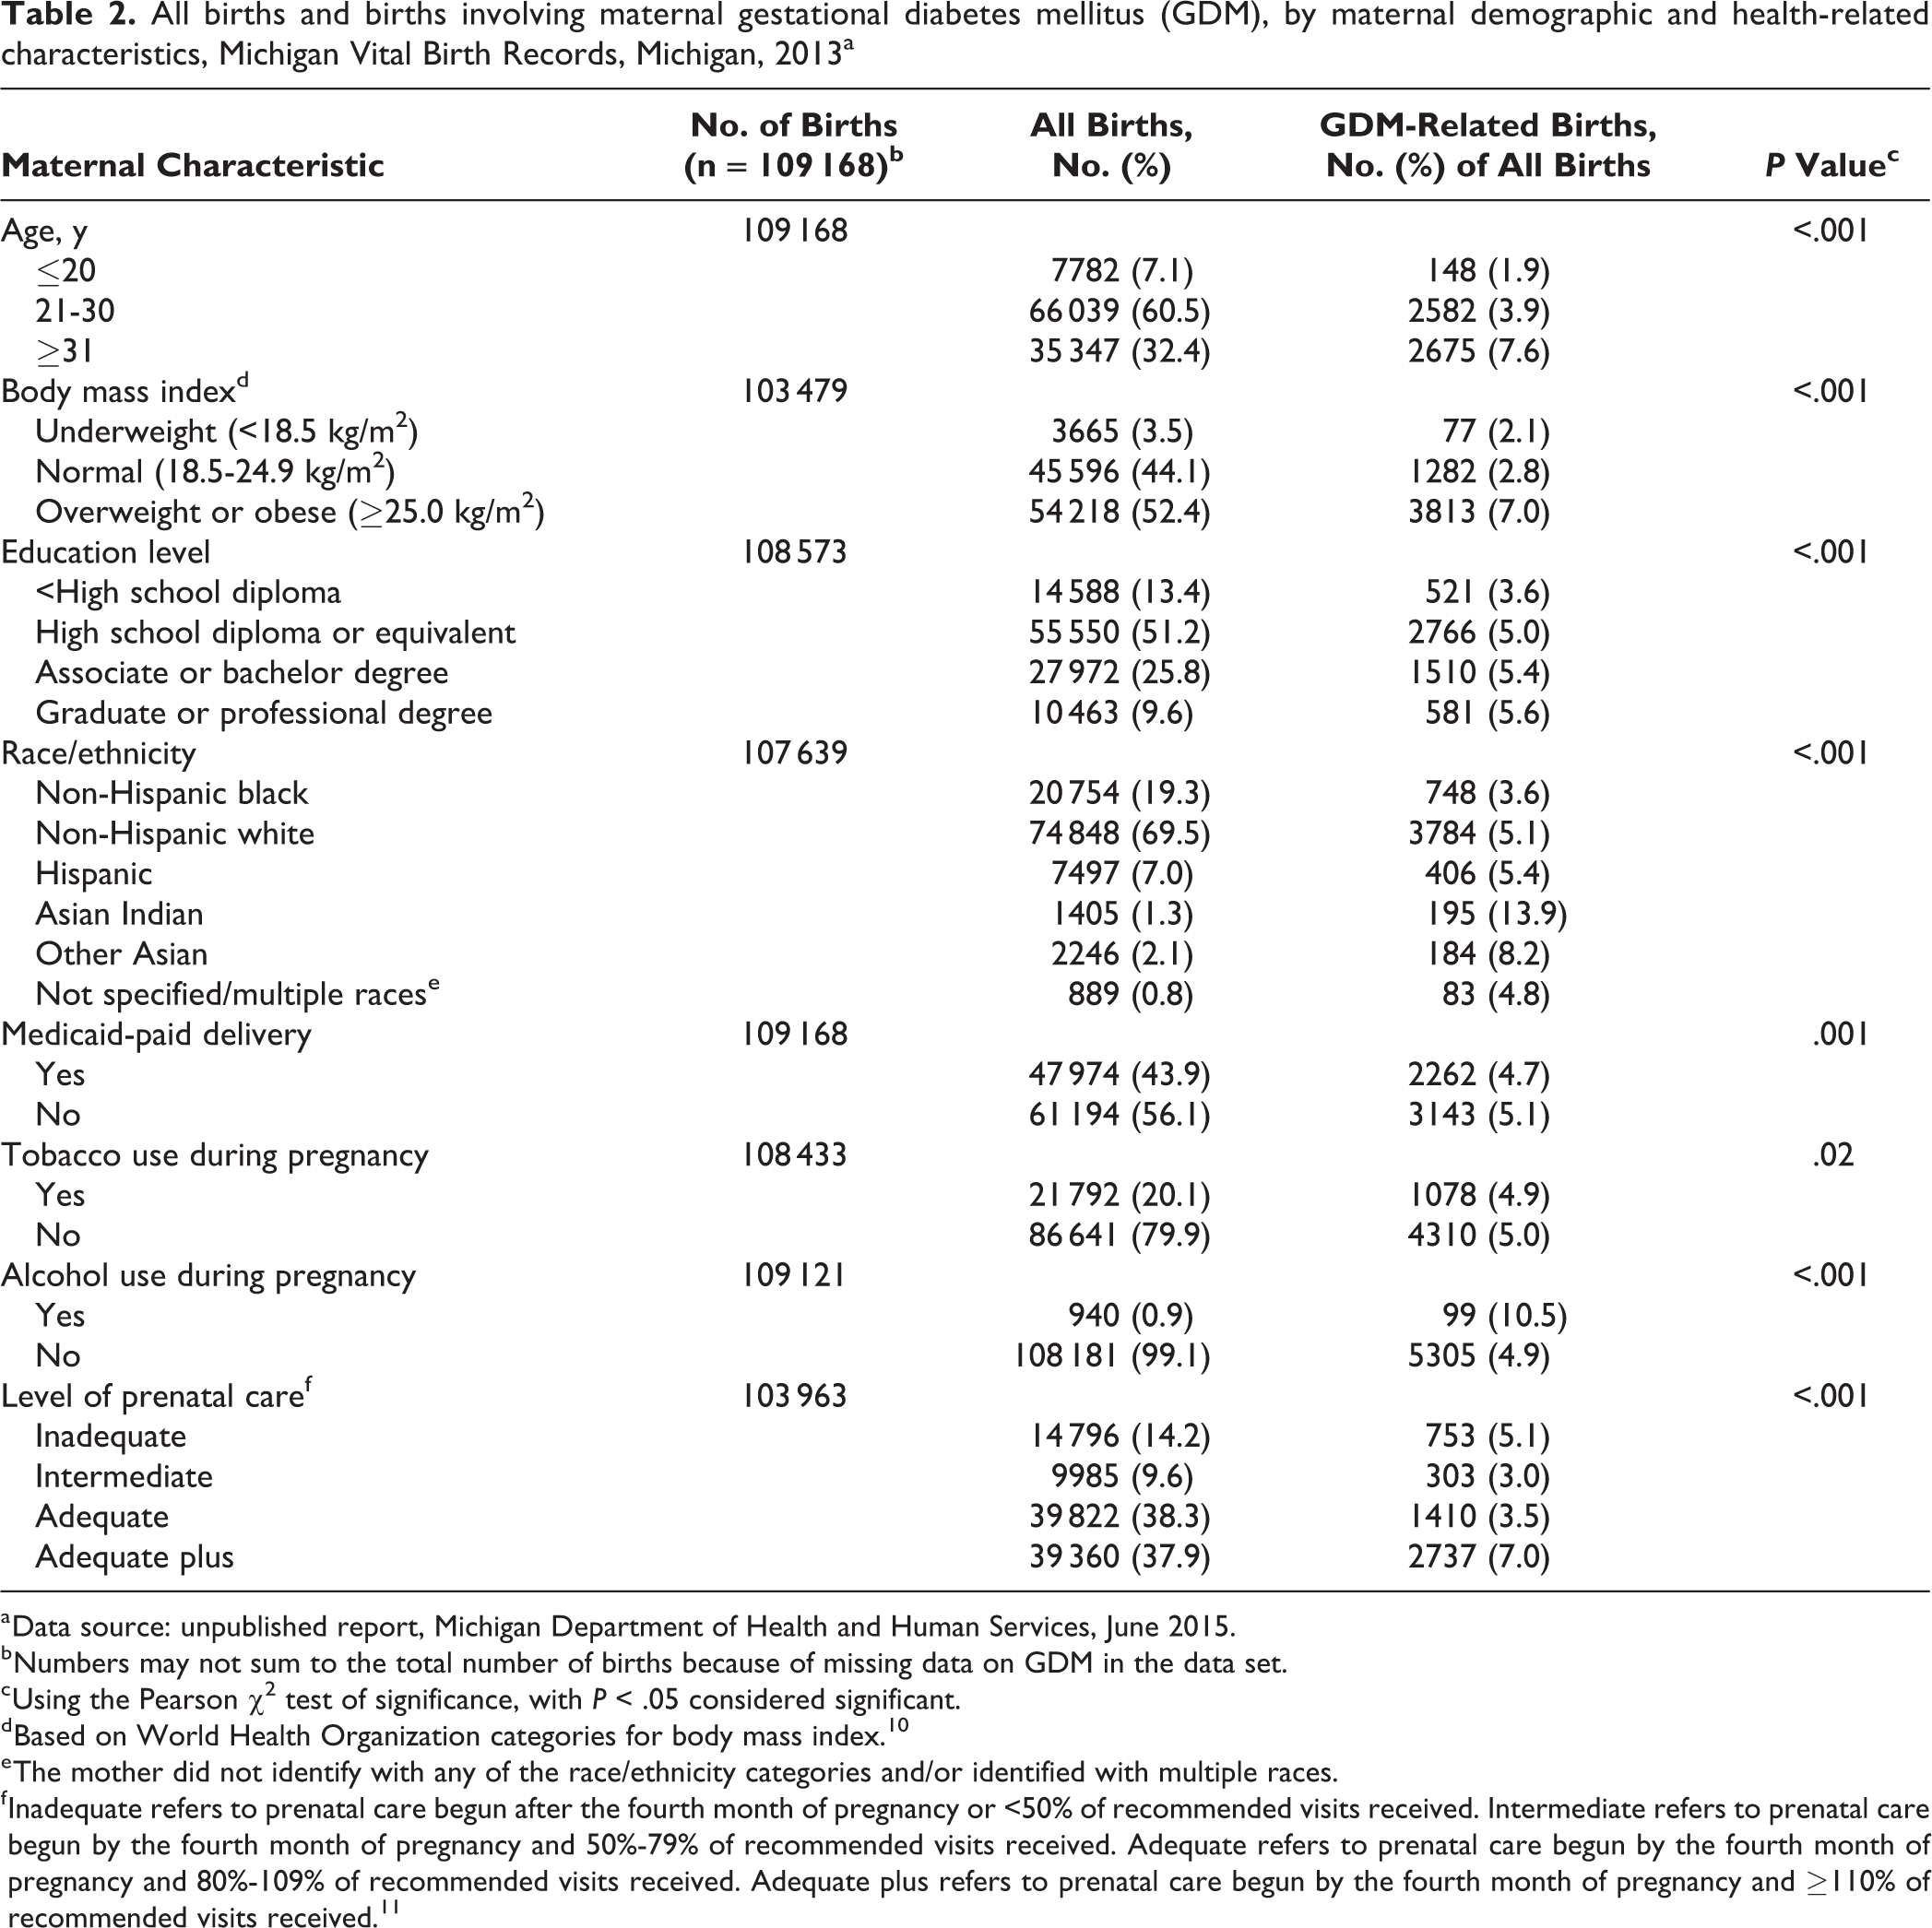
a Data source: unpublished report, Michigan Department of Health and Human Services, June 2015.
b Numbers may not sum to the total number of births because of missing data on GDM in the data set.
c Using the Pearson χ2 test of significance, with P < .05 considered significant.
d Based on World Health Organization categories for body mass index. 10
e The mother did not identify with any of the race/ethnicity categories and/or identified with multiple races.
f Inadequate refers to prenatal care begun after the fourth month of pregnancy or <50% of recommended visits received. Intermediate refers to prenatal care begun by the fourth month of pregnancy and 50%-79% of recommended visits received. Adequate refers to prenatal care begun by the fourth month of pregnancy and 80%-109% of recommended visits received. Adequate plus refers to prenatal care begun by the fourth month of pregnancy and ≥110% of recommended visits received. 11
By education level, the GDM rate was significantly lower among women with <high school diploma (3.6%) than among women with higher education levels (Table 2). A significant linear-by-linear association (χ2 = 22.8, P < .001) indicated that as the level of maternal education increased, the GDM rate also increased.
By race/ethnicity, GDM rates did not differ significantly between non-Hispanic white mothers and mothers who self-identified as multiple races (approximately 5% for all; Table 2). The lowest GDM rate was among non-Hispanic black mothers (3.6%), and the highest GDM rates were among mothers who were Asian Indian (13.9%) and other Asian (8.2%). However, Asian Indian and other Asian women comprised only 3651 (3.3%) of the total sample.
The GDM rate among the 940 mothers who used alcohol during pregnancy (10.5%) was significantly higher than the GDM rate among the 108 181 women who did not use alcohol during pregnancy (4.9%; χ2 = 63.7, P < .001). Also, the GDM rate among the 39 360 mothers who received the highest level of prenatal care (adequate plus, 7%) was significantly higher than the GDM rates for women who received lower levels of prenatal care (χ2 = 594.9, P < .001).
Maternal Characteristics and GDM Risk
The highest risk for GDM-related births was among mothers who were Asian Indian (OR = 3.65; 95% CI, 3.10-4.30) and other Asian (OR = 2.10; 95% CI, 1.79-2.46) compared with non-Hispanic white (P < .001), were overweight or obese compared with normal weight (OR = 2.65; 95% CI, 2.48-2.83; P < .001), were aged ≥31 compared with aged 21-30 (OR = 2.04; 95% CI, 1.83-2.11; P < .001), and used alcohol during pregnancy compared with those who did not (OR = 2.26; 95% CI, 1.82-2.81; P < .001). Mothers who received inadequate (OR = 1.56; 95% CI, 1.34 -1.81) or adequate-plus (OR = 1.27; 95% CI, 1.08 -1.49; P = .005) levels of prenatal care, compared with mothers who received intermediate care, and mothers residing in the Southwest region (OR = 1.52; 95% CI, 1.29 -1.71; P < .001), compared with mothers in the Metro region, also had significantly higher risks for GDM-related births.
Mothers who were aged ≤20 (OR = 0.60; 95% CI, 0.50-0.71; P < .001), were underweight (OR = 0.78; 95% CI, 0.62-0.99; P = .04), received adequate prenatal care (OR = 0.71; 95% CI, 0.59-0.85; P < .001), and were non-Hispanic black (OR = 0.72; 95% CI, 0.66-0.79; P < .001) had significantly lower risks of GDM births than their referents (Table 3).
Risk of maternal gestational diabetes mellitus during births, by maternal demographic and health characteristics, based on logistic regression analysis, Michigan Vital Birth Records, Michigan, 2013a
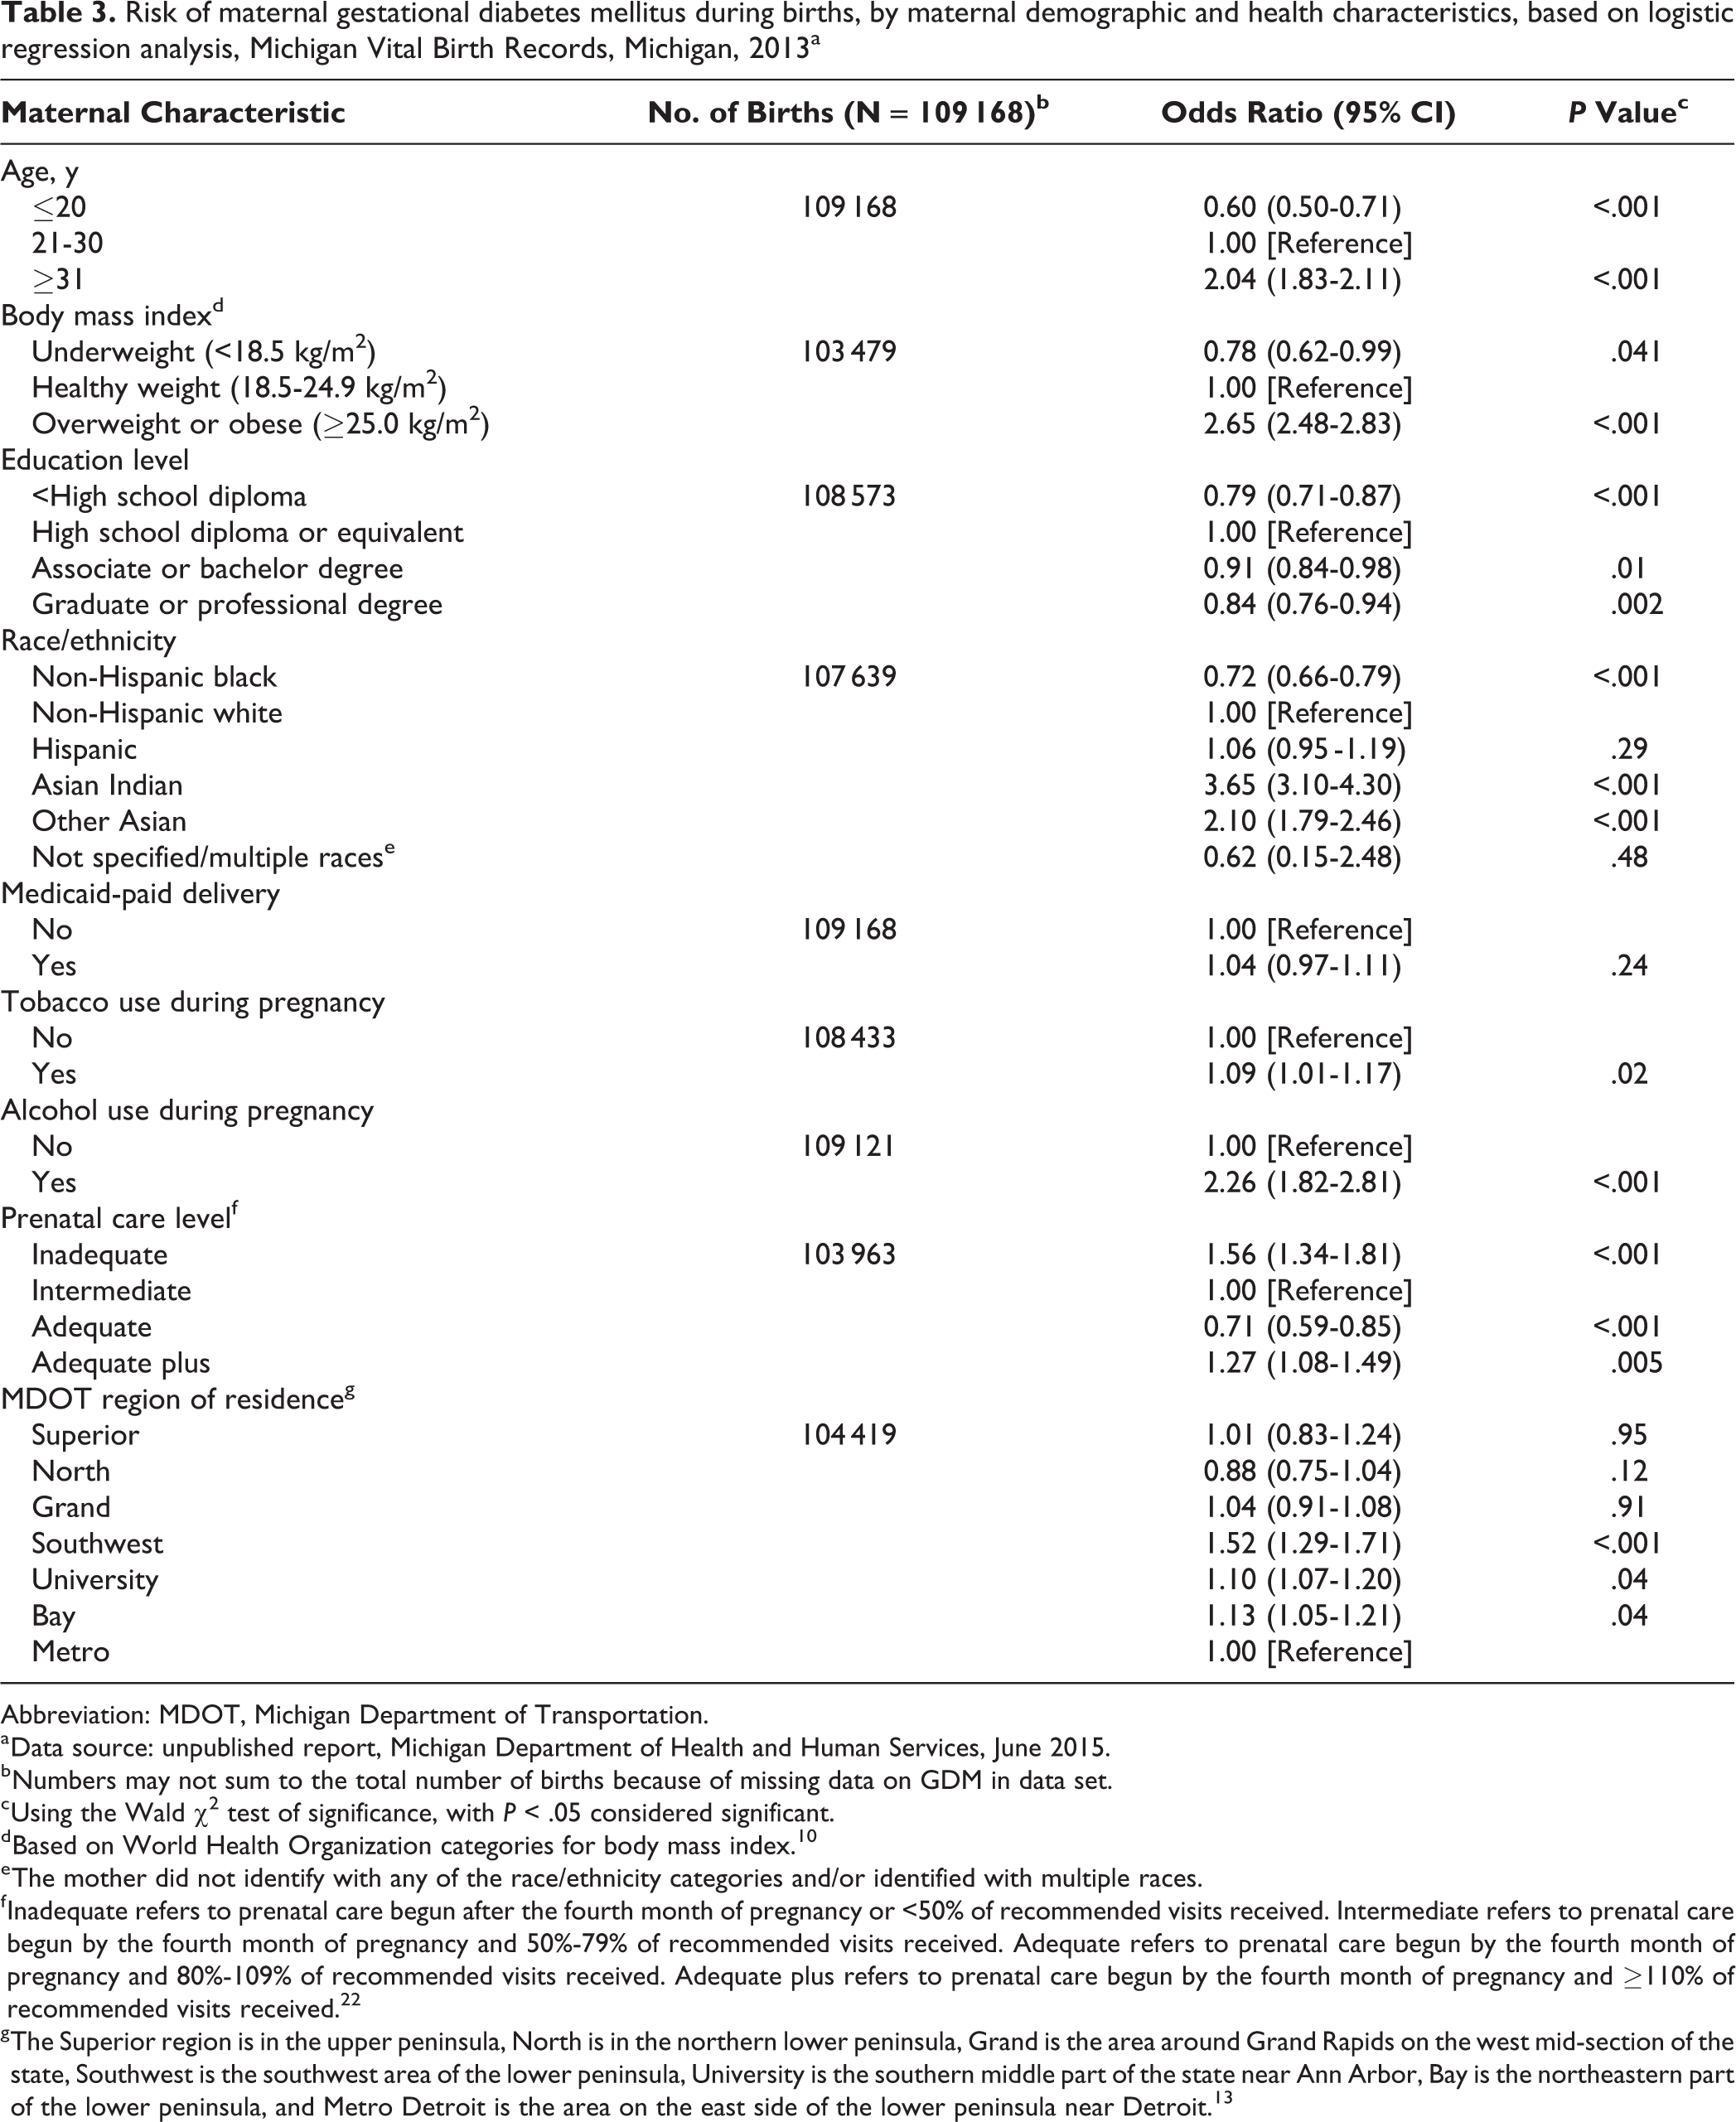
Abbreviation: MDOT, Michigan Department of Transportation.
a Data source: unpublished report, Michigan Department of Health and Human Services, June 2015.
b Numbers may not sum to the total number of births because of missing data on GDM in data set.
c Using the Wald χ2 test of significance, with P < .05 considered significant.
d Based on World Health Organization categories for body mass index. 10
e The mother did not identify with any of the race/ethnicity categories and/or identified with multiple races.
f Inadequate refers to prenatal care begun after the fourth month of pregnancy or <50% of recommended visits received. Intermediate refers to prenatal care begun by the fourth month of pregnancy and 50%-79% of recommended visits received. Adequate refers to prenatal care begun by the fourth month of pregnancy and 80%-109% of recommended visits received. Adequate plus refers to prenatal care begun by the fourth month of pregnancy and ≥110% of recommended visits received. 22
g The Superior region is in the upper peninsula, North is in the northern lower peninsula, Grand is the area around Grand Rapids on the west mid-section of the state, Southwest is the southwest area of the lower peninsula, University is the southern middle part of the state near Ann Arbor, Bay is the northeastern part of the lower peninsula, and Metro Detroit is the area on the east side of the lower peninsula near Detroit. 13
Geospatial GDM Hot Spots
The highest densities of GDM-related births (0.27-1.45 births per 10-km radius area) were in the most densely populated areas of the state, particularly the urban centers of Metro Detroit, Lansing, and Grand Rapids, which were centered within the Metro, University, and Grand regions, respectively (Figure 1). However, when we controlled the GDM-related birth density per 10-km radius area for total number of births occurring in that area, the pattern of GDM hot spots shifted from the urban centers to Kalamazoo County in the Southwest region (Figure 2). This major hot spot contained contiguous areas with GDM rates higher than 20%, which were the highest in the state. The LISA analysis identified geospatial clustering involving 8 counties with high GDM rates that were adjacent to other counties with high GDM rates, and this cluster was located around Kalamazoo County, in the Southwest region.
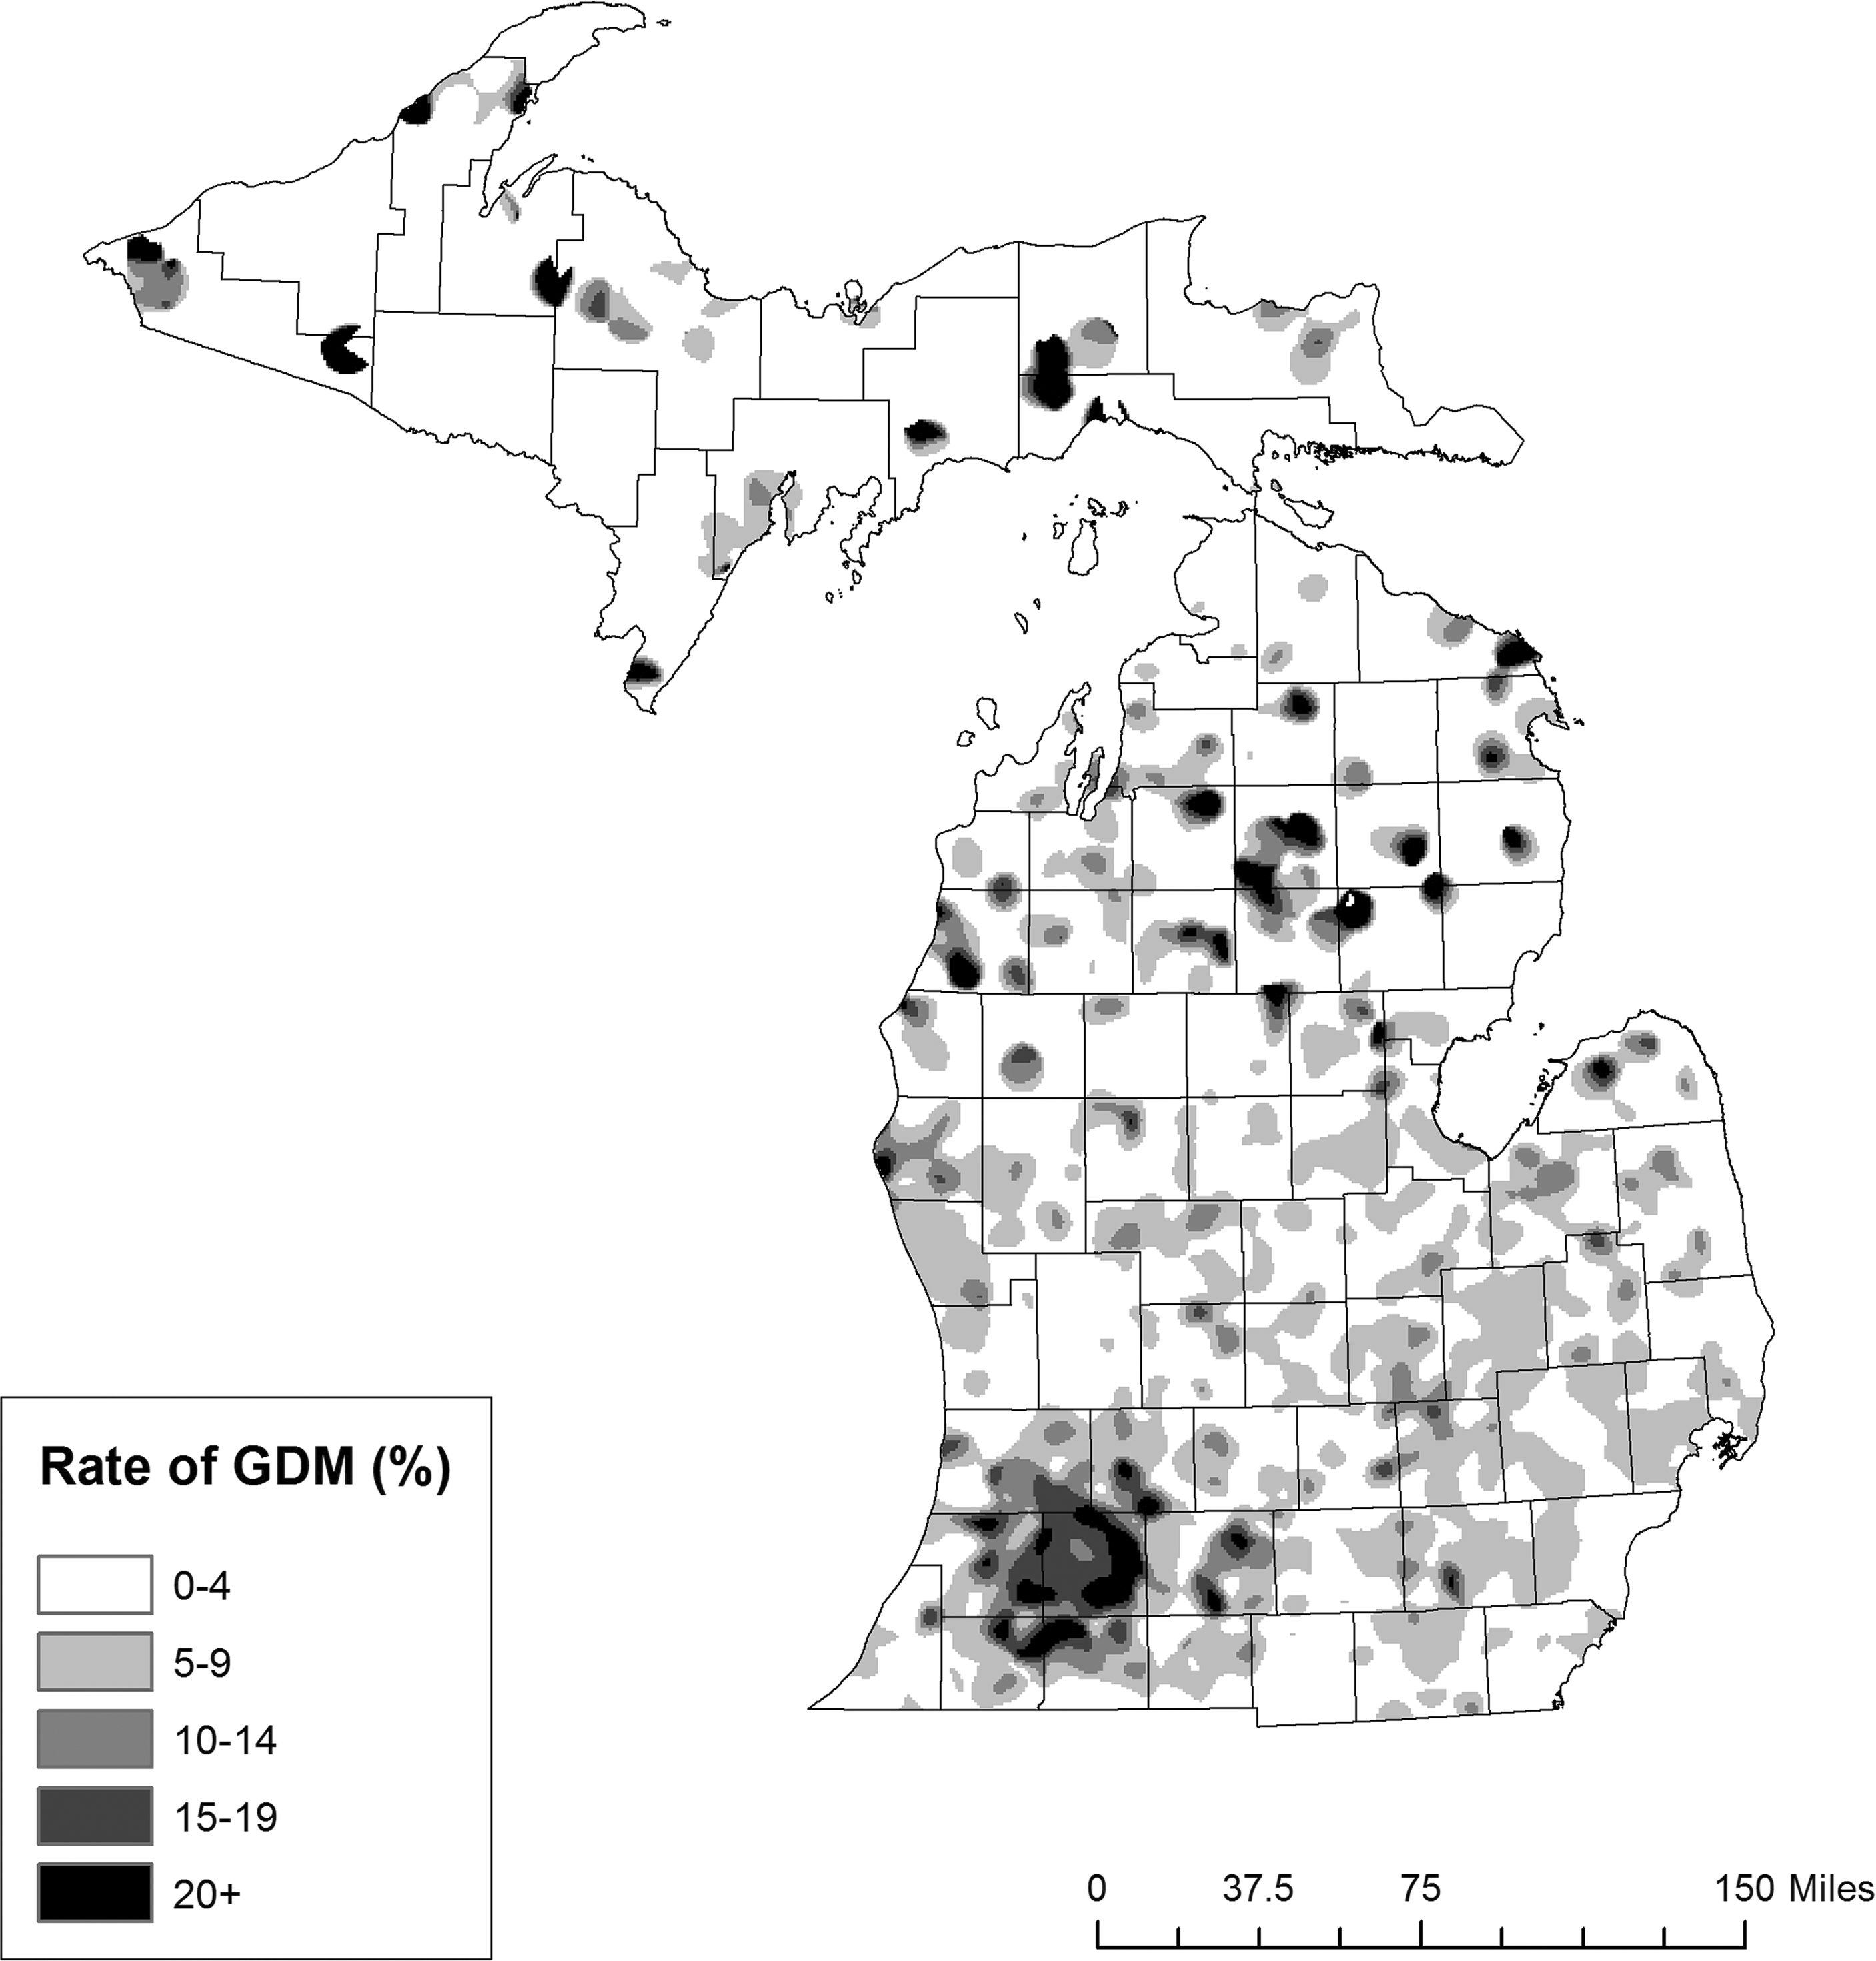
Rates of gestational diabetes mellitus (GDM)–related births per 10-km radius of maternal residence, Michigan, 2013. GDM rates calculated per 10-km area by dividing the densities of births to mothers with GDM by total births for each 500-m geospatial grid cell. Using this technique to control for total births, the major hot spot was located in Kalamazoo County, in the Southwest Michigan Department of Transportation region. 13 This hot spot was the largest collection of contiguous areas with GDM rates of 15%. Many of the areas within this hot spot had GDM rates of ≥20%, which were the highest rates in the state and more than 4 times the state average. Kernel density estimation map of maternal residence created by using ArcGIS version 10.3.1. 14 Birth data obtained from Michigan Vital Birth Records (unpublished report of Michigan Department of Health and Human Services, June 2015).
Discussion
The GDM rates in Michigan in 2013 varied by region of maternal residence and by several other maternal characteristics. Southwest Michigan was the only region with a GDM rate higher than the Michigan state average, and regression analysis showed that maternal residence in that region, compared with other regions, was associated with a significantly higher risk of GDM during pregnancy. In geospatial analysis, the Southwest region was a contiguous hot spot of high GDM rates, and it was an area of high GDM rates surrounded and influenced by other areas with high GDM rates. These data could help inform public health policy makers and practitioners about which regions to target for state diabetes prevention services.
Reports published in 2015 and 2016 showed that maternal age and body weight are useful predictors of GDM in the United States, with older maternal age and overweight or obese BMI linked to a higher risk of GDM compared with younger maternal age and normal BMI. 7,17 Our results support these associations. On the other hand, our finding of no difference in GDM risk between women with Medicaid-paid birth and women without Medicaid-paid birth conflicts with work published in 2010 showing elevated GDM rates throughout the United States among mothers who had low incomes compared with mothers who had high incomes. 6 The introduction of the Affordable Care Act and Medicaid expansion may have increased the adequacy of prenatal care among low-income women in Michigan and eliminated the disparity in care between women with and without Medicaid. However, we did not examine the effect of Medicaid expansion on GDM risk in the current study.
By race/ethnicity, we found the highest risk of GDM among Asian Indian and other Asian women and the lowest risk of GDM among non-Hispanic black women. Whereas other studies have also found an elevated risk of GDM among Asian mothers relative to non-Hispanic white mothers, 4,18 to our knowledge no study has found an association between non-Hispanic black women and low GDM rates. This finding of lower GDM risk among non-Hispanic black mothers in Michigan was surprising, because non-Hispanic black mothers have been reported to be overrepresented among overweight and obese women, 3,19 a group that we found to be at higher risk of GDM than mothers with a normal BMI. The lower GDM risk among non-Hispanic black mothers may be related to the level of prenatal care they received, but we did not evaluate that association.
Receiving the highest level of prenatal care and receiving the lowest level of prenatal care were each associated with a higher risk of GDM among pregnant women in Michigan, relative to women who received intermediate care. Inadequate prenatal care may be more common among mothers with unhealthy dietary behaviors and other unhealthy lifestyle behaviors than among mothers with healthier lifestyle habits. Unhealthy dietary and lifestyle habits may also result in a greater likelihood of abnormal blood glucose tolerance during pregnancy. This theory is supported by 2 large, longitudinal studies of 10 million and 27 million US births and published in 2001 and 2012, respectively, which found a greater prevalence of inadequate prenatal care among women who were younger and less educated than their peers and among women who reported smoking during pregnancy compared with women who reported not smoking during pregnancy. 20,21 On the other hand, women who receive the highest level of prenatal care may do so because they have other complications related to their pregnancy, requiring more frequent visits to health care providers. 21 Furthermore, mothers with complicated pregnancies, involving conditions such as pregnancy-induced hypertension, are also known to be at increased risk for having a high BMI that is consistent with overweight or obesity and for developing GDM. 3
In Michigan, most state-funded maternal–child health programs have worked to reduce disparities based on race and socioeconomic status by focusing on reversing negative health outcomes, such as infant mortality, low birth weight, and premature births. 22 In addition, state natality data from 2012-2016 showed overall reductions in low birth weight and preterm births, which may be attributable, at least in part, to effective maternal–child health programming in the state. In this study, we focused on GDM as an alternative indicator of maternal–child health, because its incidence nationally has increased during the past several decades. Also, GDM has been linked to long-lasting negative health effects in mothers and their children. Yet the population at highest risk of GDM may not be reached by maternal–child health programming aimed primarily at reducing the number of low birth weight and premature births.
We demonstrated the use of a statewide geospatial analysis of GDM rates, an approach that may prove useful for public health program planners and policy makers who are working to address this condition. We identified areas with high rates of GDM in Michigan. By using the information gleaned from this analysis, public health workers in Michigan may be able to focus their efforts on certain locations to better understand the risks factors for GDM and the potential barriers to healthy GDM pregnancy outcomes in higher-risk areas. In addition, public health programmers in Michigan may be able to use the findings to target both the locations and content of interventions addressing GDM, thereby potentially improving the efficacy of and increasing the cost savings for these programs and services.
Three different methods of spatial analyses all found the highest rates of GDM in Kalamazoo County in the Southwest region, and these rates were 4 times the state average. Additional research should explore the reasons for the high risk of GDM, the maternal–child health programs being offered to mothers with GDM, and the morbidity associated with GDM in this region.
A strength of this study was the use of a complete sample of annual births from a single state. Previous investigations using birth records established a high level of agreement between birth records and other sources of perinatal information, such as the PRAMS questionnaire. 2 Another strength was that the risk analysis was performed by using GDM rates rather than just GDM density. By using GDM rates, which took into account various population densities in regions of the state, we were able to identify differences in rural and urban populations, and we were able to control for potential variations in the proportions of women of childbearing age in these regions. The main limitation of this study was that some of the birth records used were missing values for several variables, including maternal region of residence, and were not included. However, only about 3% of the records were affected; as such, the influence on our results was likely small. This difficulty in obtaining complete health data for secondary analyses has been noted previously. 23
Practice Applications
We demonstrated the use of a geospatial approach to the evaluation of pregnancy-associated disease risk, based on an analysis of available birth records for an entire state. By applying this approach to Michigan mothers diagnosed with GDM, we were able to identify hot spots of high GDM risk and regional differences in GDM risk. These findings could help determine where in the state to direct future research into protective factors for and potential barriers to healthy GDM-related pregnancy outcomes.
Our results might also help target future public health and maternal–child health interventions aimed at reducing morbidity related to GDM in Michigan. For example, the findings might be used to identify the best locations for future maternal–child health programming aimed at mothers at risk for GDM. This programming should include breastfeeding education, because breastfeeding is a potentially powerful protective factor that may counteract some of the risks associated with GDM-related births and may reduce lifetime health risks for affected mothers and their children. 24,25
We identified a single contiguous geographic area of high GDM risk in the Southwest region of Michigan. Future research in Michigan or other states might also incorporate latitude and longitude as variables, use a spatial logistic regression model, and map and standardize residuals (comparing observed vs predicted results). These approaches could help more accurately determine the areas of states with higher GDM rates, while also controlling for factors that may vary by region.
Footnotes
Acknowledgments
The authors acknowledge the Kalamazoo County Health and Community Services Department.
Declaration of Conflicting Interests
The authors declared no potential conflicts of interest with respect to the research, authorship, and/or publication of this article.
Funding
The authors received no financial support for the research, authorship, and/or publication of this article.