
Abstract
Objectives:
Early Preparation and Inspiration for Careers in the Biomedical Sciences (EPIC) is a university–high school partnership for increasing high school student interest and persistence in the biomedical sciences. EPIC includes a year-long, project-based learning intervention, the Think Like an Epidemiologist Challenge (Epi Challenge). We describe the main components of the Epi Challenge and report on short-term changes in scientific literacy and science-related motivations and beliefs.
Methods:
From June 2014 through June 2015, a randomized sample of students with above-median interest in science from 5 high schools in Pennsylvania completed baseline and midyear assessments of scientific self-efficacy, beliefs regarding acquisition of scientific knowledge (personal scientific epistemology), and personal interest in science using 5-point Likert-type scales (with higher scores indicating stronger or more sophisticated beliefs).
Results:
Of 984 students completing baseline assessments, 110 enrolled in the Epi Challenge, and 84 remained at midyear. At midyear, mean scores for scientific self-efficacy (change = 0.26, P < .001) and personal scientific epistemology (change = 0.19, P = .004) increased significantly, but personal interest in science (change = −0.17, P = .06) did not. Increases in personal scientific epistemology were greatest for African American (change = 0.47, P = .005), free/reduced-price lunch (change = 0.35, P = .001), underrepresented minorities in science (change = 0.27, P = .002), and female (change = 0.26, P = .01) students.
Conclusions:
Epi Challenge participation was associated with improvement in high school students’ scientific self-efficacy and sophistication of epistemologic beliefs. Long-term follow-up of this cohort may shed light on whether such changes will be sustained and shape college major and career decisions.
In 2015, the National Science Board noted concerns about the lack of racial/ethnic diversity in science, technology, engineering, and mathematics (STEM) education. 1 In 2016, students from underrepresented racial/ethnic minority groups, including African American, Hispanic, Native Hawaiian/other Pacific Islander, and American Indian/Alaska Native populations, constituted only 23% of first-time enrollees in US graduate programs. 2 Despite improvements since 1995 in proportions of people from racial/ethnic minority groups among STEM graduates, in 2014, people from underrepresented racial/ethnic minority groups earned just 20.3%, 14.5%, and 8.0% of science and engineering bachelor’s, master’s, and doctoral degrees, respectively. 3
The shortage of STEM graduates has roots in elementary and high school. 4 In 2016, only 20% of American College Testing–tested US high school students attained the benchmark or higher for STEM scores. Among the subset of students (48%) who indicated an overall interest in STEM subjects and careers, only 26% met the benchmark or higher, and percentages were considerably lower for those in underrepresented racial/ethnic minority groups. 4
Some experts have suggested that epidemiologic principles could be used in kindergarten through 12th-grade education to address the gaps in STEM education “by fostering opportunities for multidisciplinary learning around specific problems and by enabling students to grasp the relevance of real-world applications of mathematics and science.” 5 In 2013, our research team established Early Preparation and Inspiration for Careers in the Biomedical Sciences (EPIC), a National Institutes of Health–funded, university–high school partnership that uses epidemiologic principles in STEM education. EPIC combines a career interest assessment and counseling program with a year-long, project-based learning intervention starting the summer after ninth grade. As part of EPIC, we implemented an intervention called the Think Like an Epidemiologist Challenge (hereinafter, Epi Challenge) from June 2014 through June 2015. In this article, we describe the main components of the Epi Challenge and report on short-term changes in the scientific literacy and science-related motivations and beliefs of students who participated.
Methods
Members of our research team have been involved since 2000 in various efforts to provide epidemiology education in grades 6 through 12. These efforts have included participation in science competitions such as the Young Epidemiology Scholars 6 and New Jersey Science Olympiad, 7 development of epidemiology curricula for younger students, 8 –10 and preparing teachers to teach epidemiology. 11,12 From 2011 through 2014, we engaged regional school districts in Pennsylvania in 4 annual 1-day workshops, called Disease Scene Investigators, for high school teachers and students. The positive community experience with these workshops, combined with career assessment and counseling offered in Pennsylvania schools, 13 led to the opportunity to investigate the impact of an epidemiology intervention on decisions about STEM majors and careers.
In consultation with area school districts, we invited 5 high schools to partner in EPIC if they had participated in at least 3 of the 4 Disease Scene Investigator workshops, had available administrative support, and had sufficient diversity to ensure that at least 50% of participants in a stratified random sample of students would be classified as an underrepresented racial/ethnic minority group in science or as living in a low-income household (URM-S/LI).
We classified students as being URM-S/LI if they self-reported being (1) in an underrepresented minority in science (ie, Hispanic and all nonwhite/non-Asian racial/ethnic minority groups) or (2) a recipient of free or reduced-price lunch (hereinafter, free/reduced lunch), a surrogate for low income. We also classified students as URM-S/LI if they reported being in a racial/ethnic minority group and the low-income category. Students who did not qualify as URM-S/LI were designated as non–URM-S/LI. Coaches for EPIC in each school included at least 1 of its science educators and at least 1 student from a nearby university graduate program in public health or education. The research team held 40 hours of training for participating coaches.
Assessments of Scientific Literacy and Interest in Science
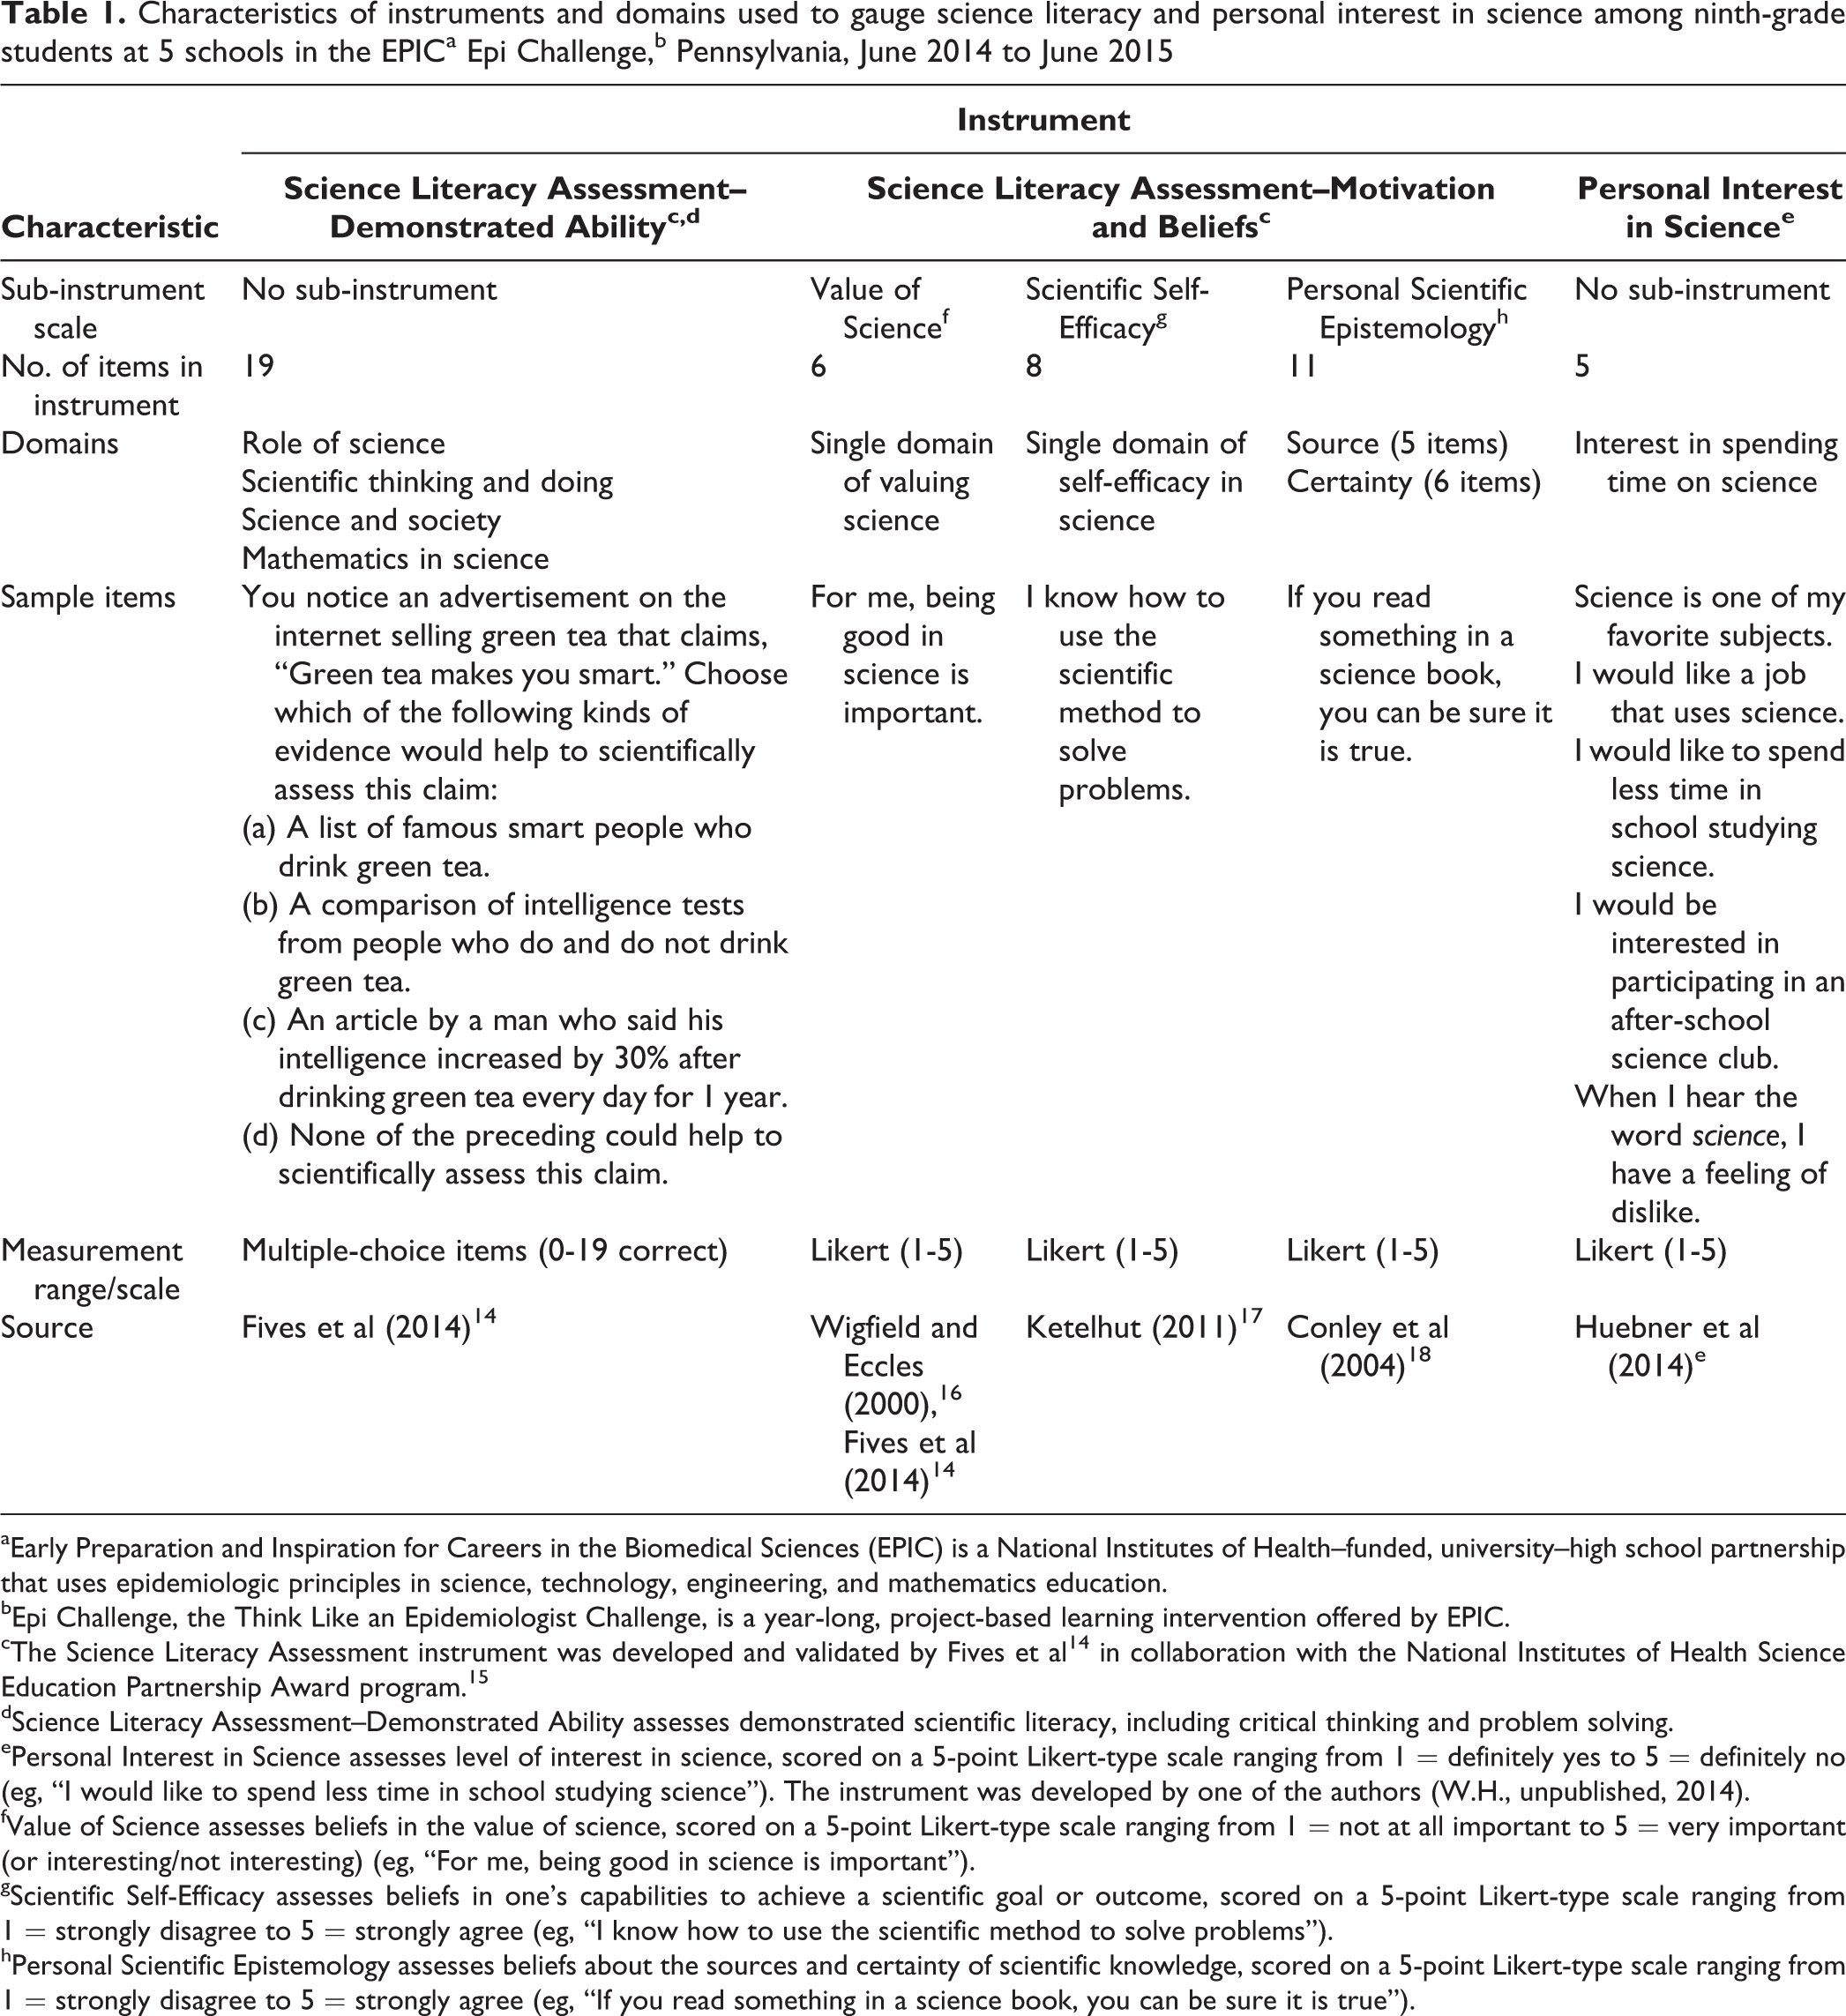
To assess EPIC students’ scientific literacy and their motivations and beliefs, we used the discipline-neutral Science Literacy Assessment (SLA) instrument, which was developed and validated by Fives et al 14 in collaboration with the National Institutes of Health–Science Education Partnership Award program. 15 The SLA has 2 parts: the SLA-Demonstrated Ability (SLA-D), which uses a 19-item multiple-choice instrument to assess demonstrated scientific literacy, including critical thinking and problem solving; and the SLA-Motivation and Beliefs (SLA-MB), which addresses motivations and beliefs with regard to science.
The SLA-MB is based on adaptations of 3 existing scaled measures (Table 1). The first measure is Value of Science, which is one’s beliefs in the value of science; it has 6 items (eg, “For me, being good in science is important”). The second measure is Scientific Self-Efficacy, which measures one’s beliefs in one’s capabilities to achieve a scientific goal or outcome; it has 8 items (eg, “I know how to use the scientific method to solve problems”). The third measure is Personal Scientific Epistemology, which is one’s beliefs about the sources and certainty of scientific knowledge; it has 11 items (eg, “If you read something in a science book, you can be sure it is true”). We scored questions for each measure on a 5-point Likert-type scale, whereby a higher score indicated stronger or more sophisticated beliefs in the value of science, in one’s capabilities to achieve a goal or outcome, and in the acquisition of knowledge, respectively, for the 3 scales. We developed a fifth instrument to measure Personal Interest in Science, which we scored on a 5-point Likert-type scale (where 1 = definitely yes and 5 = definitely no); this instrument consisted of 5 statements about interest in spending time working on science (eg, “I would like to spend less time in school studying science”).
Characteristics of instruments and domains used to gauge science literacy and personal interest in science among ninth-grade students at 5 schools in the EPICa Epi Challenge,b Pennsylvania, June 2014 to June 2015
aEarly Preparation and Inspiration for Careers in the Biomedical Sciences (EPIC) is a National Institutes of Health–funded, university–high school partnership that uses epidemiologic principles in science, technology, engineering, and mathematics education.
bEpi Challenge, the Think Like an Epidemiologist Challenge, is a year-long, project-based learning intervention offered by EPIC.
cThe Science Literacy Assessment instrument was developed and validated by Fives et al 14 in collaboration with the National Institutes of Health Science Education Partnership Award program. 15
dScience Literacy Assessment–Demonstrated Ability assesses demonstrated scientific literacy, including critical thinking and problem solving.
ePersonal Interest in Science assesses level of interest in science, scored on a 5-point Likert-type scale ranging from 1 = definitely yes to 5 = definitely no (eg, “I would like to spend less time in school studying science”). The instrument was developed by one of the authors (W.H., unpublished, 2014).
fValue of Science assesses beliefs in the value of science, scored on a 5-point Likert-type scale ranging from 1 = not at all important to 5 = very important (or interesting/not interesting) (eg, “For me, being good in science is important”).
gScientific Self-Efficacy assesses beliefs in one’s capabilities to achieve a scientific goal or outcome, scored on a 5-point Likert-type scale ranging from 1 = strongly disagree to 5 = strongly agree (eg, “I know how to use the scientific method to solve problems”).
hPersonal Scientific Epistemology assesses beliefs about the sources and certainty of scientific knowledge, scored on a 5-point Likert-type scale ranging from 1 = strongly disagree to 5 = strongly agree (eg, “If you read something in a science book, you can be sure it is true”).
Sampling and Randomization
Before the Epi Challenge was implemented at the 5 high schools, all ninth-grade students at the schools were offered an opportunity to respond to all 5 parts of the SLA and Personal Interest in Science instruments during the latter part of the school year. Using these baseline scores, we conducted a stepwise, stratified, random-sampling process to select potential participants in the Epi Challenge intervention. Students were initially placed into 1 of 4 groups in each school: URM-S/LI girl, URM-S/LI boy, non–URM-S/LI girl, and non–URM-S/LI boy. Then, to ensure a minimum baseline interest in science among Epi Challenge participants, we chose for randomization only those students in each of the 4 groups who were at the median or higher for the Personal Interest in Science instrument.
We assigned a random number to each student, listed the students in numerical order in each of the 4 groups, and then blindly selected every other student on each list in order and placed them into the Epi Challenge intervention group. To accommodate an expected 35% overall dropout rate and sustain a final sample size of 80 in the intervention, we aimed to fill 26 participant spots from each of the 5 schools (130 students in total), leaving approximately 800 or more students who had responded to the assessment instruments but were not included in the Epi Challenge intervention.
Epi Challenge participants had a year-long experience beginning in the summer after ninth grade and concluding in the summer after 10th grade (June 2014 through June 2015). To Epi Challenge participants only, we offered the chance to respond again to the assessment instruments in the middle of their sophomore year, creating midyear scores. Both Epi Challenge participants and nonparticipants responded again to all 5 instruments at the end of high school (in spring 2017) (results not reported).
Epi Challenge Framework and Components
We used the 8 practices in the National Research Council’s Framework for K-12 Science Education 19 to guide the Epi Challenge experience. As the Framework document states, “Students cannot comprehend scientific practices, nor fully appreciate the nature of scientific knowledge, without directly experiencing these practices themselves.” 19 We developed 5 major activity components of the Epi Challenge.
Intensive summer training
Rising 10th-grade students attended a 1-week, 40-hour summer program that included lectures, games, and hands-on and team-building activities. Lecture topics included current and emerging public health issues, principles of epidemiology, and roles of epidemiologist teams. We developed a website for students, teachers, and parents to access training materials and other related information during the school year. 20
Team participation
Educator coaches assigned students to teams of 3-5 members from the same school. Team members were instructed in basic elements of the National Institutes of Health code of conduct for collaborative research teams. 21 Coaches encouraged team members to identify leaders for each section of the research plan rather than appoint 1 overall delegator/leader.
Simulated research project
During the summer training and ensuing school year, we asked teams to make a list of health-related behaviors of interest and to develop a hypothesis about a health behavior and its association with an outcome of interest (eg, “Students who spend more time on social media are more likely to be sleep deprived compared with students who spend less time on social media”). After they developed a research proposal for a cross-sectional study that had to be approved by the school principal, teams proceeded with the ethical conduct, analysis, interpretation, and communication of their investigations. We set up the Epi Challenge to give students an authentic inquiry experience “in which the conclusion is not obvious, the issues are murky, and the situation is ambiguous in terms of what knowledge and skills are required.” 22
Project-based learning
We instructed Epi Challenge coaches in the principles of project-based learning, a teaching method in which students gain knowledge and skills by investigating and responding to a complex question or problem. We emphasized the importance of enhancing student interest and ownership without immediately supplying an answer or conveying the solution and by encouraging students to explore, think critically, and problem solve as a team. 23
Interactions with stakeholders
Student teams presented their research proposals to other students and local and regional public health professionals at a midyear research symposium. At year’s end, students practiced presenting their investigations in oral and poster sessions at a 2-day summer session followed by a final symposium event that involved parents and guardians, school administrators, experts in the biomedical sciences, and public health practitioners.
Statistical Methods
To assess reliability of our scaled measures, we calculated standardized and deleted variables analysis Cronbach’s alpha coefficients for the 3 SLA-MB and Personal Interest in Science scores, to determine if multiple items about a particular measure (eg, Value of Science) were closely related as a group. We also assessed correlations among all 5 instrument scores, calculating Spearman (nonparametric) correlation coefficients (r) and P values, because the scores were not normally distributed. We considered P < .05 to be significant.
We assessed differences in the baseline distributions of Epi Challenge participants and nonparticipants and of those who remained in and those who dropped out of the Epi Challenge, stratified by their school, sex, race/ethnicity, Hispanic origin, free/reduced lunch, and URM-S/LI status using the Pearson χ2 test. When cell populations were ≤5 students, we used the Fisher exact test to assess these differences.
For the SLA-D instrument, we classified missing answers as incorrect and then recorded the total correct answers (of a possible 19) for each student. For the 4 instruments that used 5-point Likert-type scales (3 SLA-MB scales and Personal Interest in Science), we required that at least 80% of questions be answered to include a student’s score in the baseline mean scores for Epi Challenge participants and nonparticipants and for analysis of the other demographic subgroups. To prevent overrepresentation of information from entries that were less than 100% complete, we then weighted the mean scores for these groups and subgroups according to the total number of questions that were answered in each instrument. We also revised the scoring of some scales so that the highest ranking (ie, 5 on a 1-5 scale) always reflected the most positive outcome.
For the Personal Interest in Science instrument, because a score of 3 on the 5-point Likert-type scale reflected uncertainty about this measure, we used baseline and midyear scores to measure the increase in certainty that occurred during the project, which we called PSIcertain. We defined PSIcertain as the absolute value of moving from uncertainty toward either higher interest (eg, a score of 4 or 5) or lower interest (eg, a score of 1 or 2) in science.
We assessed differences in the baseline mean SLA-D, SLA-MB, and Personal Interest in Science scores (and differences in these scores by demographic characteristics) between Epi Challenge participants and nonparticipants, and between those who remained in and those who dropped out of the Epi Challenge, using the nonparametric Wilcoxon rank-sum test. Then, for Epi Challenge participants, we determined pairwise differences among the baseline to midyear changes in Scientific Self-Efficacy, Personal Scientific Epistemology, and Personal Interest in Science mean scores, using the Wilcoxon signed rank test. Also, we conducted a sensitivity analysis of pairwise differences to determine the possible changes in change values if Epi Challenge participants who dropped out had stayed in the study but reported no changes from their baseline scores. We conducted all 2-sided statistical tests using SAS version 9.4. 24
Results
A total of 984 of 1303 ninth-grade students in the 5 schools completed the baseline assessment; 497 of 621 (80.0%) girls and 487 of 682 (71.4%) boys responded. Of 207 students invited to join the Epi Challenge, which required year-long participation including 2 summer sessions, 110 (53.1%) accepted and enrolled in the Epi Challenge (range at the 5 schools: 33.3%-84.0%). By midyear, 84 of 110 (76.4%) students were still in the program (range at the 5 schools: 25.5% to 96.2%). Of the 26 students who dropped out, 7 moved or started online school, 2 lost interest, and 17 did not indicate a reason for dropping out.
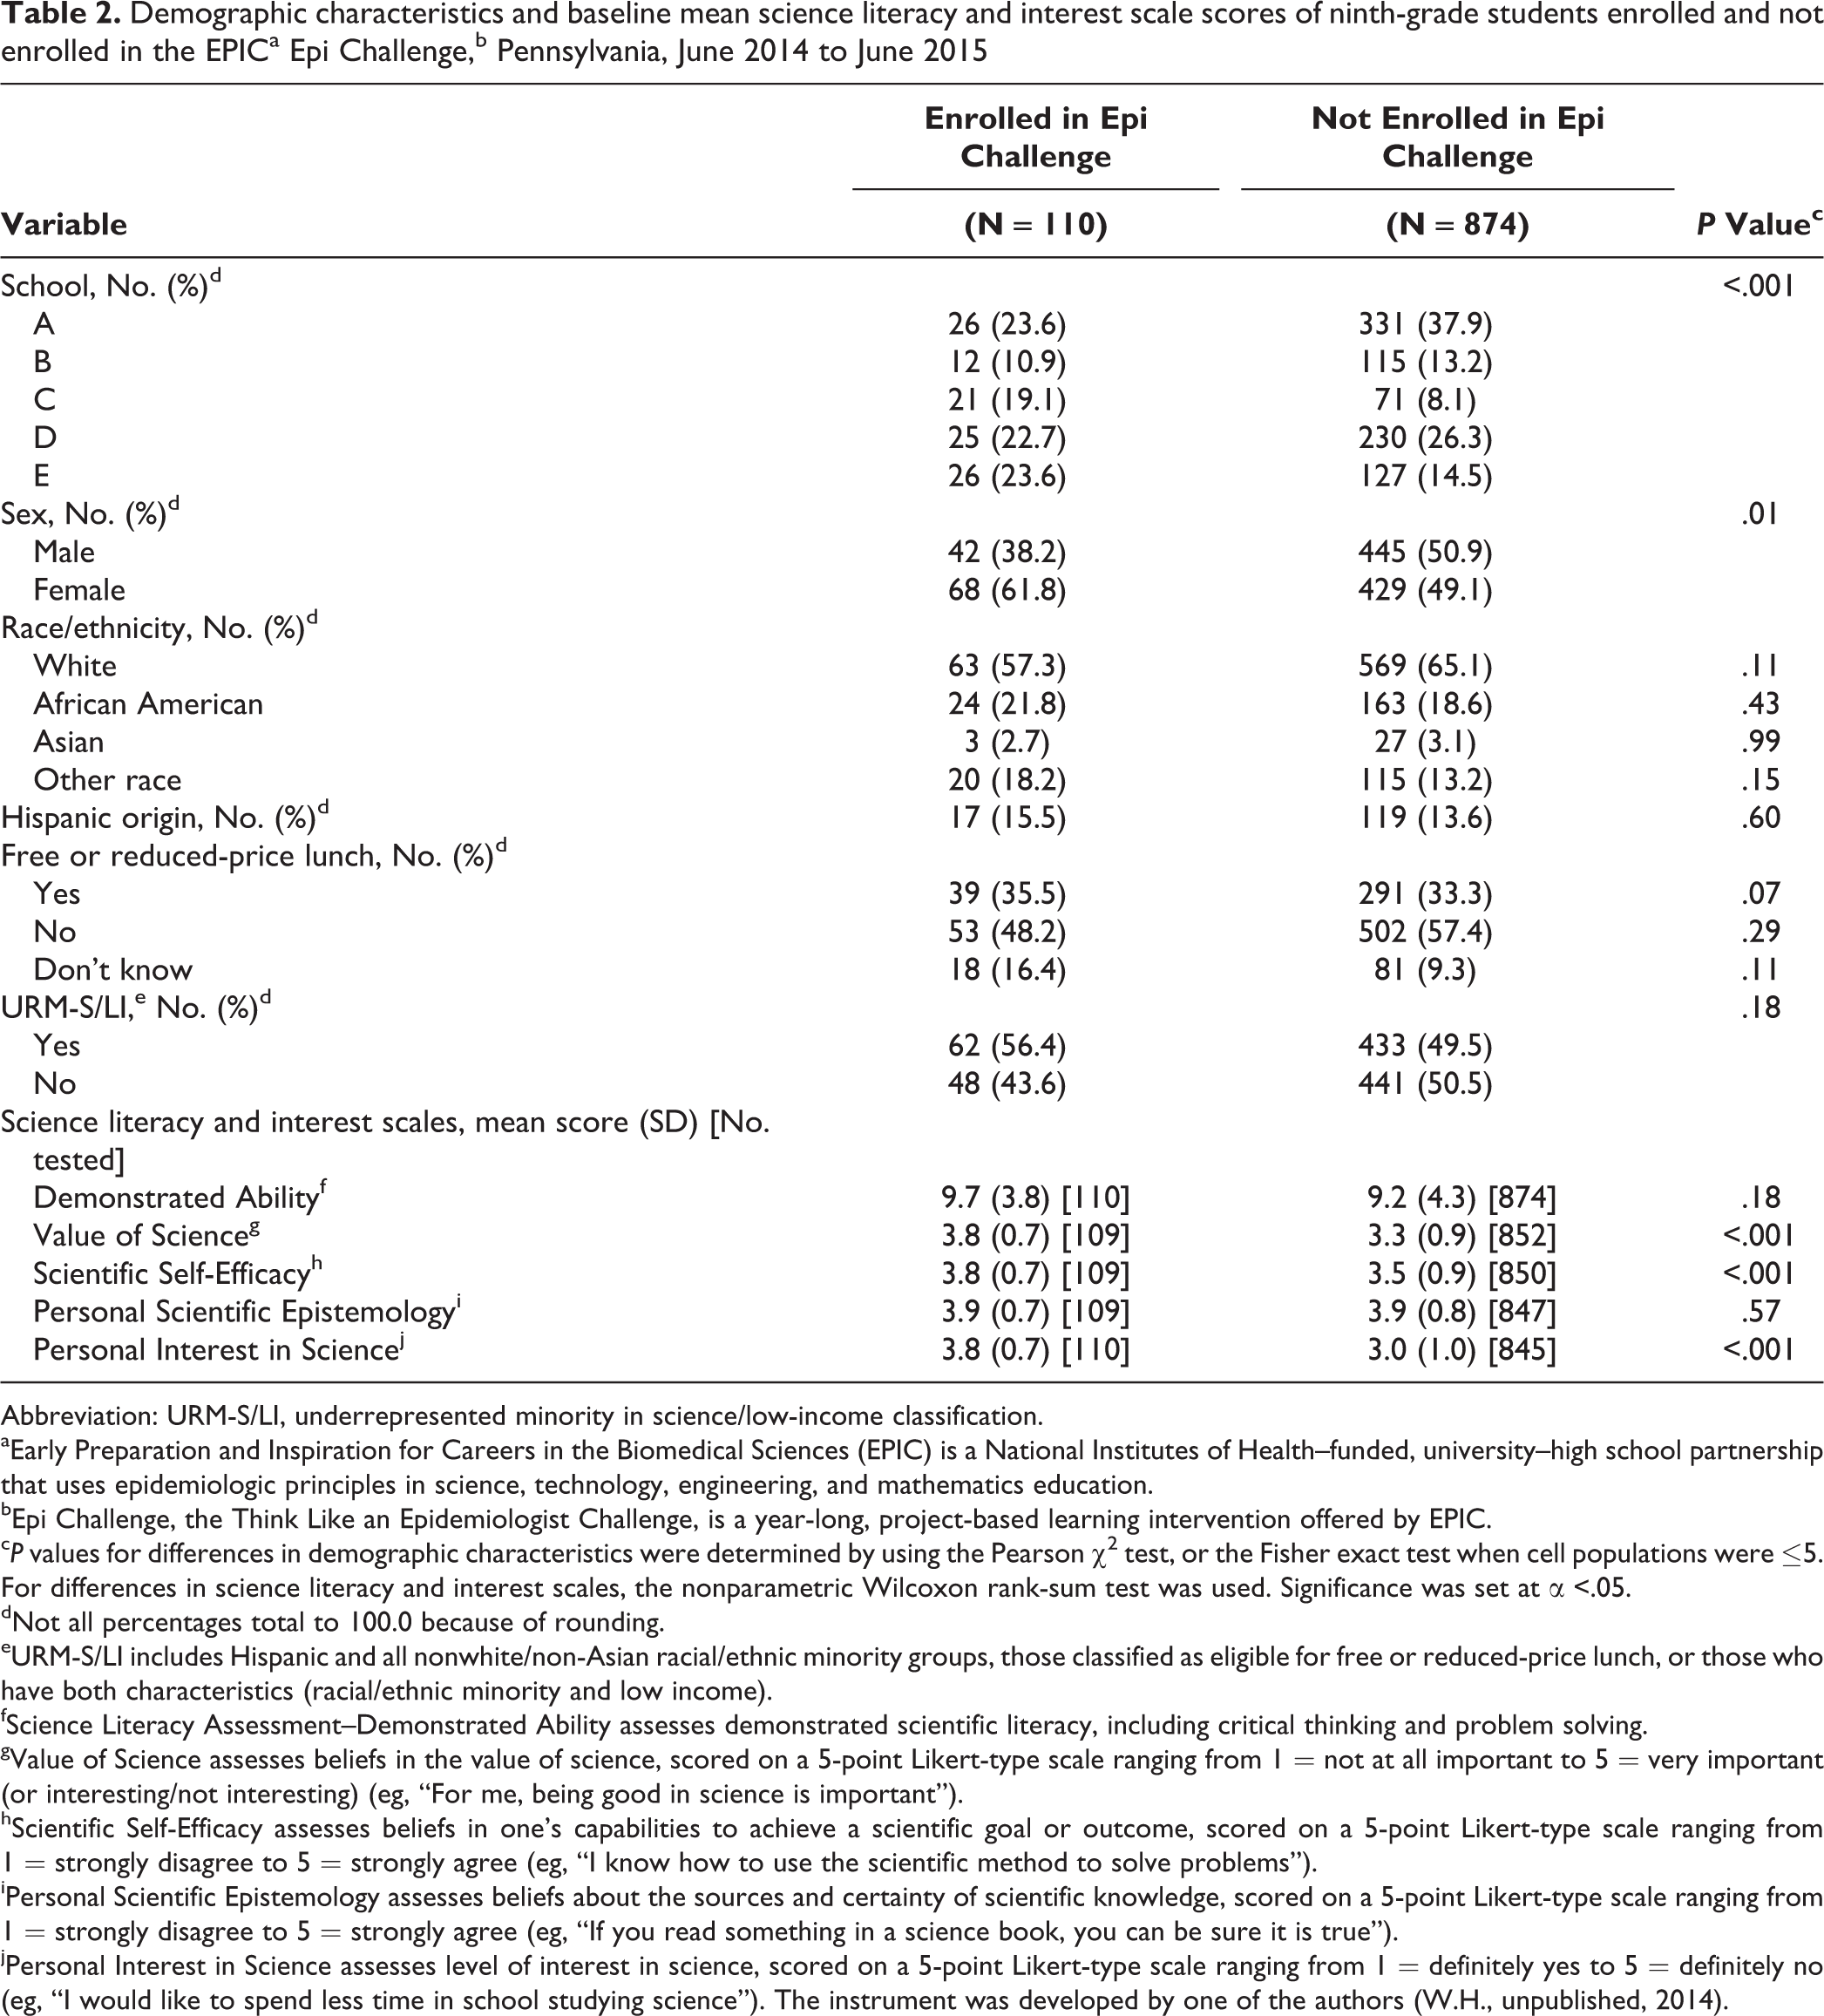
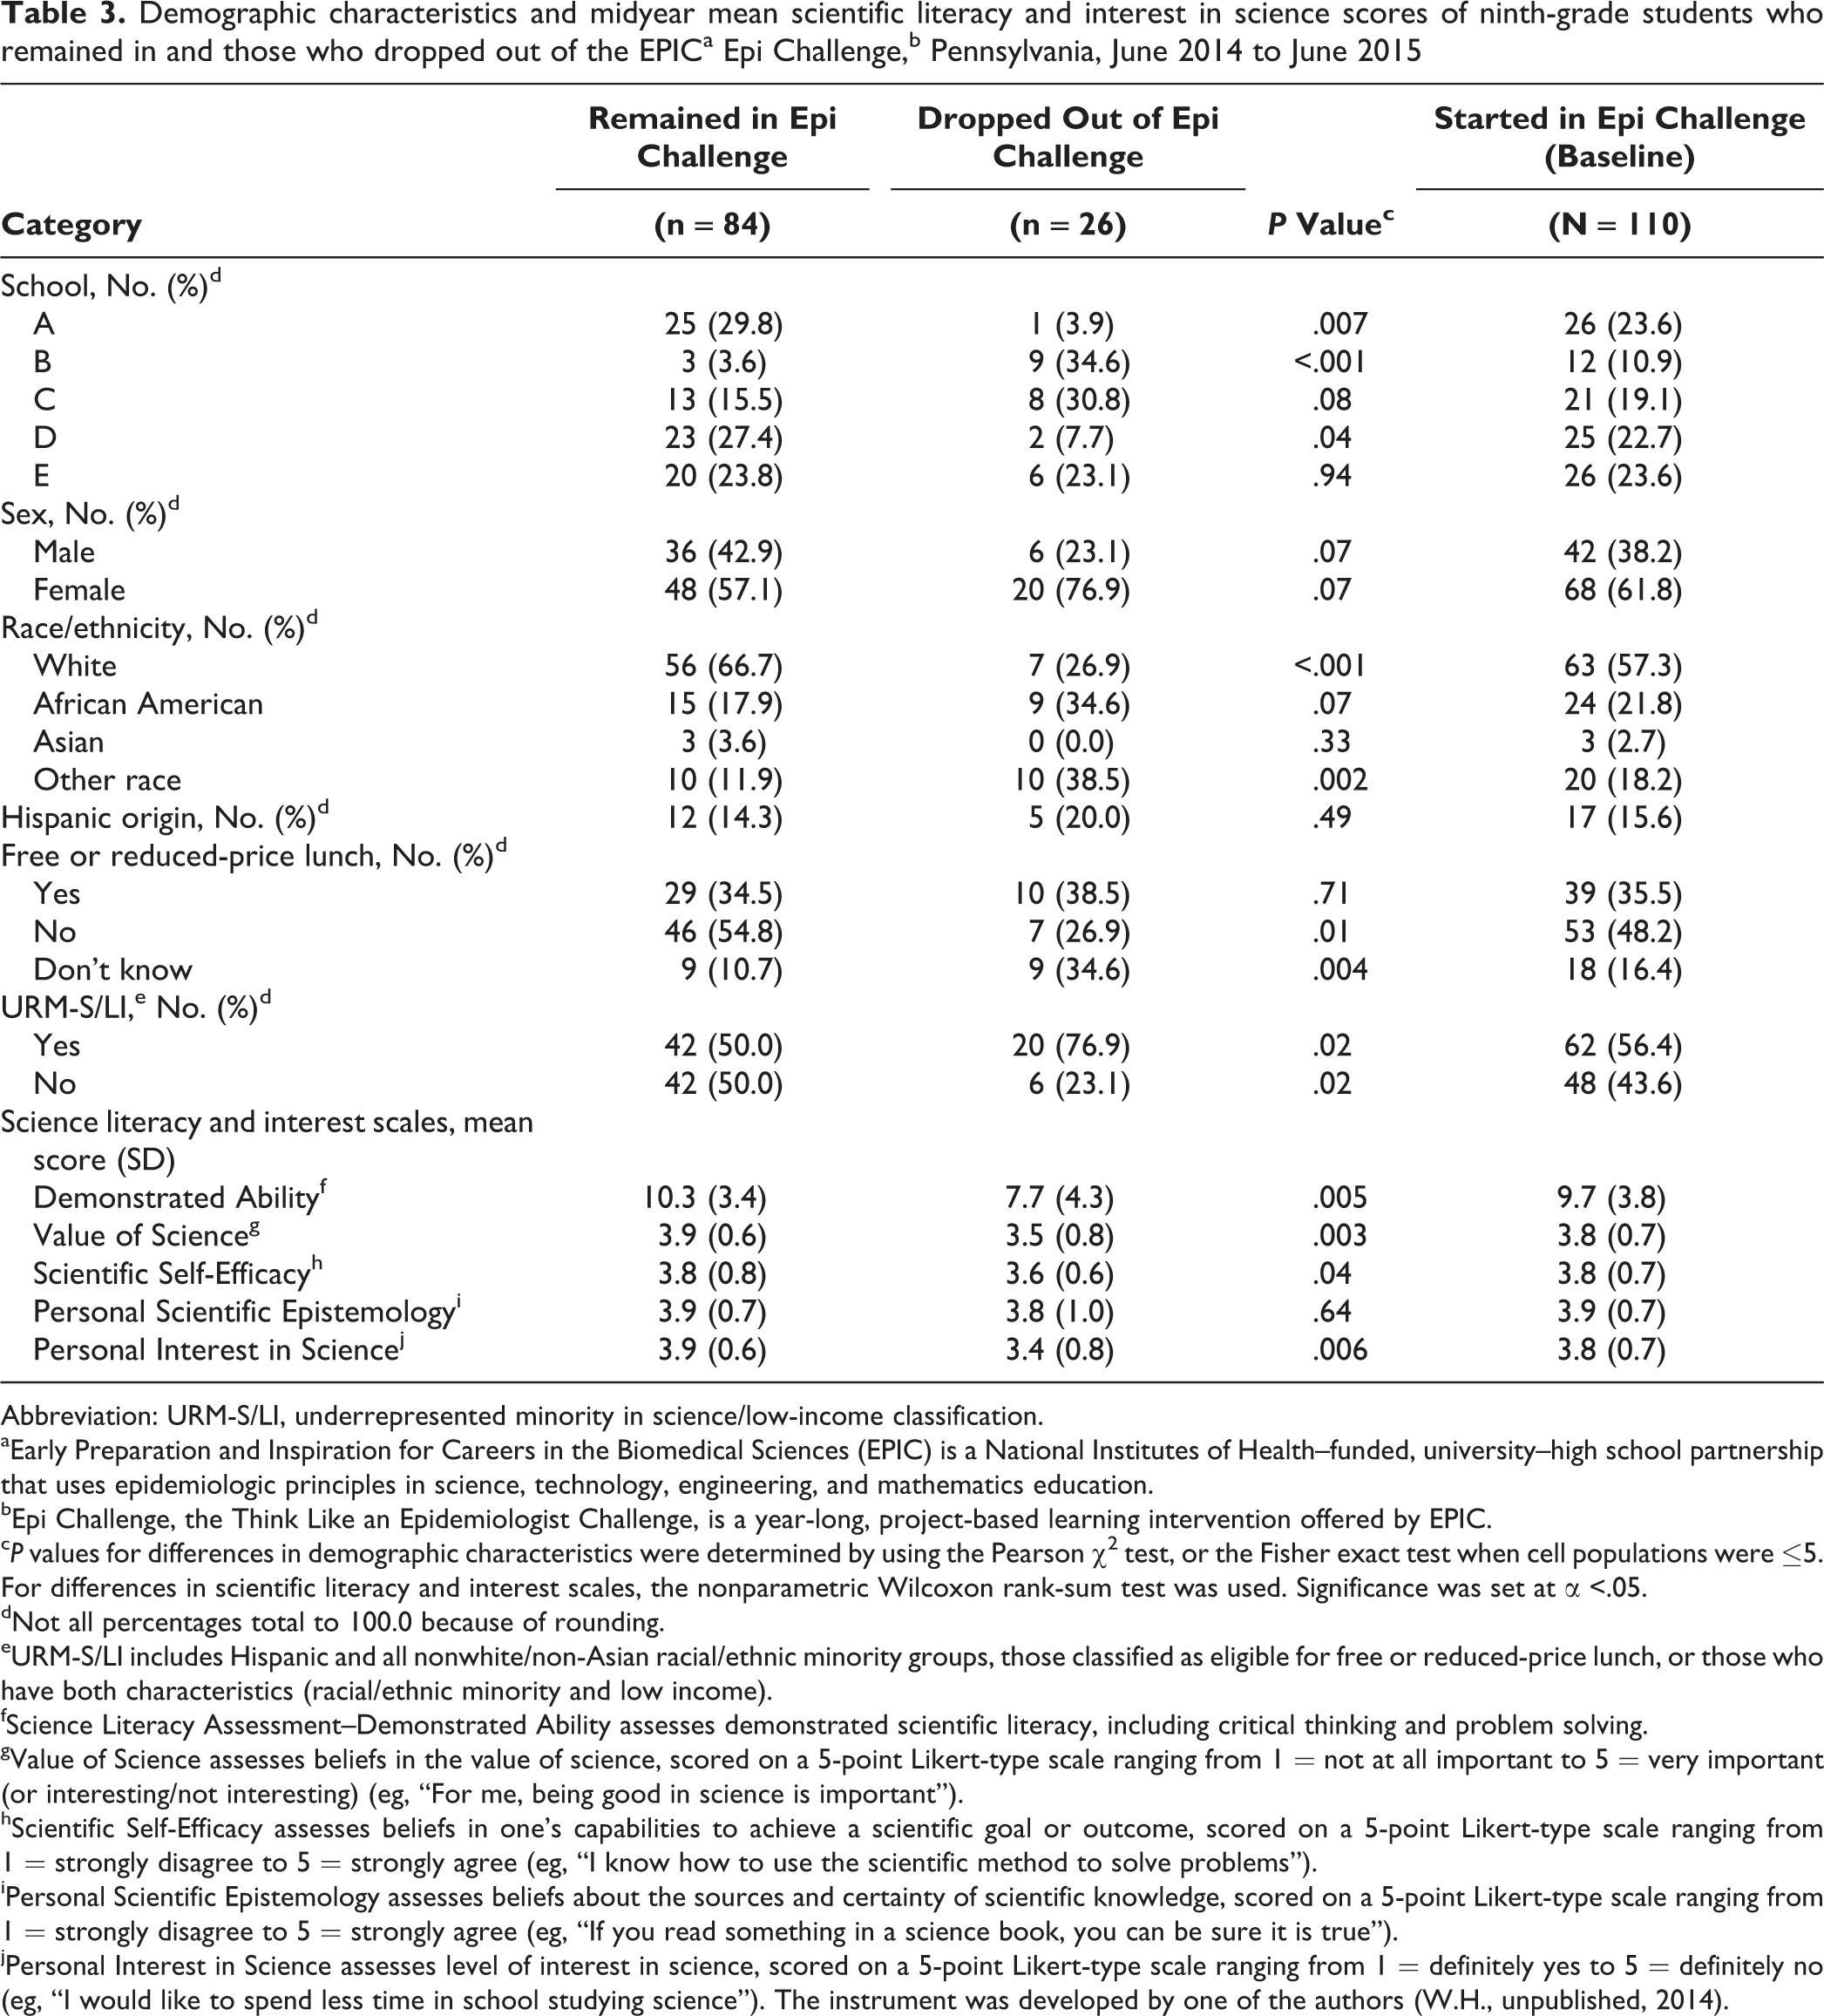
We found no significant differences at baseline between Epi Challenge participants and nonparticipants for race/ethnicity, Hispanic origin, free/reduced lunch, URM-S/LI status, SLA-D, and Personal Scientific Epistemology (Table 2). Epi Challenge participants were significantly more likely than nonparticipants to be girls (P = .01) and to score higher on Value of Science, Scientific Self-Efficacy, and Personal Interest in Science (all Ps < .001). Compared with the 84 students who remained enrolled in the Epi Challenge at midyear, the 26 students who dropped out of the Epi Challenge were significantly more likely to be in the URM-S/LI group (P = .02) and to have lower scores for SLA-D (P = .005), Value of Science (P = .003), Scientific Self-Efficacy (P = .04), and Personal Interest in Science (P = .006) (Table 3).
Demographic characteristics and baseline mean science literacy and interest scale scores of ninth-grade students enrolled and not enrolled in the EPICa Epi Challenge,b Pennsylvania, June 2014 to June 2015
Abbreviation: URM-S/LI, underrepresented minority in science/low-income classification.
aEarly Preparation and Inspiration for Careers in the Biomedical Sciences (EPIC) is a National Institutes of Health–funded, university–high school partnership that uses epidemiologic principles in science, technology, engineering, and mathematics education.
bEpi Challenge, the Think Like an Epidemiologist Challenge, is a year-long, project-based learning intervention offered by EPIC.
c P values for differences in demographic characteristics were determined by using the Pearson χ2 test, or the Fisher exact test when cell populations were ≤5. For differences in science literacy and interest scales, the nonparametric Wilcoxon rank-sum test was used. Significance was set at α <.05.
dNot all percentages total to 100.0 because of rounding.
eURM-S/LI includes Hispanic and all nonwhite/non-Asian racial/ethnic minority groups, those classified as eligible for free or reduced-price lunch, or those who have both characteristics (racial/ethnic minority and low income).
fScience Literacy Assessment–Demonstrated Ability assesses demonstrated scientific literacy, including critical thinking and problem solving.
gValue of Science assesses beliefs in the value of science, scored on a 5-point Likert-type scale ranging from 1 = not at all important to 5 = very important (or interesting/not interesting) (eg, “For me, being good in science is important”).
hScientific Self-Efficacy assesses beliefs in one’s capabilities to achieve a scientific goal or outcome, scored on a 5-point Likert-type scale ranging from 1 = strongly disagree to 5 = strongly agree (eg, “I know how to use the scientific method to solve problems”).
iPersonal Scientific Epistemology assesses beliefs about the sources and certainty of scientific knowledge, scored on a 5-point Likert-type scale ranging from 1 = strongly disagree to 5 = strongly agree (eg, “If you read something in a science book, you can be sure it is true”).
jPersonal Interest in Science assesses level of interest in science, scored on a 5-point Likert-type scale ranging from 1 = definitely yes to 5 = definitely no (eg, “I would like to spend less time in school studying science”). The instrument was developed by one of the authors (W.H., unpublished, 2014).
Demographic characteristics and midyear mean scientific literacy and interest in science scores of ninth-grade students who remained in and those who dropped out of the EPICa Epi Challenge,b Pennsylvania, June 2014 to June 2015
Abbreviation: URM-S/LI, underrepresented minority in science/low-income classification.
aEarly Preparation and Inspiration for Careers in the Biomedical Sciences (EPIC) is a National Institutes of Health–funded, university–high school partnership that uses epidemiologic principles in science, technology, engineering, and mathematics education.
bEpi Challenge, the Think Like an Epidemiologist Challenge, is a year-long, project-based learning intervention offered by EPIC.
c P values for differences in demographic characteristics were determined by using the Pearson χ2 test, or the Fisher exact test when cell populations were ≤5. For differences in scientific literacy and interest scales, the nonparametric Wilcoxon rank-sum test was used. Significance was set at α <.05.
dNot all percentages total to 100.0 because of rounding.
eURM-S/LI includes Hispanic and all nonwhite/non-Asian racial/ethnic minority groups, those classified as eligible for free or reduced-price lunch, or those who have both characteristics (racial/ethnic minority and low income).
fScience Literacy Assessment–Demonstrated Ability assesses demonstrated scientific literacy, including critical thinking and problem solving.
gValue of Science assesses beliefs in the value of science, scored on a 5-point Likert-type scale ranging from 1 = not at all important to 5 = very important (or interesting/not interesting) (eg, “For me, being good in science is important”).
hScientific Self-Efficacy assesses beliefs in one’s capabilities to achieve a scientific goal or outcome, scored on a 5-point Likert-type scale ranging from 1 = strongly disagree to 5 = strongly agree (eg, “I know how to use the scientific method to solve problems”).
iPersonal Scientific Epistemology assesses beliefs about the sources and certainty of scientific knowledge, scored on a 5-point Likert-type scale ranging from 1 = strongly disagree to 5 = strongly agree (eg, “If you read something in a science book, you can be sure it is true”).
jPersonal Interest in Science assesses level of interest in science, scored on a 5-point Likert-type scale ranging from 1 = definitely yes to 5 = definitely no (eg, “I would like to spend less time in school studying science”). The instrument was developed by one of the authors (W.H., unpublished, 2014).
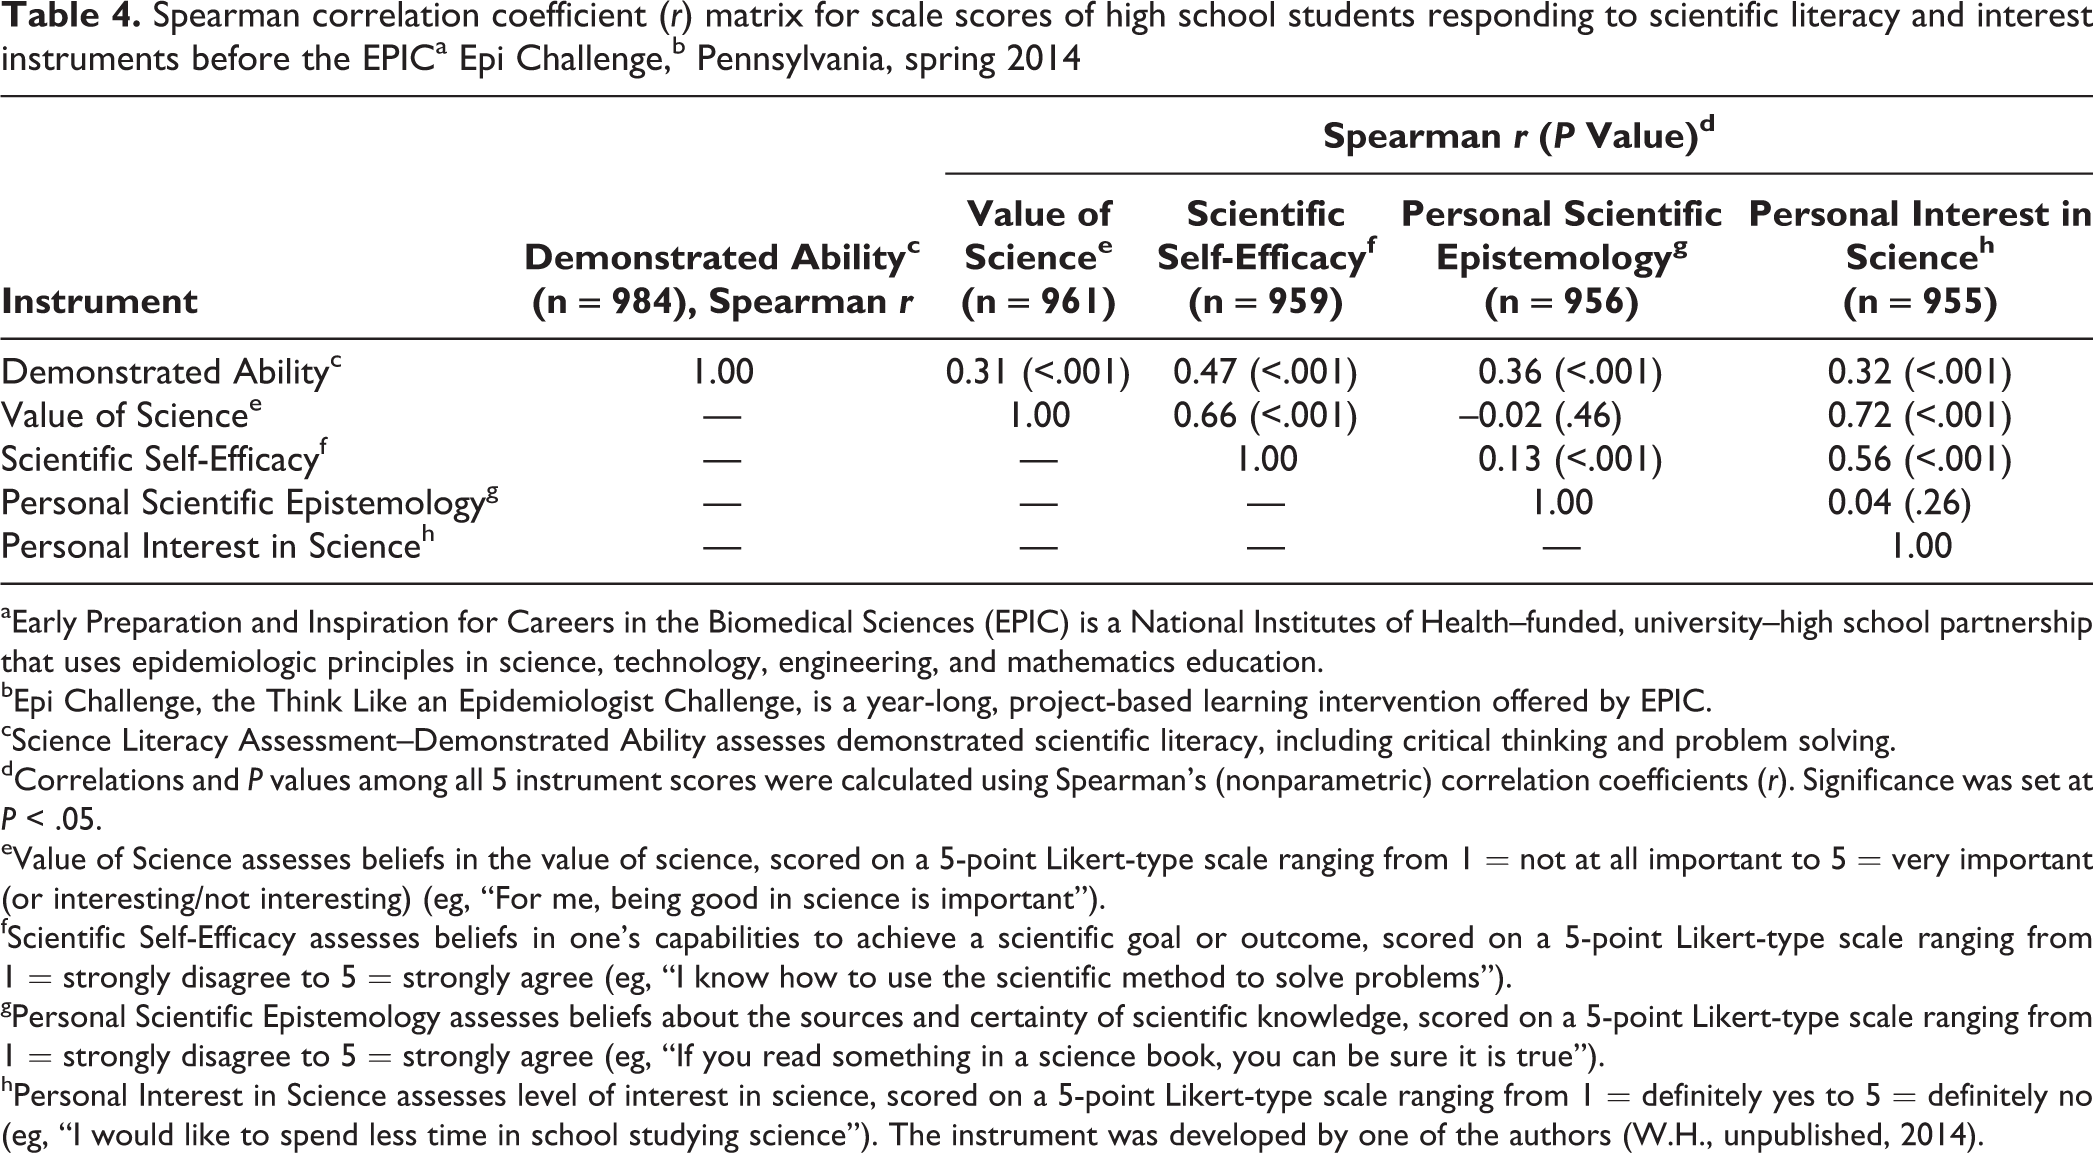
SLA-D scores were significantly correlated with baseline scores for all 4 scaled measures (r range: 0.31-0.47; all Ps < .001) (Table 4). We observed the strongest correlations between Value of Science and Scientific Self-Efficacy (r = 0.66; P < .001) and between Value of Science and Personal Interest in Science (r = 0.72, P <.001). Personal Scientific Epistemology was not strongly correlated with the other 3 scaled measures (r ≤ 0.13). Cronbach’s alpha for each of the 4 scaled measures was >.80 for all groups investigated by sex, race/ethnicity (African American and Hispanic), URM-S/LI, and free/reduced lunch.
Spearman correlation coefficient (r) matrix for scale scores of high school students responding to scientific literacy and interest instruments before the EPICa Epi Challenge,b Pennsylvania, spring 2014
aEarly Preparation and Inspiration for Careers in the Biomedical Sciences (EPIC) is a National Institutes of Health–funded, university–high school partnership that uses epidemiologic principles in science, technology, engineering, and mathematics education.
bEpi Challenge, the Think Like an Epidemiologist Challenge, is a year-long, project-based learning intervention offered by EPIC.
cScience Literacy Assessment–Demonstrated Ability assesses demonstrated scientific literacy, including critical thinking and problem solving.
dCorrelations and P values among all 5 instrument scores were calculated using Spearman’s (nonparametric) correlation coefficients (r). Significance was set at P < .05.
eValue of Science assesses beliefs in the value of science, scored on a 5-point Likert-type scale ranging from 1 = not at all important to 5 = very important (or interesting/not interesting) (eg, “For me, being good in science is important”).
fScientific Self-Efficacy assesses beliefs in one’s capabilities to achieve a scientific goal or outcome, scored on a 5-point Likert-type scale ranging from 1 = strongly disagree to 5 = strongly agree (eg, “I know how to use the scientific method to solve problems”).
gPersonal Scientific Epistemology assesses beliefs about the sources and certainty of scientific knowledge, scored on a 5-point Likert-type scale ranging from 1 = strongly disagree to 5 = strongly agree (eg, “If you read something in a science book, you can be sure it is true”).
hPersonal Interest in Science assesses level of interest in science, scored on a 5-point Likert-type scale ranging from 1 = definitely yes to 5 = definitely no (eg, “I would like to spend less time in school studying science”). The instrument was developed by one of the authors (W.H., unpublished, 2014).
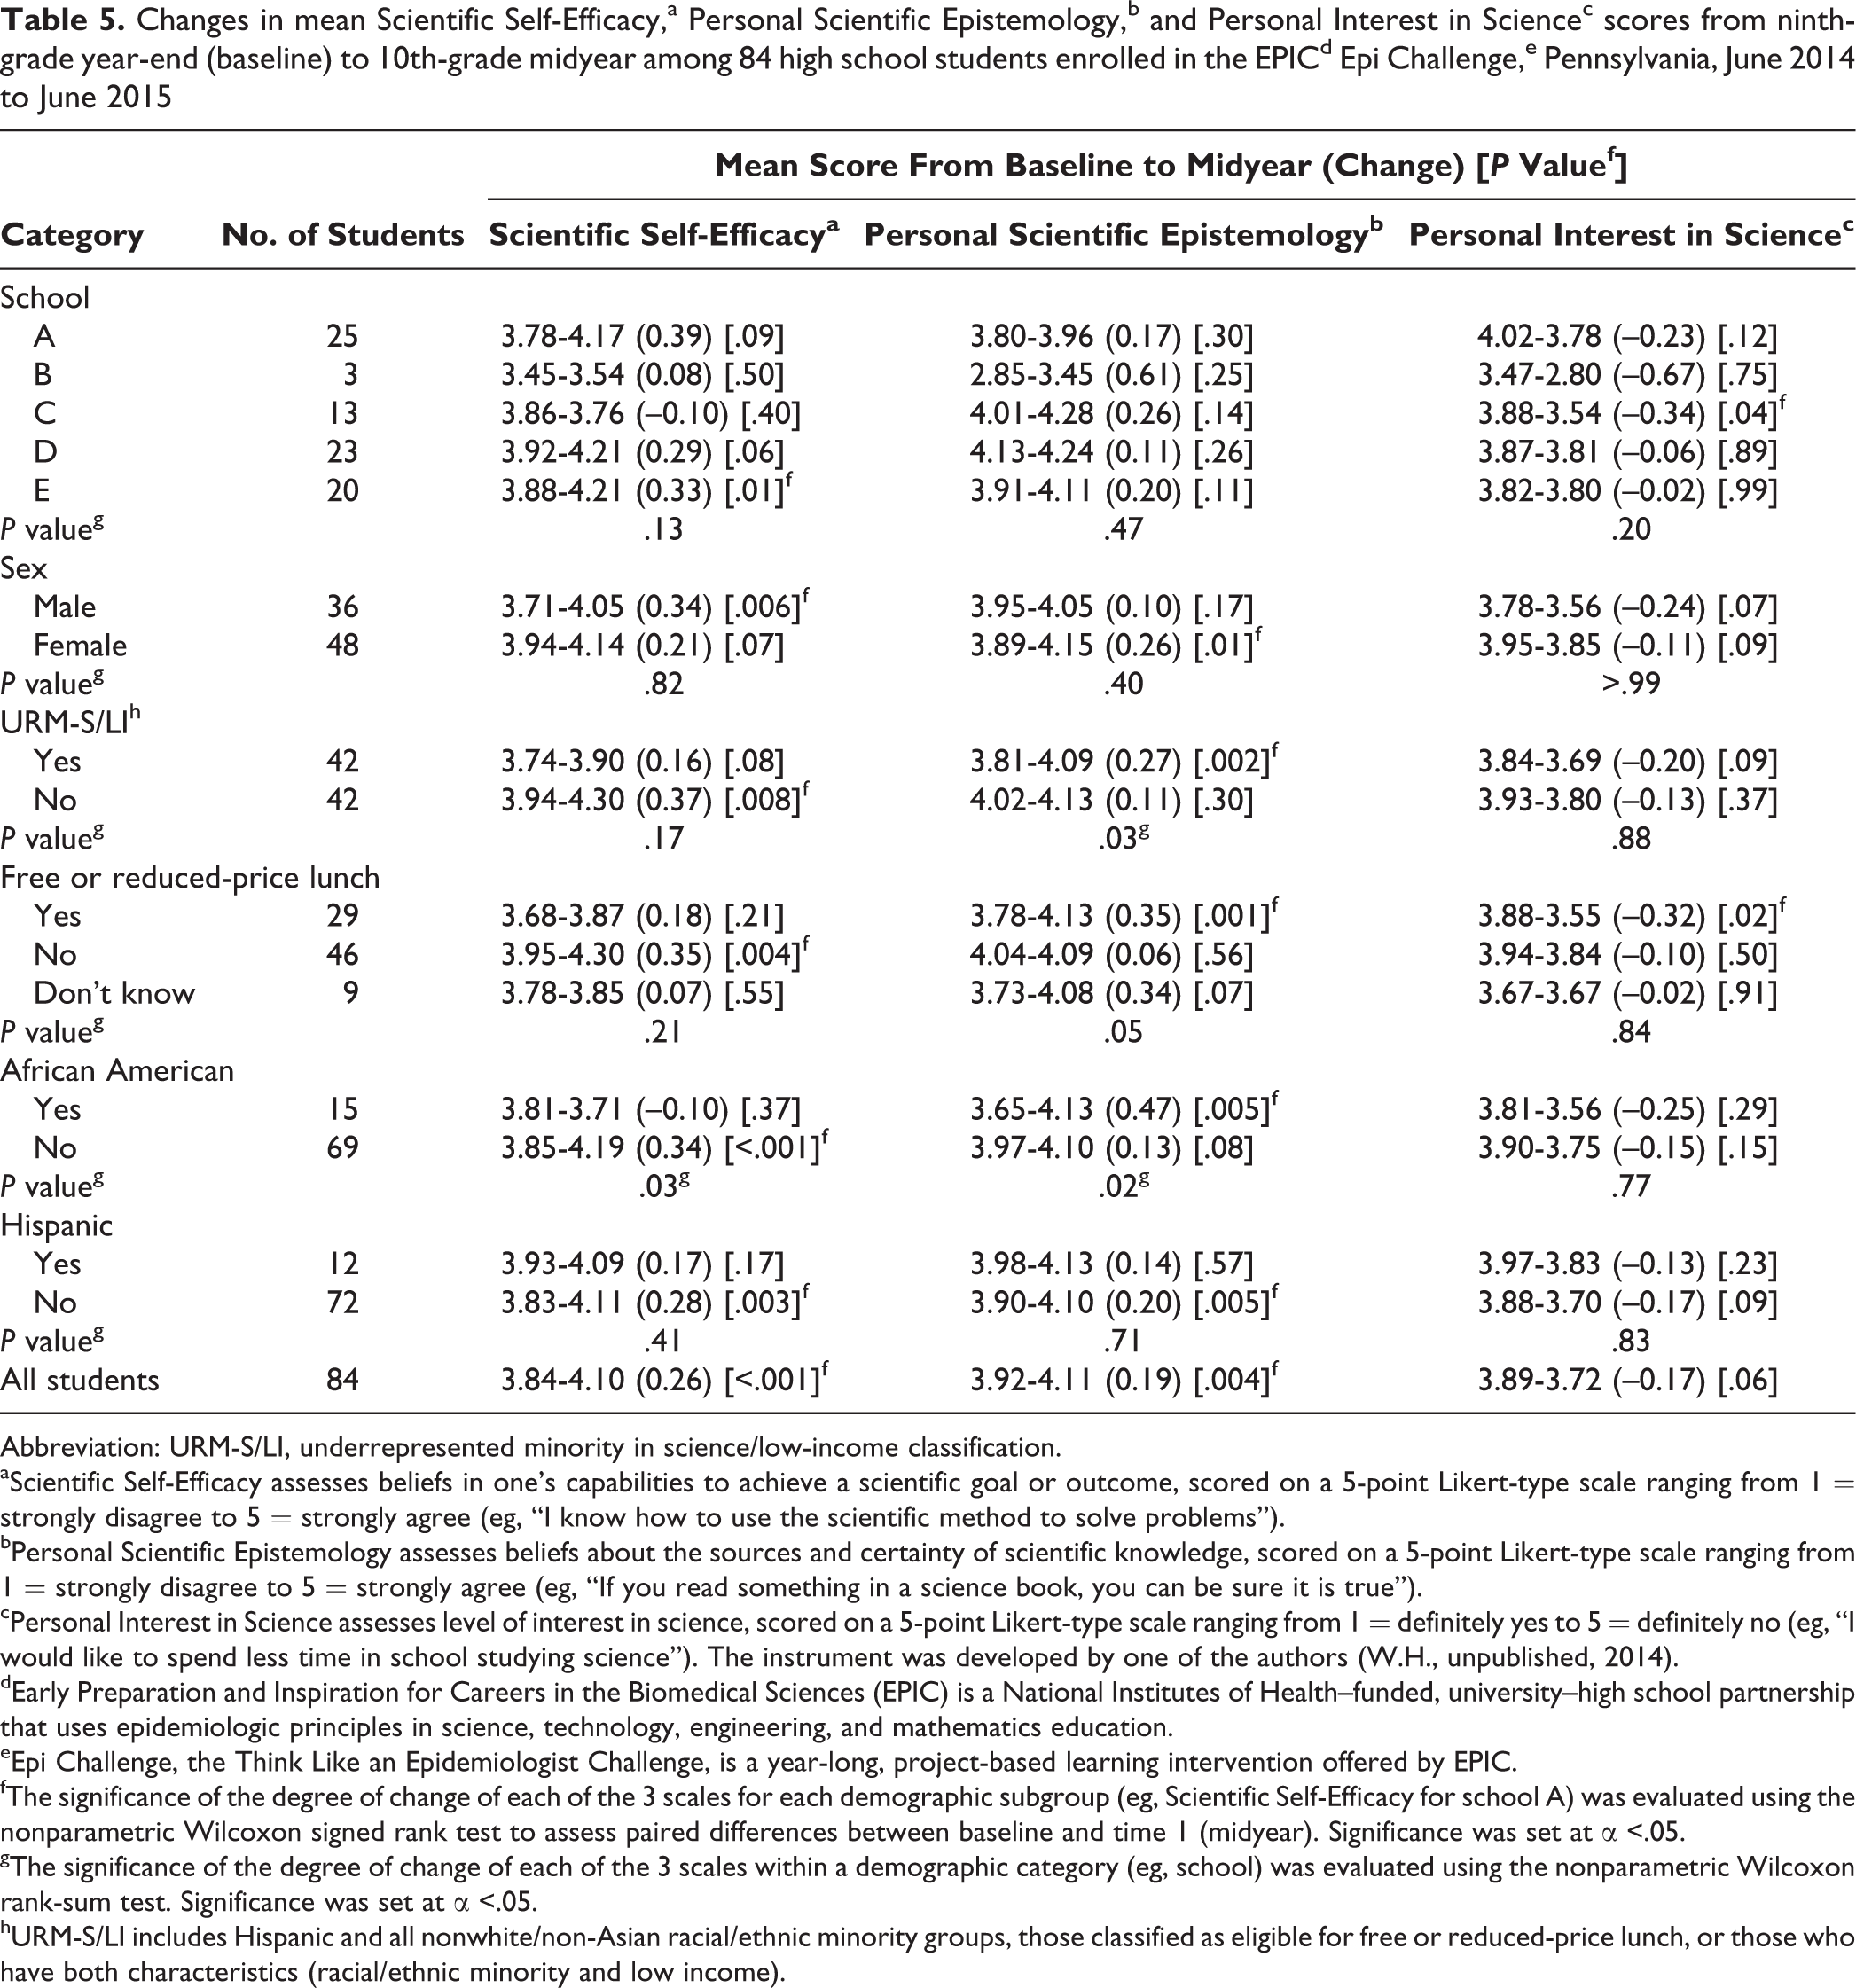
Of the 84 students who remained in the Epi Challenge at midyear, we found a significant increase from baseline to midyear in the mean Scientific Self-Efficacy score for all students (change = 0.26, P < .001), and this increase was largest for non-African American students (change = 0.34, P = .03), students not receiving free/reduced lunch (change = 0.35, P = .004), non–URM-S/LI students (change = 0.37, P = .008), and boys (change = 0.34, P = .006) (Table 5). The mean Personal Scientific Epistemology score for all Epi Challenge students also increased (change = 0.19, P = .004); however, increases in these scores were highest for African American students (change = 0.47, P = .005), students receiving free/reduced lunch (change = 0.35, P = .001), URM-S/LI students (change = 0.27, P = .002), and girls (change = 0.26, P = .01). In contrast with Scientific Self-Efficacy and Personal Scientific Epistemology, the mean Personal Interest in Science score for all Epi Challenge students decreased, but not significantly (change = –0.17, P = .06), although the decrease in mean score (change = –0.32, P = .02) for students receiving free/reduced lunch was significant. For students with a Personal Interest in Science score of 3 at baseline, mean PSIcertain results at midyear suggested a nonsignificant trend toward certainty (change = 0.08, P = .14).
Changes in mean Scientific Self-Efficacy,a Personal Scientific Epistemology,b and Personal Interest in Sciencec scores from ninth-grade year-end (baseline) to 10th-grade midyear among 84 high school students enrolled in the EPICd Epi Challenge,e Pennsylvania, June 2014 to June 2015
Abbreviation: URM-S/LI, underrepresented minority in science/low-income classification.
aScientific Self-Efficacy assesses beliefs in one’s capabilities to achieve a scientific goal or outcome, scored on a 5-point Likert-type scale ranging from 1 = strongly disagree to 5 = strongly agree (eg, “I know how to use the scientific method to solve problems”).
bPersonal Scientific Epistemology assesses beliefs about the sources and certainty of scientific knowledge, scored on a 5-point Likert-type scale ranging from 1 = strongly disagree to 5 = strongly agree (eg, “If you read something in a science book, you can be sure it is true”).
cPersonal Interest in Science assesses level of interest in science, scored on a 5-point Likert-type scale ranging from 1 = definitely yes to 5 = definitely no (eg, “I would like to spend less time in school studying science”). The instrument was developed by one of the authors (W.H., unpublished, 2014).
dEarly Preparation and Inspiration for Careers in the Biomedical Sciences (EPIC) is a National Institutes of Health–funded, university–high school partnership that uses epidemiologic principles in science, technology, engineering, and mathematics education.
eEpi Challenge, the Think Like an Epidemiologist Challenge, is a year-long, project-based learning intervention offered by EPIC.
fThe significance of the degree of change of each of the 3 scales for each demographic subgroup (eg, Scientific Self-Efficacy for school A) was evaluated using the nonparametric Wilcoxon signed rank test to assess paired differences between baseline and time 1 (midyear). Significance was set at α <.05.
gThe significance of the degree of change of each of the 3 scales within a demographic category (eg, school) was evaluated using the nonparametric Wilcoxon rank-sum test. Significance was set at α <.05.
hURM-S/LI includes Hispanic and all nonwhite/non-Asian racial/ethnic minority groups, those classified as eligible for free or reduced-price lunch, or those who have both characteristics (racial/ethnic minority and low income).
At midyear, mean Scientific Self-Efficacy scores were significantly lower for URM-S/LI students (3.90 vs 4.30, P < .001) and for African American students (3.71 vs 4.19, P = .004) than for non–URM-S/LI and non-African American students, respectively (midyear P values not shown). In contrast, mean Personal Scientific Epistemology and Personal Interest in Science scores did not differ significantly in any of the demographic categories at midyear.
In the sensitivity analysis, which assumed that students who dropped out of the Epi Challenge had stayed in the study and had no change from their baseline scores, increases in mean Scientific Self-Efficacy (change = 0.20, P = .001) and Personal Scientific Epistemology (change = 0.14, P = .004) scores remained significant, and changes in the mean Personal Interest in Science score (change = –0.13, P = .06) remained nonsignificant.
Discussion
We conducted a midyear analysis to assess early impacts of the Epi Challenge program while students were in the midst of their project work. We found significant increases in scores for Scientific Self-Efficacy and Personal Scientific Epistemology. To date, only a few studies involving project-based learning, nonrandomized STEM interventions among high school students have reported increased achievement in mathematics among Hispanic students, 25 changes in career aspirations, 26 and benefits to lower performing students compared with higher achieving students. 27 Other observational or descriptive studies have found an association between authentic research experiences in high school and an increased likelihood of completing a STEM major in college 28 and an increase in collaborative behavior. 29
Scientific Self-Efficacy
We found that Scientific Self-Efficacy was strongly correlated (0.66) with Value of Science in our data. This finding is consistent with expectancy-value research that reports that students often indicate that a task is valuable if they feel confident about succeeding (or vice versa). 14 The significant correlation between Scientific Self-Efficacy and SLA-D was somewhat lower (0.47) but noteworthy. Increases in Scientific Self-Efficacy may lead to increased student proficiency in STEM. Although the hypothesis of whether involving students in project-based learning in high school leads to increased self-efficacy and subsequently increased proficiency in the sciences is only beginning to be more fully investigated, it should be pointed out that this logic underlies major policy statements in science and education (ie, hands-on learning in the sciences increases proficiency in the sciences). 19,30 –33 Further in-depth investigation is needed to explain other important factors related to self-efficacy in science.
Personal Scientific Epistemology
Our results on students’ epistemologic beliefs are consistent with earlier work reporting significant changes in beliefs about knowledge of science after a hands-on intervention. In 2004, Conley et al 18 reported that elementary school students developed more sophisticated beliefs about the source and certainty of knowledge of science after a 9-week hands-on science unit, indicating a movement toward maturation of epistemologic beliefs. Involving students in study design and in data collection and analysis may promote epistemologic thinking, perhaps by helping students understand that answers to questions do not always come from authorities but can come from ongoing investigations and new discoveries. 18,34 Our findings at baseline are consistent with the findings of Conley et al, 18 who reported significantly lower scores among students with lower socioeconomic status. By midyear, we found temporal increases in Personal Scientific Epistemology scores to be highest among Epi Challenge participants who were African American, low income, and female. Overall, baseline differences among the 5 schools disappeared by midyear.
More sophisticated or mature epistemologic beliefs are associated with higher levels of achievement and learning, 35 although the mechanism for this association is unclear. One hypothesis is that achievement and learning could be related to an increased awareness that scientific knowledge is not owned by a particular group but, instead, developed through constant review, debate, and revision. Interestingly, we observed almost no association between epistemologic beliefs and the other 2 SLA-MB scales (value and self-efficacy), both with correlation coefficients <0.15, which indicates that the various components of the SLA-MB instrument do indeed measure different domains of scientific literacy and beliefs.
Personal Interest in Science
We developed the Personal Interest in Science 5-item scale for this study to evaluate the willingness of students to invest personal time and resources into scientific inquiry. Our findings that the Cronbach’s alpha coefficients for Personal Interest in Science were all >0.80 and correlated positively with each of the 3 SLA-MB scores suggest reasonable construct validity for the Personal Interest in Science instrument. On a separate note, we observed a temporal decrease in Personal Interest in Science scores among Epi Challenge participants that was significant for students receiving free/reduced lunch and nonsignificant decreases across all other subgroups. When we retest Epi Challenge participants and nonparticipants in their senior year, we will assess overall trends in interest in science and possible differences between the 2 groups.
Demonstrated Scientific Literacy and Ability
The National Research Council identified scientific literacy as a key outcome to be measured when assessing the quality of K-12 science education. 19 The SLA-D instrument has been initially validated as a way to measure scientific literacy. 14 In our study, students correctly answered a mean of 9 of the 19 questions in the SLA-D. Although no published norms for the SLA-D exist, these results fall within the expected range of performance for the instrument. 14 In addition, we found that SLA-D scores correlated moderately with the 3 SLA-MB scales, similar to results published by Fives et al 14 and suggestive of a relationship between demonstrated knowledge and motivations and beliefs.
Limitations
This study had several limitations. Although we identified and evaluated students at baseline who did not participate in the Epi Challenge, this study provided interim midyear results for only Epi Challenge participants. So, although we observed significant changes in the scientific literacy of Epi Challenge participants, our analyses were limited by the lack of a control group. In addition, this interim analysis did not assess impacts of other possibly important factors, such as parental engagement, student absenteeism, previous hands-on STEM experience, and past levels of scientific achievement. Also, although we selected students at random to participate in the Epi Challenge (from those with above-median Personal Interest in Science scores), a proportion of students declined the invitation (with its considerable time commitment) or dropped out during the intervention, resulting in a form of self-selection that could have biased our results. However, our sensitivity analysis showed that our results would have been similar even if all Epi Challenge participants had remained in the program. In addition, when we performed a comparison of baseline data of Epi Challenge participants with the 874 nonparticipants, we found no significant difference in baseline SLA-D.
Conclusions
Using epidemiologic principles for STEM education can increase interest and ability in related fields, as students experience authentic scientific inquiry through practicing team science, hypothesis development, and critical evaluation of scientific evidence. In the short term, exposure to the Epi Challenge intervention was associated with improvements in our measures of self-efficacy and sophistication of students’ epistemologic beliefs. Follow-up of this cohort may shed light on whether the intervention will increase the number of students who choose a STEM college major or career.
Footnotes
Acknowledgments
The authors thank the following people who were instrumental in conducting this research: Sieta Achampong, Trent Baker, Lori Beaver, Michael Benner, Allison Blumling, Trea Buck, Michael Carnes, Vernon M. Chinchilli, Steff Chortanoff, Ralph Cordell, Jenn Crager, Nadine J. Crone, Jenn Fasick, Cheryl Friedman, Sarah Goodman, Jessica Gray, Betty Holmboe, John Huebner, Jennifer Jenkins, Dawn Koons, Chris Kroft, Sherrie LaPorta, Craig Livelsberger, Laura Luongo, Mark McCauslin, Jody McClymont, Todd Neuhard, Terri O’Neil, Diane J. Pague, Robin Perry-Smith, Audrey Plassio, Sunada Roberts, Ken Roseberry, Stacey Rossi, Eugene Spells, Shwetha Srikanth, Andrea Stennett, Emilie B. Tekely, Michael Thompson, Stacy Thorpe, Abbey Wascovich, and Jamal Wells.
Declaration of Conflicting Interests
The authors declared no potential conflicts of interest with respect to the research, authorship, and/or publication of this article.
Funding
The authors disclosed receipt of the following financial support for the research, authorship, and/or publication of this article: This study was funded by the National Institutes of Health NIGMS grant to RTW (1R01GM107715-01).