
Abstract
Objective:
The objective of this study was to investigate usual source of care (USC) over time.
Methods:
A nationally representative sample of working-age adults in the Medical Expenditure Panel Survey (Panels 16 [2011-2012] and 17 [2012-2013]) was divided into 3 groups based on USC questions asked during 2 waves: (1) those having a USC during both waves (always USC), (2) those not having a USC during either wave (never USC), and (3) those who gained or lost a USC between the 2 waves (changed USC). The study examined the sociodemographic and health characteristics associated with these groups and the main reasons for not having a USC among those who never had a USC and those who changed their USC.
Results:
Of the 10 792 adults in the analysis, a longitudinally weighted 18.8% reported that their USC changed during the period. Among adults in the changed USC group, those with private (odds ratio [OR] = 2.0, P = .001) or public (OR = 2.2, P = .001) health insurance and 1 (OR = 1.7, P = .04) or ≥2 (OR = 3.1, P = .02) chronic health conditions were more likely to transition to having a USC from not having a USC, compared with those who had no insurance and no chronic conditions. Compared with those in the changed USC group, those in the never USC group were more likely to report preferring not to have a USC (57.9% vs 80.1%, P < .001).
Conclusions:
Insurance and public health policies and programs are needed to reduce short-term changes in USC and increase the number of adults with ongoing, consistent USC.
Keywords
Usual source of care (USC) refers to the provider or place consulted when a person is sick or in need of medical advice. Approximately 80% of US adults have reported having a USC at any given time, 1,2 and the prevalence is even higher (93%-95%) among those who have health problems. 3,4 The benefits of having a USC include overall good health and positive health care outcomes and experiences. 1 –12 These benefits are observed in the general population, 1,5,6 among low-income people, 7,9 and among those with chronic health conditions. 3,4
One limitation of USC research is its reliance on cross-sectional data. Although snapshots are useful for investigating USC at a single point in time, they often fail to account for the dynamic relationship between adults and their health care over time. For example, retrospective studies reported that up to 11% of adults changed their USC when they were observed for at least 1 year. 13 –15 Adults whose relationship with a USC is disrupted have poorer health outcomes, including higher odds of unmet medical needs, 14,16 problems with medications and receiving needed care, 16 and poorer quality of and satisfaction with care, as compared with adults who have no disruptions in USC. 13,14 Yet, little is known about how adults who have disruptions in their USC compare with those who have never had a USC and those who have always had a USC.
Some studies have examined the reasons that adults do not have a USC. Several studies showed that most adults who did not have a USC did not want or need it; however, these same studies cited financial reasons for a substantial number of people not having a USC. 2,17,18 On the other hand, those who have had disruptions in their USC reported different reasons for not having a USC from those who have never had a USC. The most frequently cited reasons for changing USC were changes in health insurance and problems with health care quality 14,17,19 ; however, these studies had limitations. Some were retrospective studies in which adults who did not have a USC were not asked if they previously had a USC. Additionally, these reports did not differentiate the responses given by those who never had a USC from those who had lost their USC.
This study addressed gaps in the literature by examining a nationally representative population of working-age adults during a 2-year period. The study population was divided into 3 groups based on USC questions asked during 2 waves: (1) those who had a USC during both waves, (2) those who did not have a USC during either wave, and (3) those who gained or lost their USC between the 2 waves. The primary objective of this study was to determine the prevalence of adults in each USC group. A secondary objective was to compare the sociodemographic and health characteristics of working-age adults in these 3 groups. A tertiary objective was to examine the reasons for not having a USC and compare the reasons reported by those who never had a USC with the reasons reported by those who changed their USC.
Methods
Data and Sample
The Medical Expenditure Panel Survey (MEPS) is a large-scale survey of families and individuals in the United States that collects data on the cost and use of health care and health insurance coverage. 20 Participants are a nationally representative sample of community-dwelling noninstitutionalized US civilians who previously participated in the National Health Interview Survey. New participants are surveyed every year, and each group of participants is then followed serially for 2 years, creating an overlapping design. Data are gathered during 5 waves in the 2-year period of the survey; the first 2 waves of data collection occur in the first year, the third wave straddles years 1 and 2, and the last 2 waves occur during the second year. Because our study used a publicly available dataset, the Tufts University Institutional Review Board determined that it was excluded from review.
This study used the longitudinal data files for Panel 16 (2011-2012) and Panel 17 (2012-2013) of the MEPS. These panels were chosen because they were the last 2 panels of participants enrolled before implementation of the individual mandate provision of the Patient Protection and Affordable Care Act of 2010. 21 The mandate is associated with increases in health insurance coverage among previously uninsured groups, 22 so it may affect USC. The most recent longitudinal MEPS data available are from Panel 18, which was collected during 2013-2014. These dates straddle the implementation of the individual mandate. Had this panel been used, it would have been impossible to distinguish the impact of the individual mandate on USC from other factors influencing USC.
The analytic sample comprised 10 792 working-age adults who responded to the survey for themselves and who were aged 18-64 during the second and fourth waves of data collection for each panel. Age at the time of these 2 waves was used because questions about USC were asked during these waves. Data collection during the second and fourth waves occurred during the middle of each panel’s first and second years, respectively, allowing for analysis of USC during a full 2-year period. Adults aged ≥65 were excluded from the sample because of the ways that access to health insurance in the United States changes when adults become eligible for Medicare. 23 Children aged <16 were excluded because they were not eligible to respond to the MEPS for themselves. Teenagers aged 16-17 were excluded because they are not traditionally included in studies on working-age adults.
Measures
In the MEPS, survey respondents were asked during waves 2 and 4 whether they had a “particular doctor’s office, health center, or other place that you usually go if you are sick or need advice about your health.” 20 These responses determined the categorization of respondents into USC groups. Those who responded yes to having a USC at both waves were grouped as “always USC,” those who reported not having a USC at both waves were grouped as “never USC,” and those who reported having a USC during one wave and not the other were grouped as “changed USC.” Those who reported that their USC was an emergency department were excluded from analysis. 7
The changed USC group had 2 subgroups: those who “lost” a USC (ie, responded yes during wave 2 and no during wave 4) and those who “gained” a USC (ie, responded no during wave 2 and yes during wave 4). These 2 subgroups were treated as a single changed USC group because no substantial differences were found between them in sex, age, educational attainment, residence in a metropolitan statistical area, employment status, marital status, self-rated health, health insurance type, poverty status, chronic health conditions, or when comparing the periods when these adults did and did not have a USC (data available upon request).
In the MEPS, respondents who reported not having a USC (in wave 2 and/or in wave 4) were asked in each wave to provide a main reason for not having a USC. These responses were summarized and ranked by frequency for 2 USC groups: the never USC group and the changed USC group. For these calculations, the 2 changed USC subgroups (those who lost their USC and those who gained it) were once again treated as a single group, because we found no substantial differences between these subgroups in the reasons reported.
Following the approach of Viera and colleagues, 18 the preference for having a USC was also examined. Based on stated reasons for not having a USC, 2 subpopulations of adults without a USC were created: those who preferred to have a USC and those who did not. Those respondents who reported their main reason for not having a USC as either “seldom or never sick,” “goes different places for different needs,” or “doesn't use doctors/treats self” were considered as preferring not to have a USC. All others were considered as preferring to have a USC (Table 1).
Sociodemographic and health measures and timing and frequency of data collection applied to data from the Medical Expenditure Panel Surveya Panels 16 (2011-2012) and 17 (2012-2013)
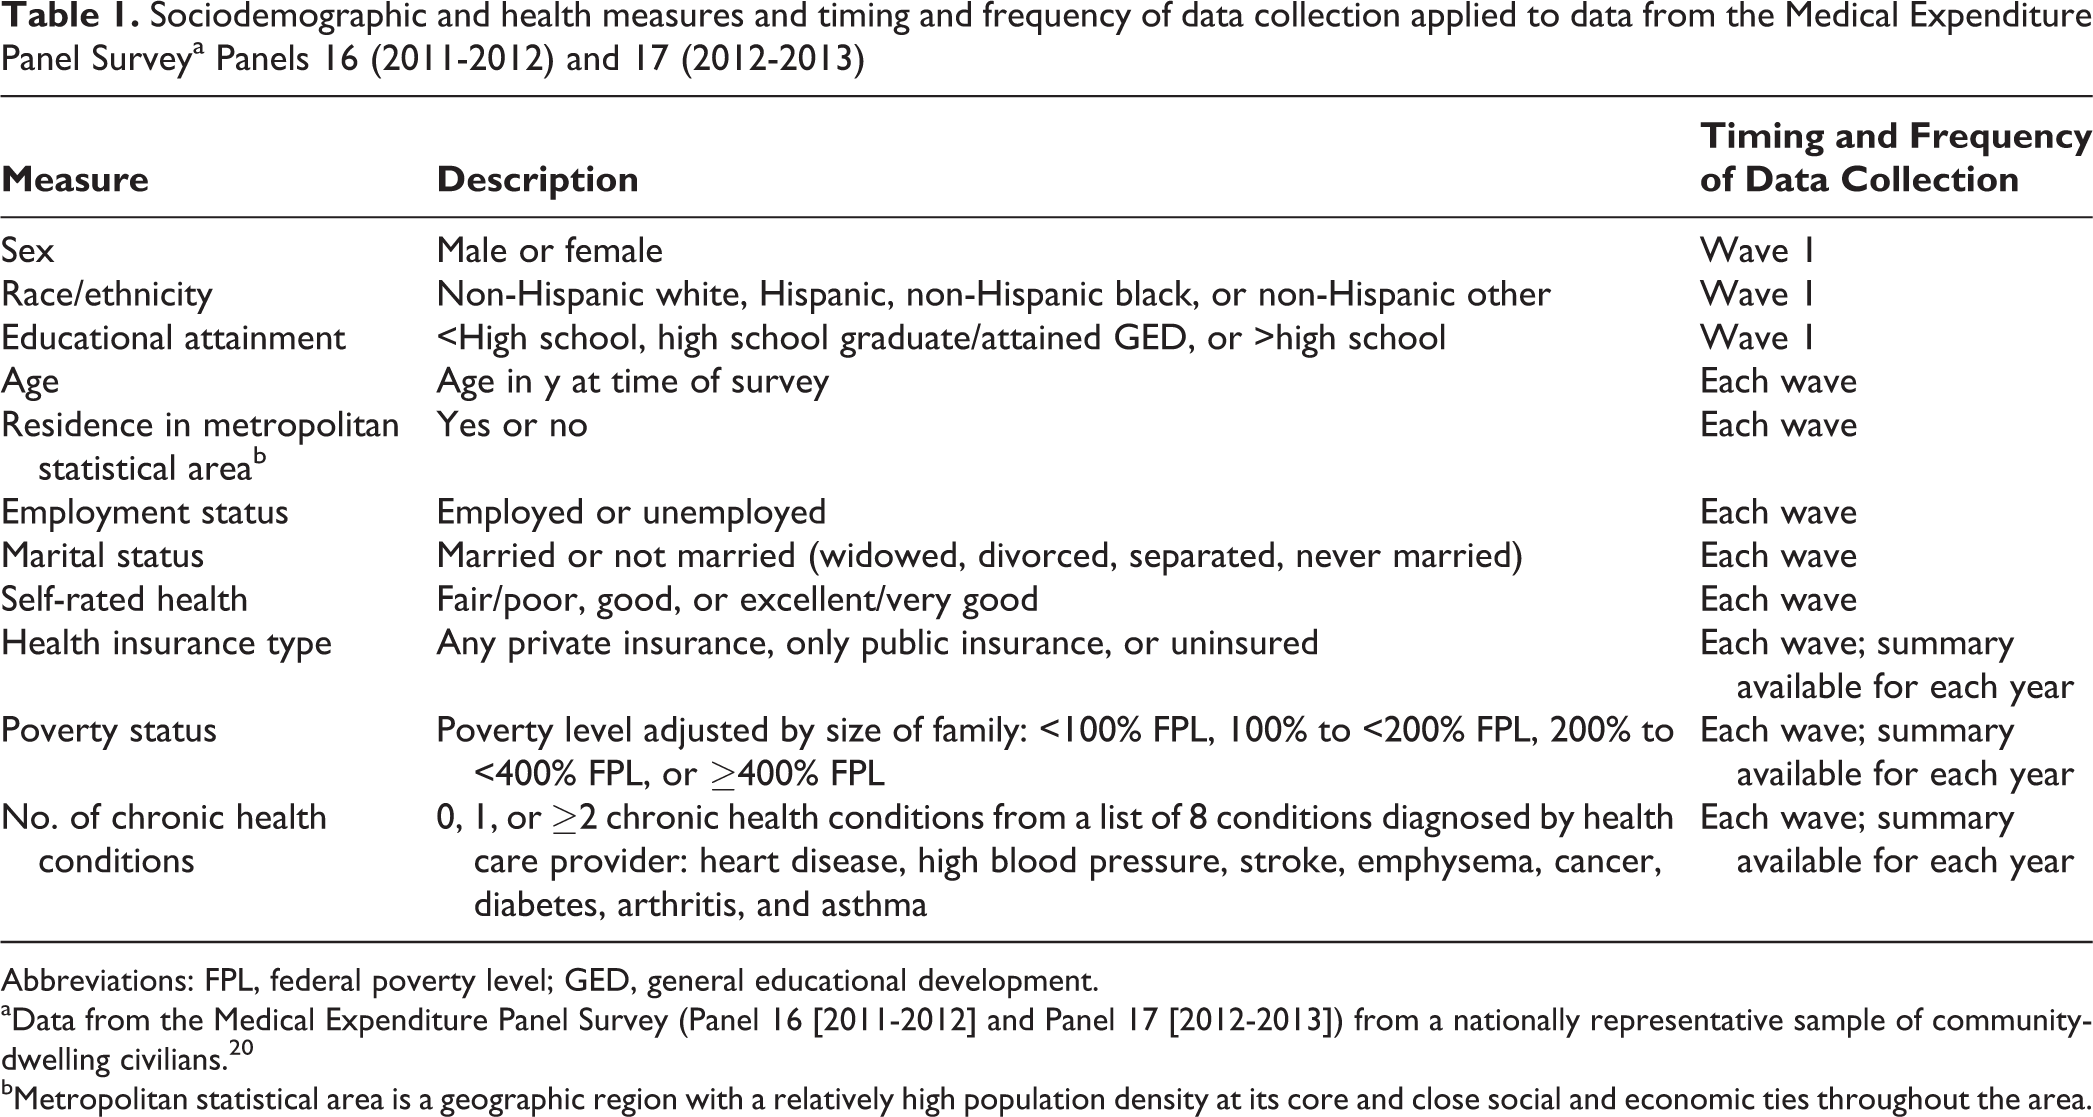
Abbreviations: FPL, federal poverty level; GED, general educational development.
aData from the Medical Expenditure Panel Survey (Panel 16 [2011-2012] and Panel 17 [2012-2013]) from a nationally representative sample of community-dwelling civilians. 20
bMetropolitan statistical area is a geographic region with a relatively high population density at its core and close social and economic ties throughout the area.
Statistical Methods
The Pearson χ2 test was used to determine differences in sociodemographic and health characteristics among the 3 USC groups. The t test was used to determine whether mean age differed among the 3 USC groups. The χ2 test was also used to determine whether the reasons for not having a USC differed between the never USC and changed USC groups.
Multinomial logistic regression analyses determined which sociodemographic and health characteristics were associated with the 3 USC groups. Relative risk ratios (RRs) and 95% confidence intervals (CIs) were calculated; RRs were interpreted as the likelihood of having either never USC or changed USC compared with always USC or changed USC compared with never USC. Sensitivity analyses revealed that the magnitude, direction, and significance of coefficients were consistent when potentially collinear predictors were excluded.
Fixed effects (or conditional) logistic regression was used to determine which sociodemographic and health characteristics were associated with transitioning from not having a USC to having a USC. Time invariant variables such as sex and race/ethnicity were dropped, because people acted as their own controls for these variables. Odds ratios (ORs) and 95% CIs were calculated; the OR is the likelihood of transitioning from not having a USC to having a USC. The magnitude, direction, and significance of the predictors were consistent in models using a reduced set of predictors. For both regression models, age in years was a continuous variable.
All analyses were conducted using Stata version 11.2, 24 accounting for the complex survey design of the MEPS. When evaluating the data from both panels, longitudinal weighting was used. The longitudinal weight was divided by 2 to account for the pooling of panels. 20 Statistical significance was set at P ≤ .05.
Results
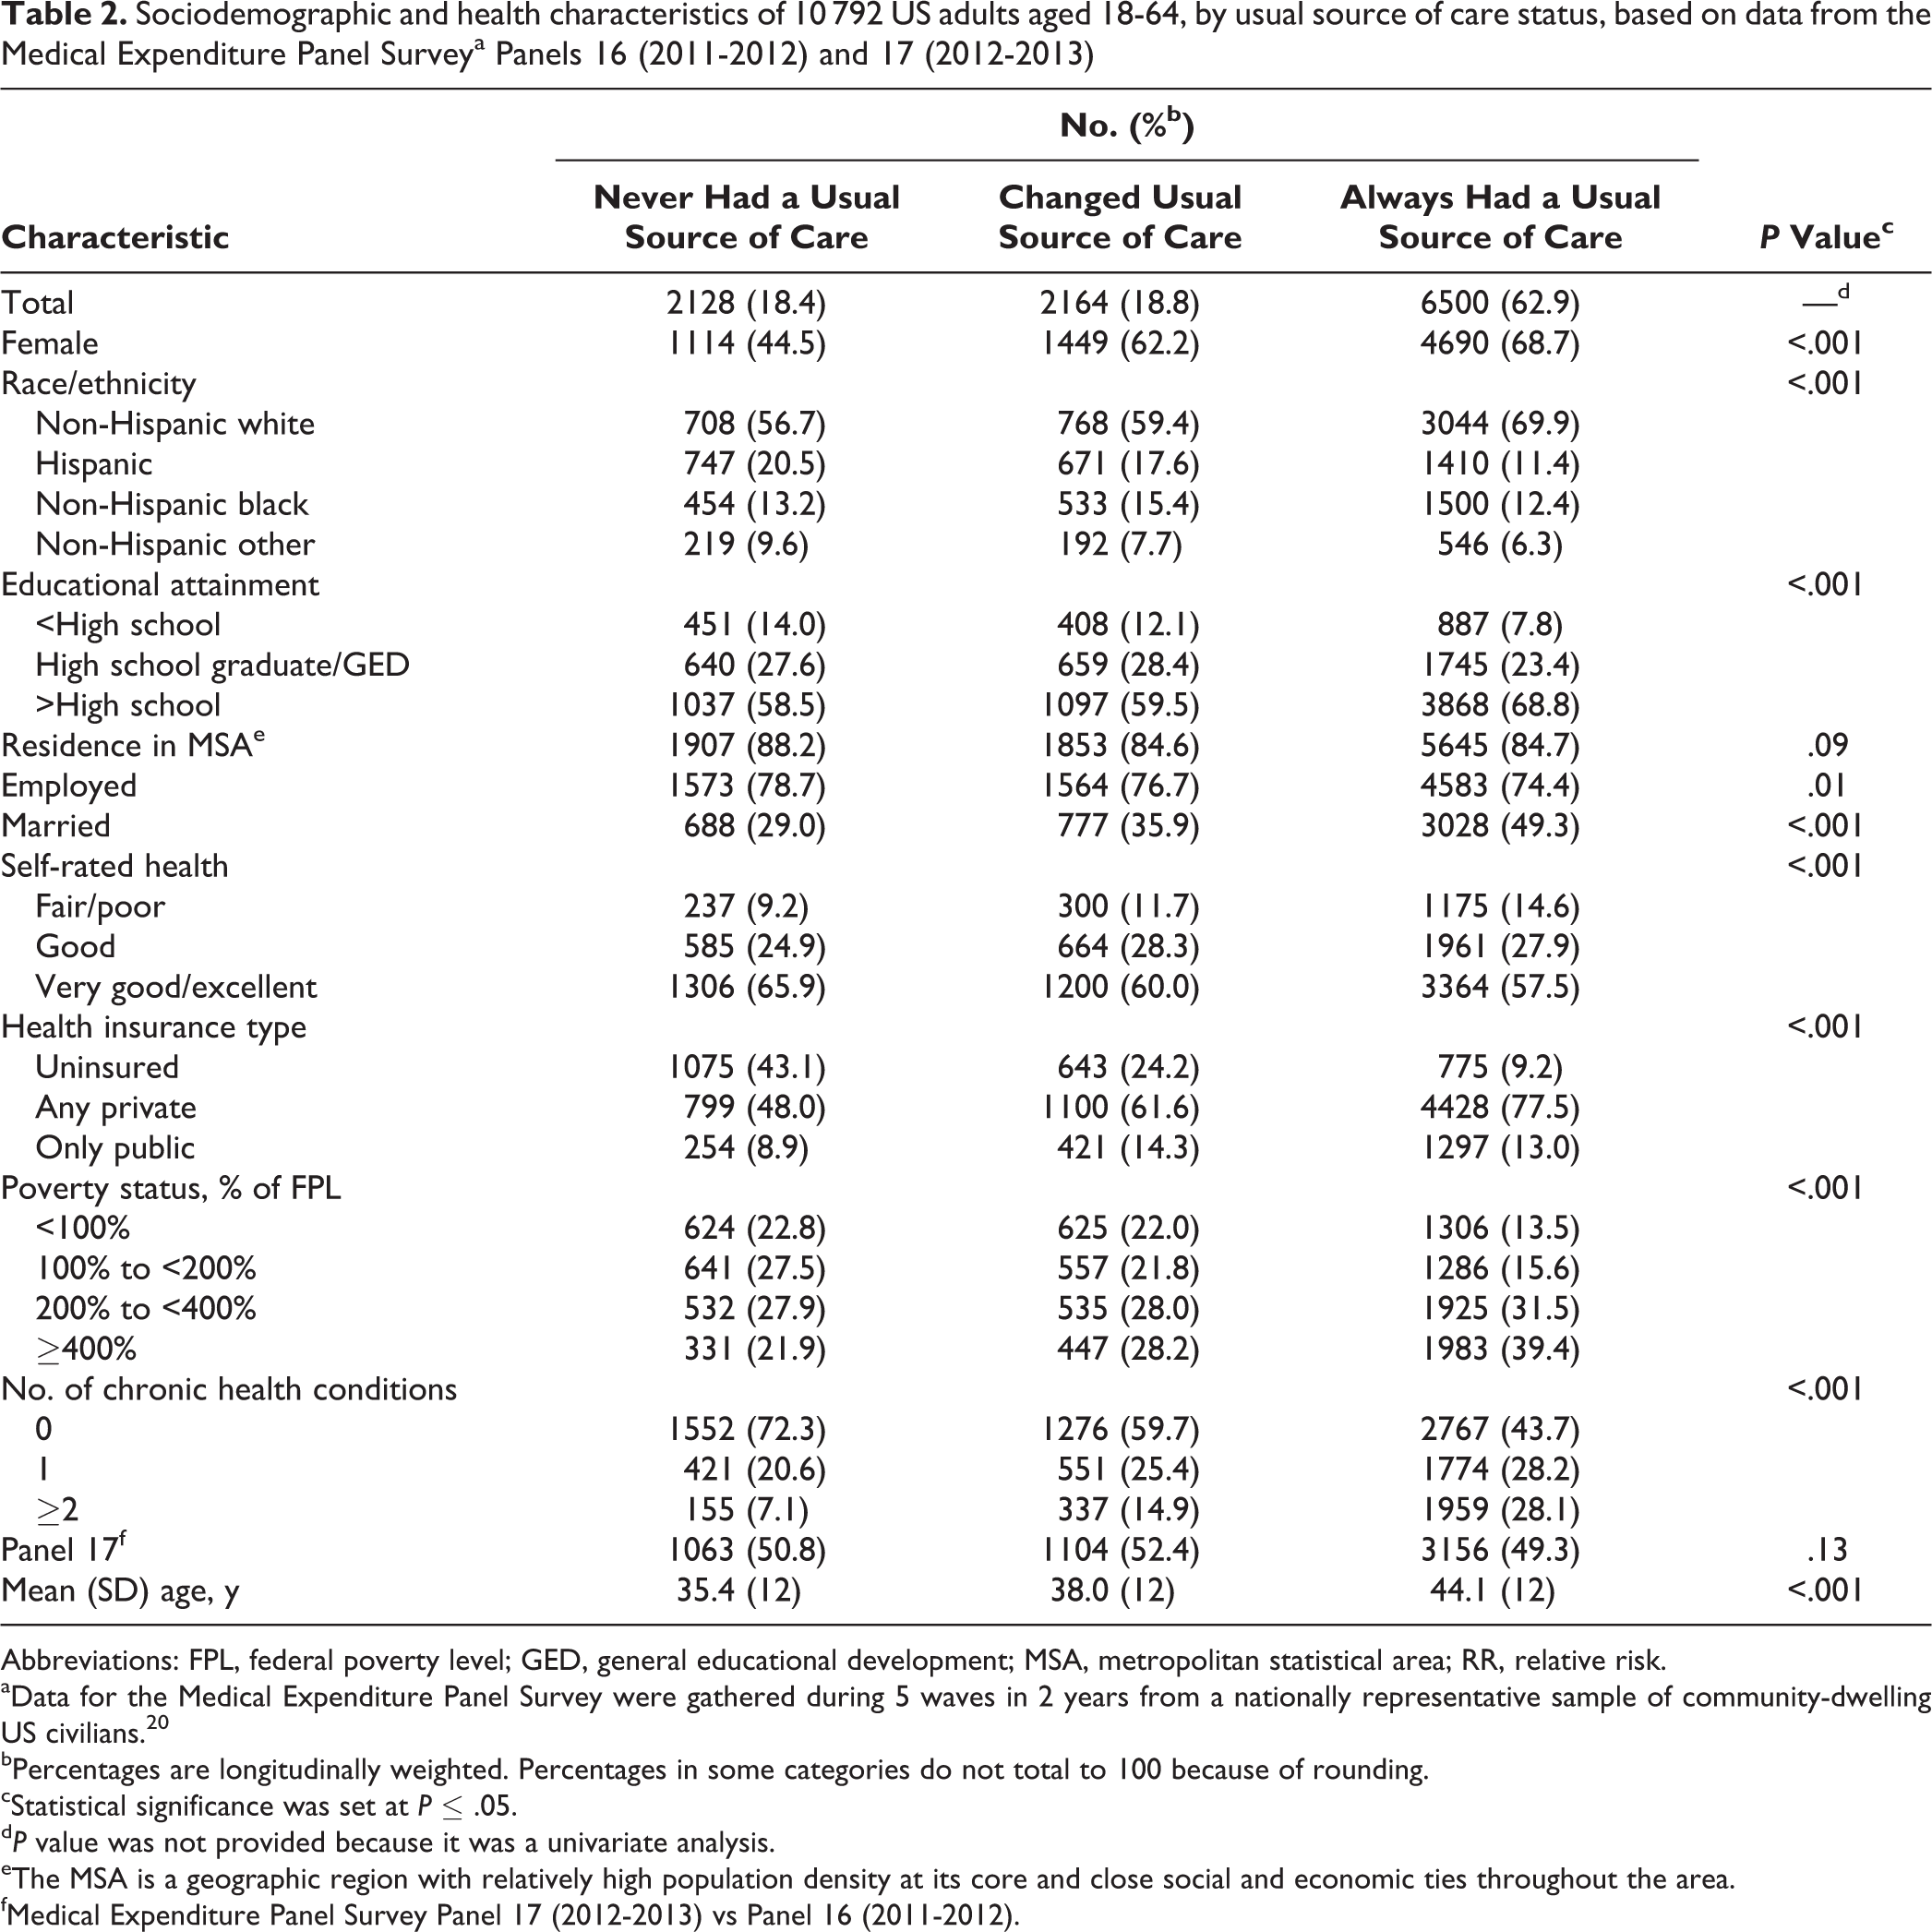
During a 2-year period, of the 10 792 adults in our analysis, 2164 (longitudinally weighted, 18.8%) reported that their USC changed, including 1206 (longitudinally weighted, 10.3%) who gained a USC and 958 (longitudinally weighted, 8.5%) who lost it; 2128 (longitudinally weighted, 18.4%) reported that they never had a USC; and 6500 (longitudinally weighted, 62.9%) reported that they always had a USC (Table 2).
Sociodemographic and health characteristics of 10 792 US adults aged 18-64, by usual source of care status, based on data from the Medical Expenditure Panel Surveya Panels 16 (2011-2012) and 17 (2012-2013)
Abbreviations: FPL, federal poverty level; GED, general educational development; MSA, metropolitan statistical area; RR, relative risk.
aData for the Medical Expenditure Panel Survey were gathered during 5 waves in 2 years from a nationally representative sample of community-dwelling US civilians. 20
bPercentages are longitudinally weighted. Percentages in some categories do not total to 100 because of rounding.
cStatistical significance was set at P ≤ .05.
d P value was not provided because it was a univariate analysis.
eThe MSA is a geographic region with relatively high population density at its core and close social and economic ties throughout the area.
fMedical Expenditure Panel Survey Panel 17 (2012-2013) vs Panel 16 (2011-2012).
According to bivariate analysis, the following sociodemographic and health characteristics differed significantly among the 3 USC groups: sex, race/ethnicity, educational attainment, employment status, marital status, self-rated health, health insurance, poverty status, chronic health conditions, and mean age (all P < .001 except employment status, which was P = .01) (Table 2). Residence in a metropolitan statistical area and the number of participants in Panel 17 did not differ significantly among the 3 USC groups.
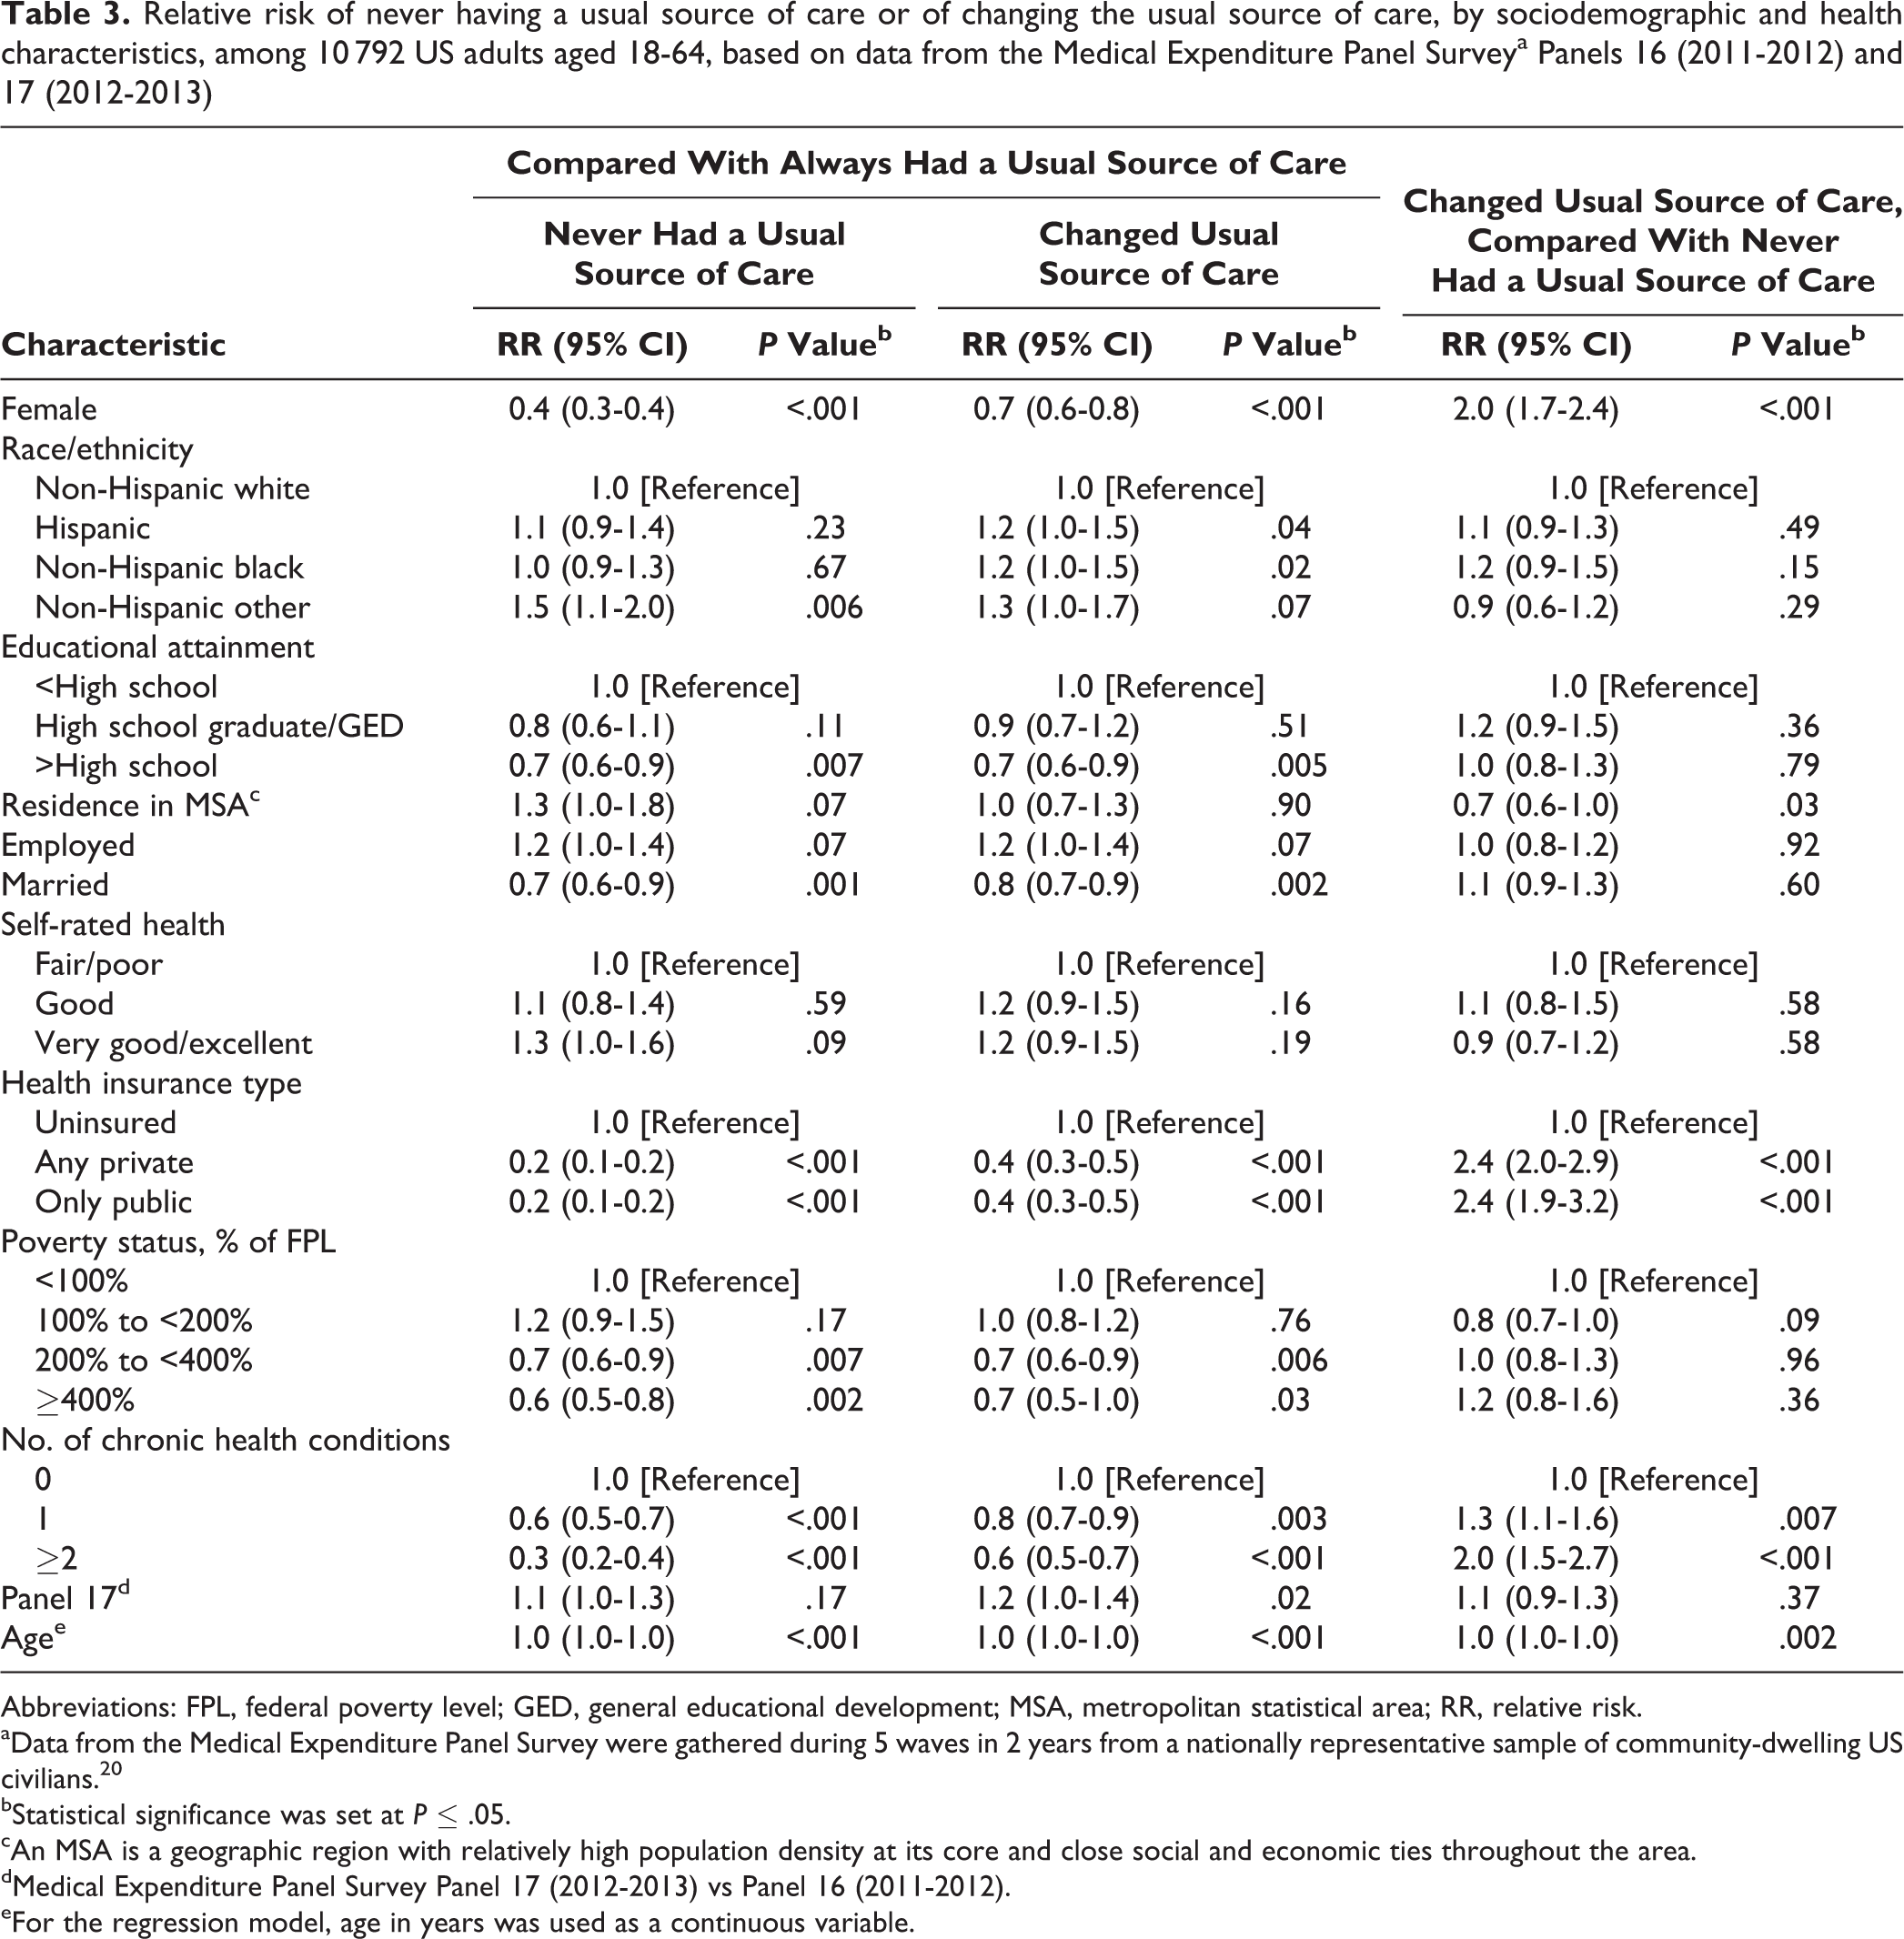
Many differences remained in multivariate models (Table 3). Compared with adults in the always USC group, adults in the never USC and changed USC groups were less likely to have >high school diploma (RR = 0.7, P = .007; RR = 0.7, P = .005), to have private health insurance (RR = 0.2 and RR = 0.4, P < .001) or public health insurance (RR = 0.2 and RR = 0.4, P < .001), to have 1 chronic condition (RR = 0.6, P < .001; RR = 0.8, P = .003) or ≥2 chronic conditions (RR = 0.3 and RR = 0.6, P < .001), and to be women (RR = 0.4 and RR = 0.7, P < .001), married (RR = 0.7, P = .001; RR = 0.8, P = .002), and at 200% to <400% of the federal poverty level (RR = 0.7, P = .007; RR = 0.7, P = .006) or ≥400% of the federal poverty level (RR = 0.6, P = .002; RR = 0.7, P = .03).
Relative risk of never having a usual source of care or of changing the usual source of care, by sociodemographic and health characteristics, among 10 792 US adults aged 18-64, based on data from the Medical Expenditure Panel Surveya Panels 16 (2011-2012) and 17 (2012-2013)
Abbreviations: FPL, federal poverty level; GED, general educational development; MSA, metropolitan statistical area; RR, relative risk.
aData from the Medical Expenditure Panel Survey were gathered during 5 waves in 2 years from a nationally representative sample of community-dwelling US civilians. 20
bStatistical significance was set at P ≤ .05.
cAn MSA is a geographic region with relatively high population density at its core and close social and economic ties throughout the area.
dMedical Expenditure Panel Survey Panel 17 (2012-2013) vs Panel 16 (2011-2012).
eFor the regression model, age in years was used as a continuous variable.
Although the risk factors for the never USC and changed USC groups were similar, when these groups were compared with adults in the always USC group, significant differences in the sociodemographic and health characteristics of those in the never USC and changed USC groups were found (Table 3). Respondents with private or public health insurance were 2.4 times more likely (RR = 2.4, P < .001 for both) to be in the changed USC group to in the never USC group. Similarly, respondents with 1 chronic condition (RR = 1.3, P = .007) and ≥2 chronic conditions (RR = 2.0, P < .001) and women (RR = 2.0, P < .001) were also significantly more likely to be in the changed USC group than in the never USC group. In contrast, those who resided in a metropolitan statistical area were 30% as likely (RR = 0.7, P = .03) to be in the changed USC group as in the never USC group.
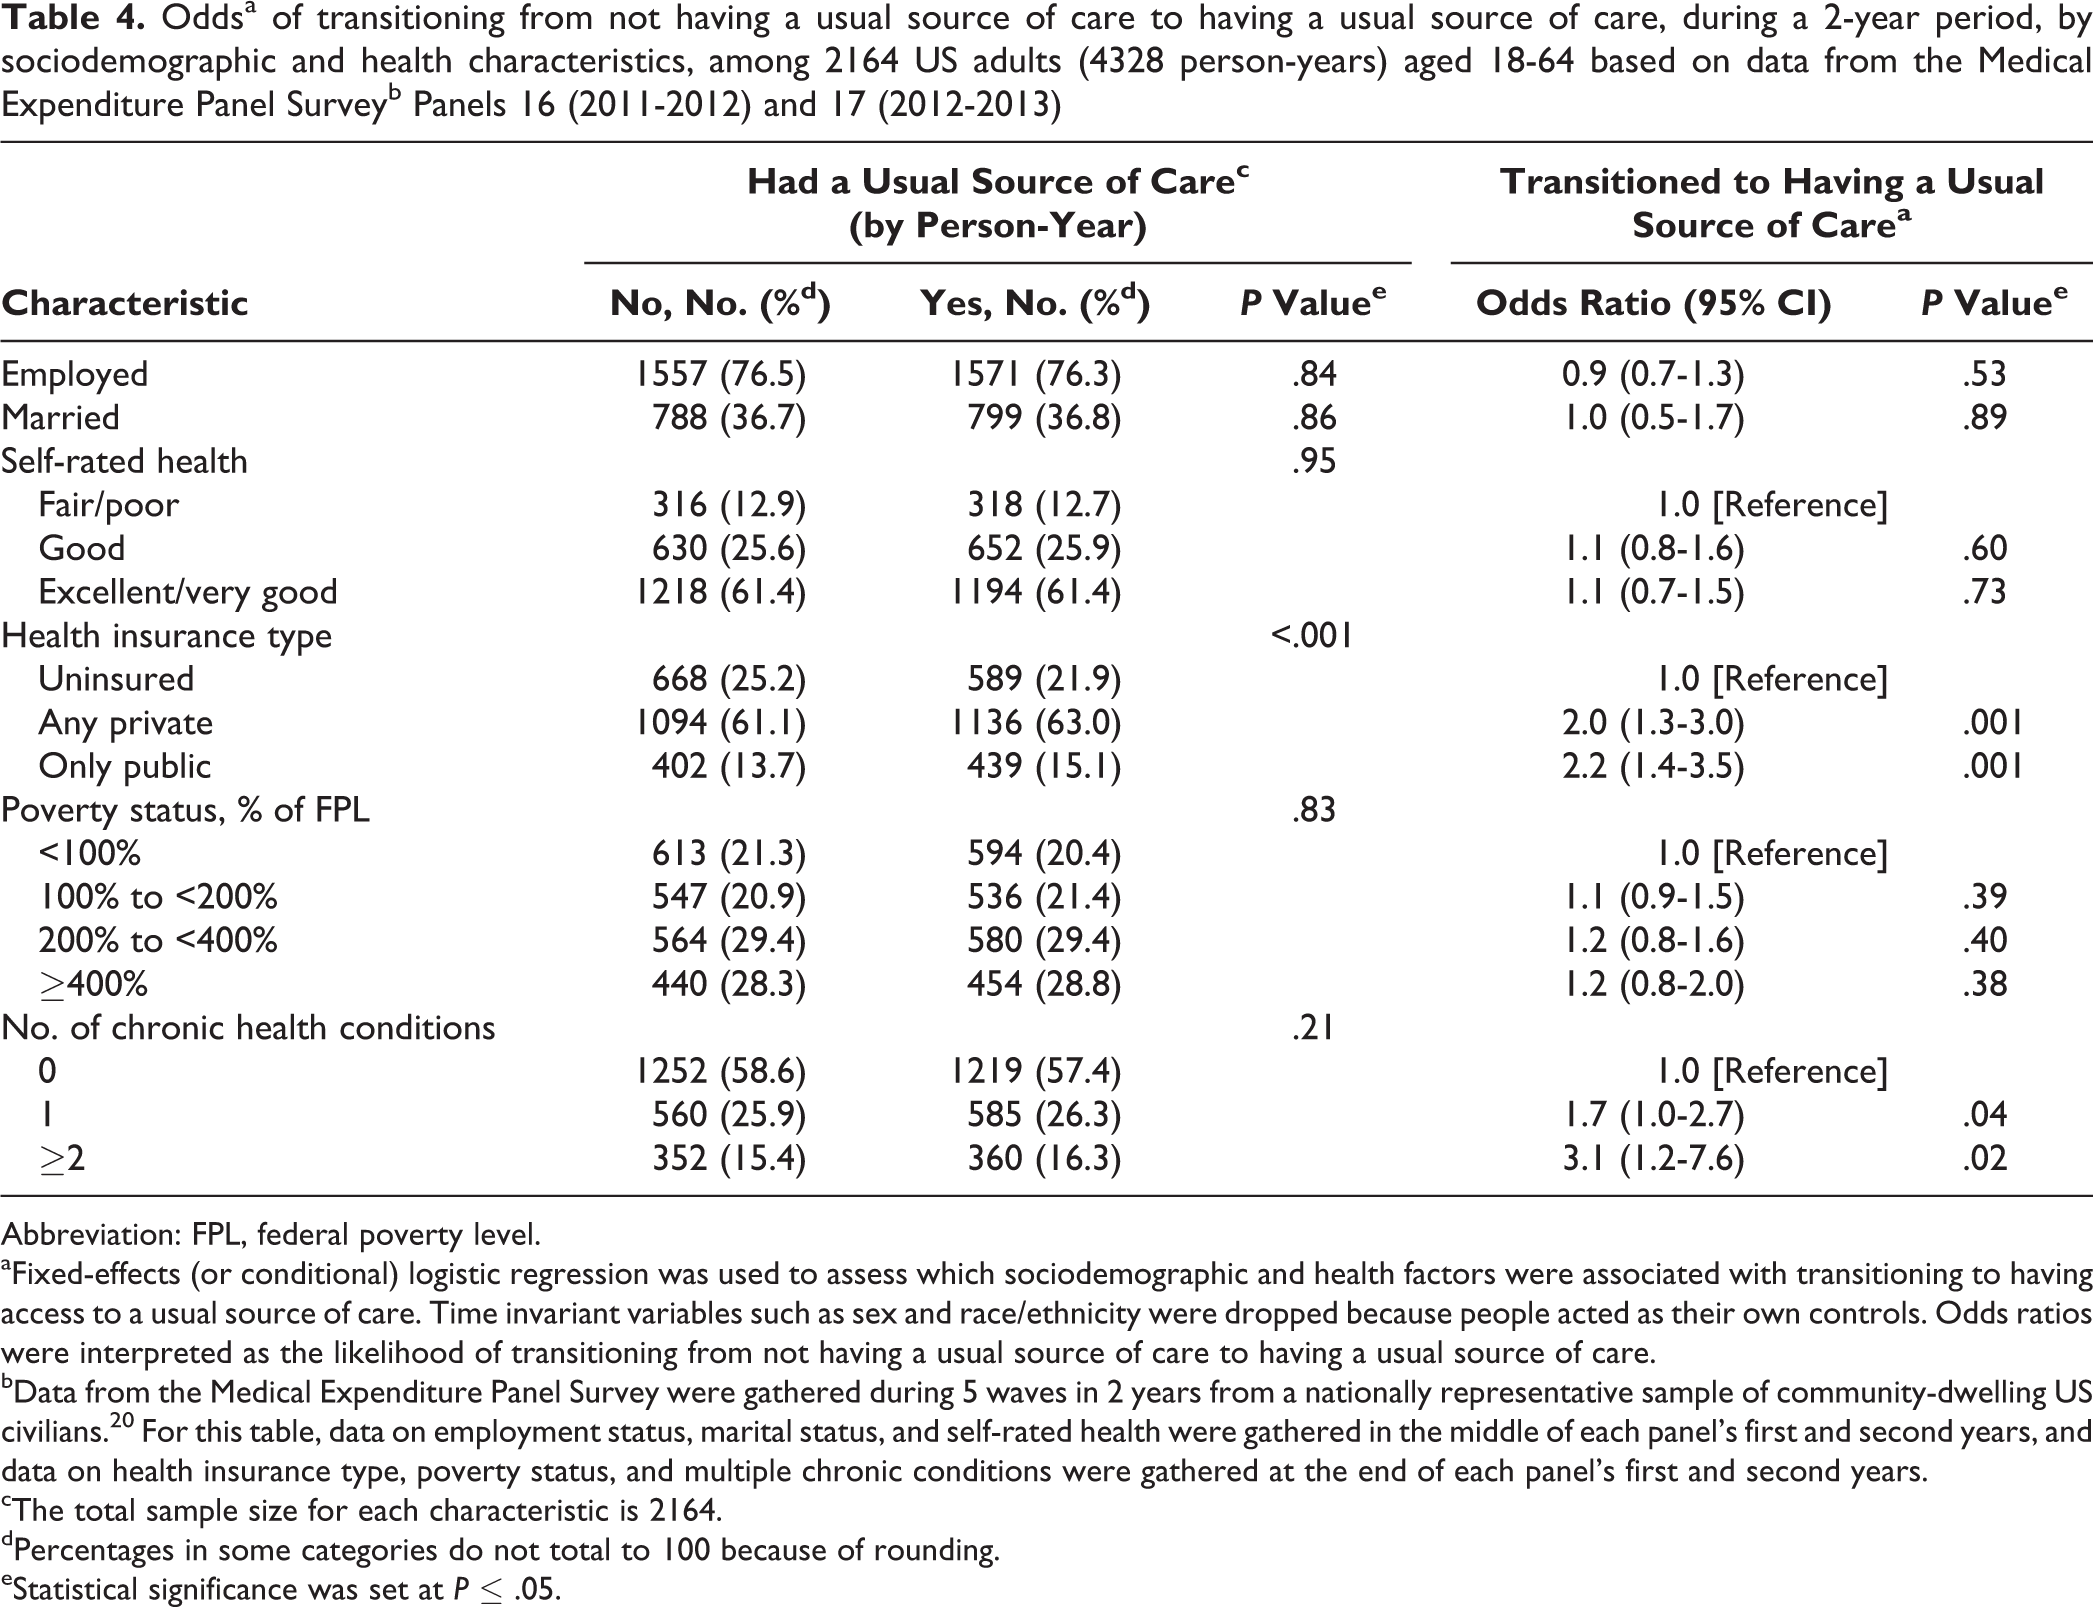
According to the fixed-effects logistic regression, those with private health insurance (OR = 2.0, P = .001) or public health insurance (OR = 2.2, P = .001) had significantly higher odds of transitioning from not having a USC to having a USC than their uninsured peers (Table 4). Those with 1 chronic condition (OR = 1.7, P = .04) or ≥2 chronic conditions (OR = 3.1, P = .02) had significantly higher odds of transitioning to having a USC than those without any chronic health conditions.
Oddsa of transitioning from not having a usual source of care to having a usual source of care, during a 2-year period, by sociodemographic and health characteristics, among 2164 US adults (4328 person-years) aged 18-64 based on data from the Medical Expenditure Panel Surveyb Panels 16 (2011-2012) and 17 (2012-2013)
Abbreviation: FPL, federal poverty level.
aFixed-effects (or conditional) logistic regression was used to assess which sociodemographic and health factors were associated with transitioning to having access to a usual source of care. Time invariant variables such as sex and race/ethnicity were dropped because people acted as their own controls. Odds ratios were interpreted as the likelihood of transitioning from not having a usual source of care to having a usual source of care.
bData from the Medical Expenditure Panel Survey were gathered during 5 waves in 2 years from a nationally representative sample of community-dwelling US civilians. 20 For this table, data on employment status, marital status, and self-rated health were gathered in the middle of each panel’s first and second years, and data on health insurance type, poverty status, and multiple chronic conditions were gathered at the end of each panel’s first and second years.
cThe total sample size for each characteristic is 2164.
dPercentages in some categories do not total to 100 because of rounding.
eStatistical significance was set at P ≤ .05.
The top 5 reported reasons for not having a USC (seldom or never sick, no health insurance, cost of medical care, recently moved, and goes to different places for different needs) were similar for both the never USC and changed USC groups (Table 5). However, some differences were found between the 2 groups in the reported frequency of reasons for not having a USC. The most frequently reported reason in both groups for not having a USC was being “seldom or never sick”; however, the differences in how frequently it was reported were significant: 61.0% (2348 of 4088) of those in the never USC group and 49.9% (1051 of 2115) of those in the changed USC group (P < .001). Respondents in the never USC group were significantly more likely to prefer not having a USC than those in the changed USC group (80.1% vs 57.9%, P < .001).
Reasons for not having a usual source of care, by those who never had a usual source of care and those who changed (lost or gained) their usual source of care, during a 2-year period, among US adults aged 18-64, Medical Expenditure Panel Surveya Panels 16 (2011-2012) and 17 (2012-2013)
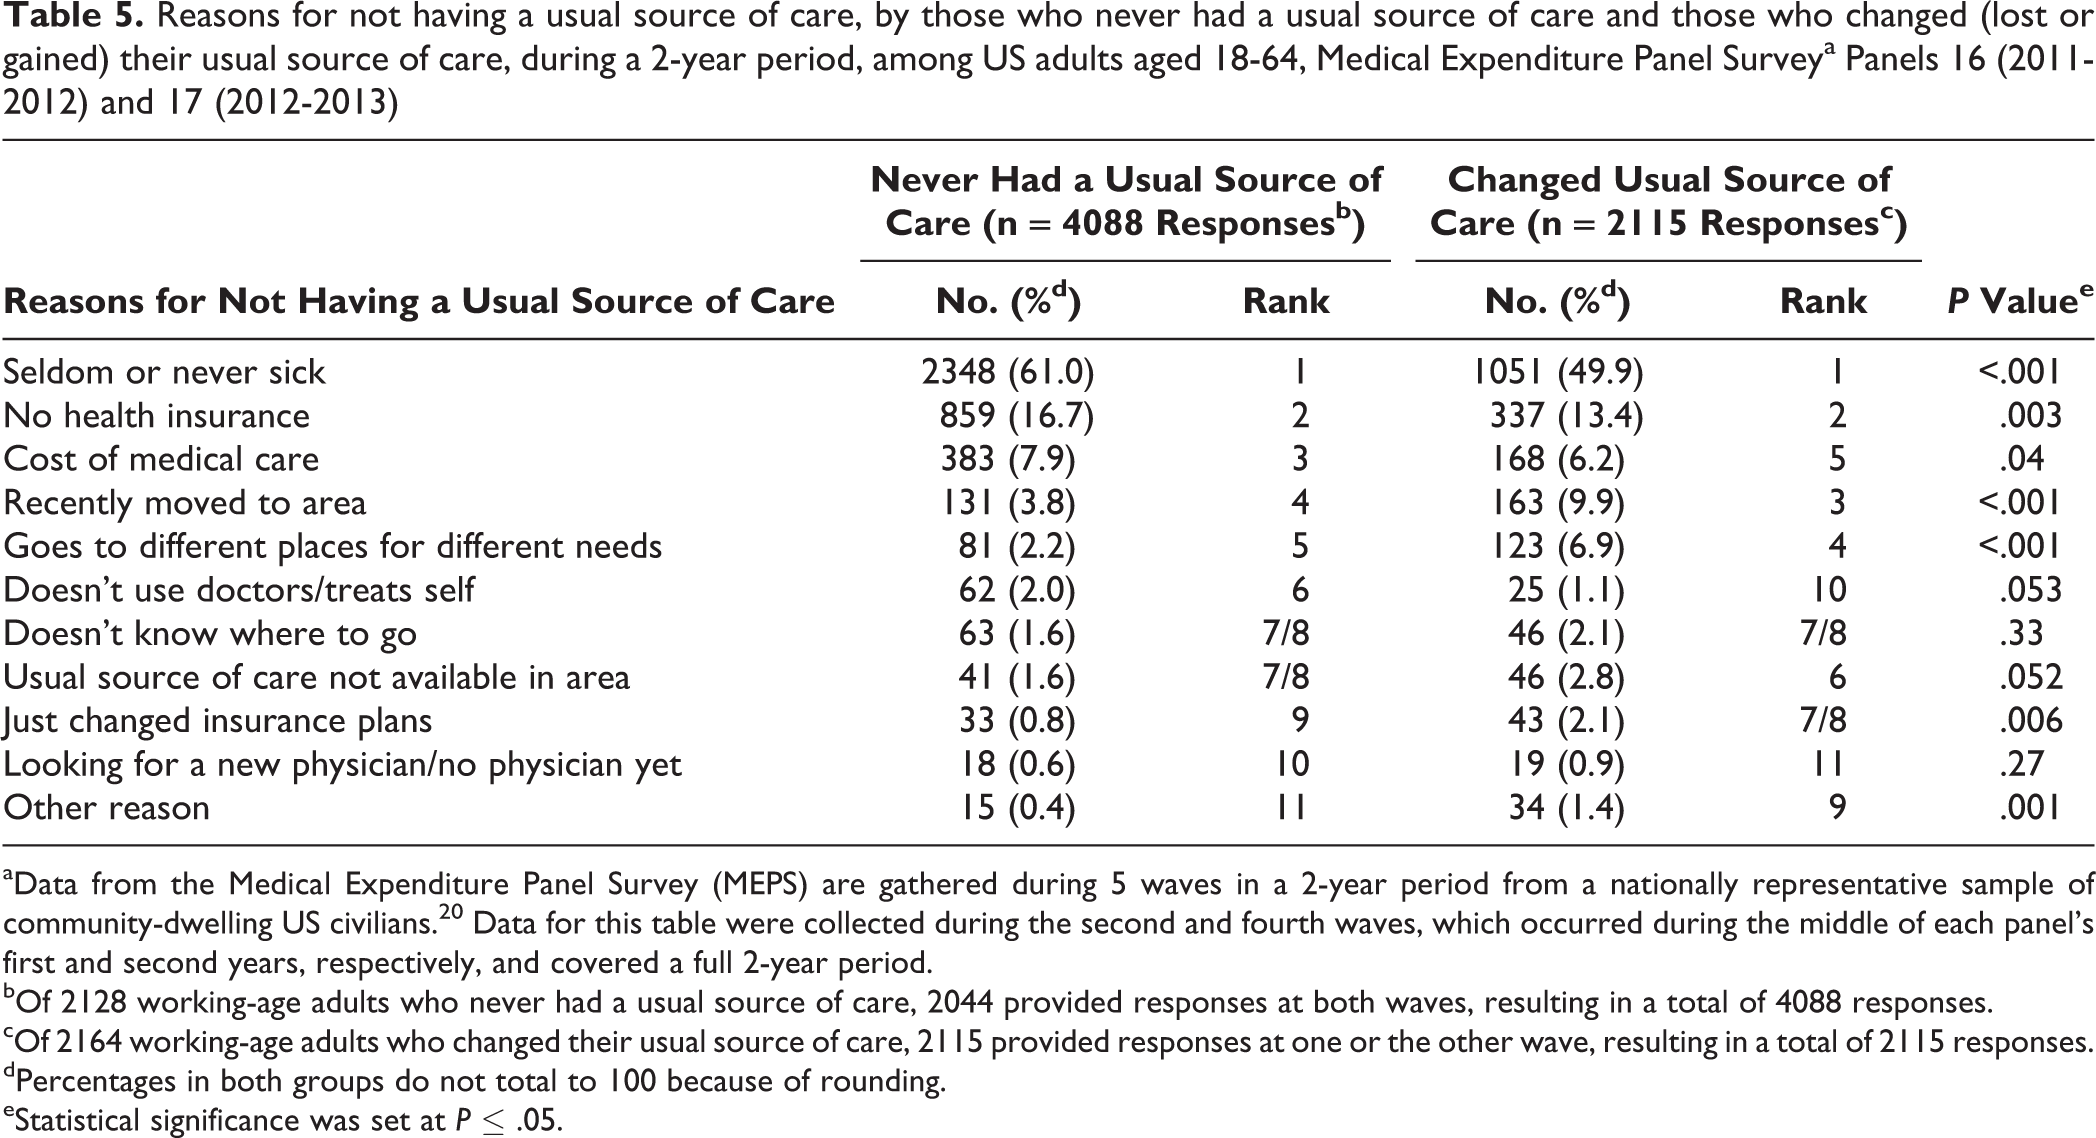
aData from the Medical Expenditure Panel Survey (MEPS) are gathered during 5 waves in a 2-year period from a nationally representative sample of community-dwelling US civilians. 20 Data for this table were collected during the second and fourth waves, which occurred during the middle of each panel’s first and second years, respectively, and covered a full 2-year period.
bOf 2128 working-age adults who never had a usual source of care, 2044 provided responses at both waves, resulting in a total of 4088 responses.
cOf 2164 working-age adults who changed their usual source of care, 2115 provided responses at one or the other wave, resulting in a total of 2115 responses.
dPercentages in both groups do not total to 100 because of rounding.
eStatistical significance was set at P ≤ .05.
Discussion
During a 2-year period, nearly two-thirds of adults reported always having a USC, 18% reported never having a USC, and nearly 19% reported that their USC had changed (ie, that they either lost or gained a USC). Those who reported changing their USC had different sociodemographic and health characteristics than those who reported never or always having a USC. Furthermore, among those who changed their USC, transitioning from not having a USC to having a USC was more likely among adults who had private or public health insurance or 1 or ≥2 chronic health conditions. The top reasons for not having a USC were similar between those who changed their USC and those who never had a USC, but the frequency with which these reasons were reported differed significantly.
Those in the study who reported changing their USC had different sociodemographic and health characteristics from those who reported never or always having a USC; namely, people who changed their USC were somewhat better off than their peers who never had a USC and had lower socioeconomic status than their peers who always had a USC. Among those who reported changing their USC, gaining any type of insurance (from being uninsured) or having chronic health conditions (compared with no chronic conditions) was associated with transitioning from not having a USC to having a USC. These findings are consistent with cross-sectional studies on USC and health insurance coverage 1,2,7,12,17,18,25,26 and on USC and related health factors. 2,18,26,27 These studies and the results of the present study emphasize the important roles that health insurance coverage and chronic health conditions play in the USC dynamic: adults without health insurance coverage tend to forgo preventive care and wait until they have a chronic condition to seek and obtain a USC.
The Affordable Care Act may address the needs of the substantial proportion of adults in both the never USC and changed USC groups who reported that lack of health insurance and costs of medical care inhibited their access to a USC. The Affordable Care Act’s individual mandate, Medicaid expansion, and health insurance exchanges are aimed at increasing the number who are insured 22 and reducing the costs of care for those who are newly insured.
Those who reported their main reason for not having a USC as “recently moved to area,” “doesn’t know where to go,” “just changed insurance plans,” or “looking for a new doctor” make up an important group of working-age adults who are in a geographic or insurance coverage transition. These reasons were given in 6.8% of responses from those who never had a USC and 15.0% of responses from those who changed their USC. These findings suggest an opportunity for health care insurers to consider developing transition plans to assist current enrollees who change residences and onboarding programs to connect new enrollees with a USC.
Almost two-thirds of the responses from those who never had a USC or who changed their USC indicated that they preferred not to have a USC (“seldom or never sick,” “going different places for different needs,” or “doesn't use doctors/treats self”). These results could help guide policies and programs aimed at decreasing the proportion of adults who never have a USC or change their USC. For example, adults who prefer not to have a USC may not be influenced by efforts aimed at increasing access or reducing barriers to a USC, 18 whereas working-age adults who have never had or who have changed their USC but have preferences for a USC may be influenced by such efforts.
The finding that only 60% of adults consistently had a USC is substantially lower than the 75% prevalence reported by Smith and Bartell. 14 Their study of adults aged ≥18 in 1998 and 1999 assessed continuous access to a USC using a question about changes in USC during the previous 12 months. The results of the present study may differ from theirs because of differences in the samples (working-age adults vs all adults), operationalization of continuous USC (USC captured at 2 points in time vs captured retrospectively), and time periods (2011-2013 vs 1998-1999). The results of the present study suggest a substantial gap between the current state of USC and the Healthy People 2020 goal that 89.4% of working-age adults should have a consistent USC by 2020. 28 Also, the finding that about 20% of adults changed their USC during a 2-year period suggests that reducing the number of adults who lose their USC could be one way to reach this Healthy People 2020 goal.
Several recommendations resulted from this study. First, planning for Healthy People 2030 is currently underway, and the Secretary’s Advisory Committee on National Health Promotion and Disease Prevention Objectives for 2030 might consider adding as an objective a reduction of the 2-year USC turnover rate. This study showed how MEPS longitudinal data could be used to benchmark and monitor this objective. Second, future research might examine whether implementation of the individual mandate provision of the Affordable Care Act has been associated with reductions in the costs of care for those who are newly insured, increases in the number of adults gaining a USC, and reductions in the number of adults losing a USC. Third, if the Affordable Care Act is revoked in whole or in part during the current administration, policies should be put into place to limit the impact that losses in health insurance may have on adults’ access to health care, generally, and USC, specifically.
Limitations
This study was limited in 2 ways. First, data on USC were collected only in 2 waves and during a 2-year period. Although 2 years is a relatively short period, access to a USC still may have changed between waves, which this study may not have captured. Also, some adults may cycle through different USCs frequently, and this group may have different characteristics from the group that changed USCs less frequently. In addition, the short time frame prevented the examination of long-term trends. Second, the study design made it impossible to account for other short-term changes that might have occurred between waves. For example, the study design did not allow for discerning whether an adult changed residences between waves but immediately began seeing a new USC. The study design would have designated this adult as being in the always USC group, missing the fact that the person should have been in the changed USC group. Furthermore, even if this adult had been included in the changed USC group, those who had this type of change may have had different characteristics from those who had lost their USC and not immediately gained a new USC.
Conclusions
Observation of USC during a 2-year period revealed a more nuanced picture than that portrayed by cross-sectional investigations. Policies and programs should be sensitive to addressing the differences between those who change their USC and those who have never had a USC. Additionally, benchmarks to reduce changing USCs should be set and monitored.
Footnotes
Declaration of Conflicting Interests
The author declared no potential conflicts of interest with respect to the research, authorship, and/or publication of this article.
Funding
The author received no financial support for the research, authorship, and/or publication of this article.