
Abstract
Objectives:
In 2012, a consensus document was developed on drug overdose poisoning definitions. We took the opportunity to apply these new definitions to health care administrative data in 4 states. Our objective was to calculate and compare drug (particularly opioid) poisoning rates in these 4 states for 4 selected Injury Surveillance Workgroup 7 (ISW7) drug poisoning indicators, using 2 ISW7 surveillance definitions, Option A and Option B. We also identified factors related to the health care administrative data used by each state that might contribute to poisoning rate variations.
Methods:
We used state-level hospital and emergency department (ED) discharge data to calculate age-adjusted rates for 4 drug poisoning indicators (acute drug poisonings, acute opioid poisonings, acute opioid analgesic poisonings, and acute or chronic opioid poisonings) using just the principal diagnosis or first-listed external cause-of-injury fields (Option A) or using all diagnosis or external cause-of-injury fields (Option B). We also calculated the high-to-low poisoning rate ratios to measure rate variations.
Results:
The average poisoning rates per 100 000 population for the 4 ISW7 poisoning indicators ranged from 11.2 to 216.4 (ED) and from 14.2 to 212.8 (hospital). For each indicator, ED rates were usually higher than were hospital rates. High-to-low rate ratios between states were lowest for the acute drug poisoning indicator (range, 1.5-1.6). Factors potentially contributing to rate variations included administrative data structure, accessibility, and submission regulations.
Conclusions:
The ISW7 Option B surveillance definition is needed to fully capture the state burden of opioid poisonings. Efforts to control for factors related to administrative data, standardize data sources on a national level, and improve data source accessibility for state health departments would improve the accuracy of drug poisoning surveillance.
A steady rise in drug overdose deaths in the United States 1 between 2000 and 2014, and more recent sharp increases in opioid overdoses, 1 has highlighted the public health need to develop drug poisoning indicators to more accurately track the frequency and types of drug poisoning. To address this need and improve surveillance of drug poisoning morbidity and mortality, the Injury Surveillance Workgroup 7 (ISW7), a national expert panel consisting of injury epidemiologists from state health departments, federal agencies, and advocacy groups, developed recommendations for new poisoning surveillance indicators for use with coded hospital and emergency department (ED) data, based on the International Classification of Diseases, Ninth Revision, Clinical Modification (ICD-9-CM) coding system. 2,3 The ISW7 consensus recommendations, released in 2012, included descriptions of 5 indicators related to drug and opioid poisonings. 2
The ISW7 drug poisoning indicators are based on ICD-9-CM diagnosis codes and external cause-of-injury codes (E-codes). These codes are assigned to each medical record after hospital or ED discharge, usually by hospital medical coders and primarily for billing purposes. Diagnosis codes describe the nature of the injury (eg, fracture, contusion), whereas E-codes describe the intent (eg, self-harm, unintentional) and mechanism (eg, motor vehicle, firearm) of the injury.
Because the number of diagnosis and E-code fields populated in health care administrative data varies by state, ISW7 offered 2 surveillance definitions or “options” that can be used to search for each poisoning indicator. The “Option A” definition is quite narrow in scope. It identifies hospital or ED visits for drug poisonings by using only the principal diagnosis field or the first valid E-code field that is populated in the medical record. The “Option B” definition is broader in scope and identifies drug poisoning visits by using any diagnosis code or E-code field that is populated in the record, and it may include patient visits in which drugs are associated with or contribute to a health care event, rather than only those visits for which drugs are the primary reason. 2,3
Previous studies have reported estimates of the rates of drug poisoning and opioid overdoses based on hospital 4 and ED 5 –8 data. However, these studies used national rather than state data sources. Yet, until quite recently, most efforts to curb the opioid epidemic have occurred at the local and state levels, and analyzing and tracking the opioid epidemic within and across states are now especially important. We were able to identify only 1 recent study investigating drug poisoning morbidity indicators at the state level. It found that the ISW7 Option B definition identified 5% more hospital drug poisoning visits than when using Option A. 9
The need to improve state-level surveillance amid the drug overdose epidemic is important, particularly given the recent sharp increase in opioid overdoses. 1,5,6 We sought to develop and compare state-level drug poisoning estimates by using the ISW7 Option A and Option B surveillance definitions in 4 states that were collaborating on injury surveillance improvement projects: Colorado, Massachusetts, North Carolina, and Utah. In these states, we sought to identify 4 selected ISW7 indicators of drug poisoning in hospital and ED health care administrative data sources.
The primary objective of our study was to compare drug poisoning rates across the 4 states and to calculate the proportion of additional cases identified for each drug poisoning indicator when the broader Option B definition was used instead of Option A. A secondary objective was to identify factors related to the health care administrative data used by each state that might contribute to variations among these states in poisoning rates and to then attempt to control for some of these factors in our analysis.
Methods
For this analysis, we developed and used a common surveillance protocol to ensure analytic consistency across all 4 states. For our calculations, we included only hospital and ED visits that were to acute care hospitals, involved a discharge date in 2012, and were made by in-state residents. We included all patient dispositions (including deaths), although we excluded patients who were initially admitted to the ED and then later admitted to the hospital to avoid double counting.
In each state, we used both ISW7 Option A and Option B surveillance definitions to identify 4 selected drug and opioid poisoning morbidity indicators in hospital and ED health care administrative data, including all 3 ISW7 opioid poisoning indicators and 1 broad ISW7 all-drug poisoning indicator. The 4 indicators (and their shortened versions) were as follows: (1) acute poisonings due to the effects of drugs (acute drug poisonings); (2) acute drug poisonings associated with the effects of opium, heroin, or opioid analgesics (acute opioid poisonings); (3) acute drug poisonings associated with the effects of opioid analgesics (acute opioid analgesic poisonings); and (4) acute or chronic poisonings associated with the effects of opium, heroin, and opioid analgesics (acute or chronic opioid poisonings) (Table 1).
Selected drug poisoning indicators and surveillance definitions based on ISW7a recommendations, applied to health administrative data from Colorado, Massachusetts, North Carolina, and Utah, 2012
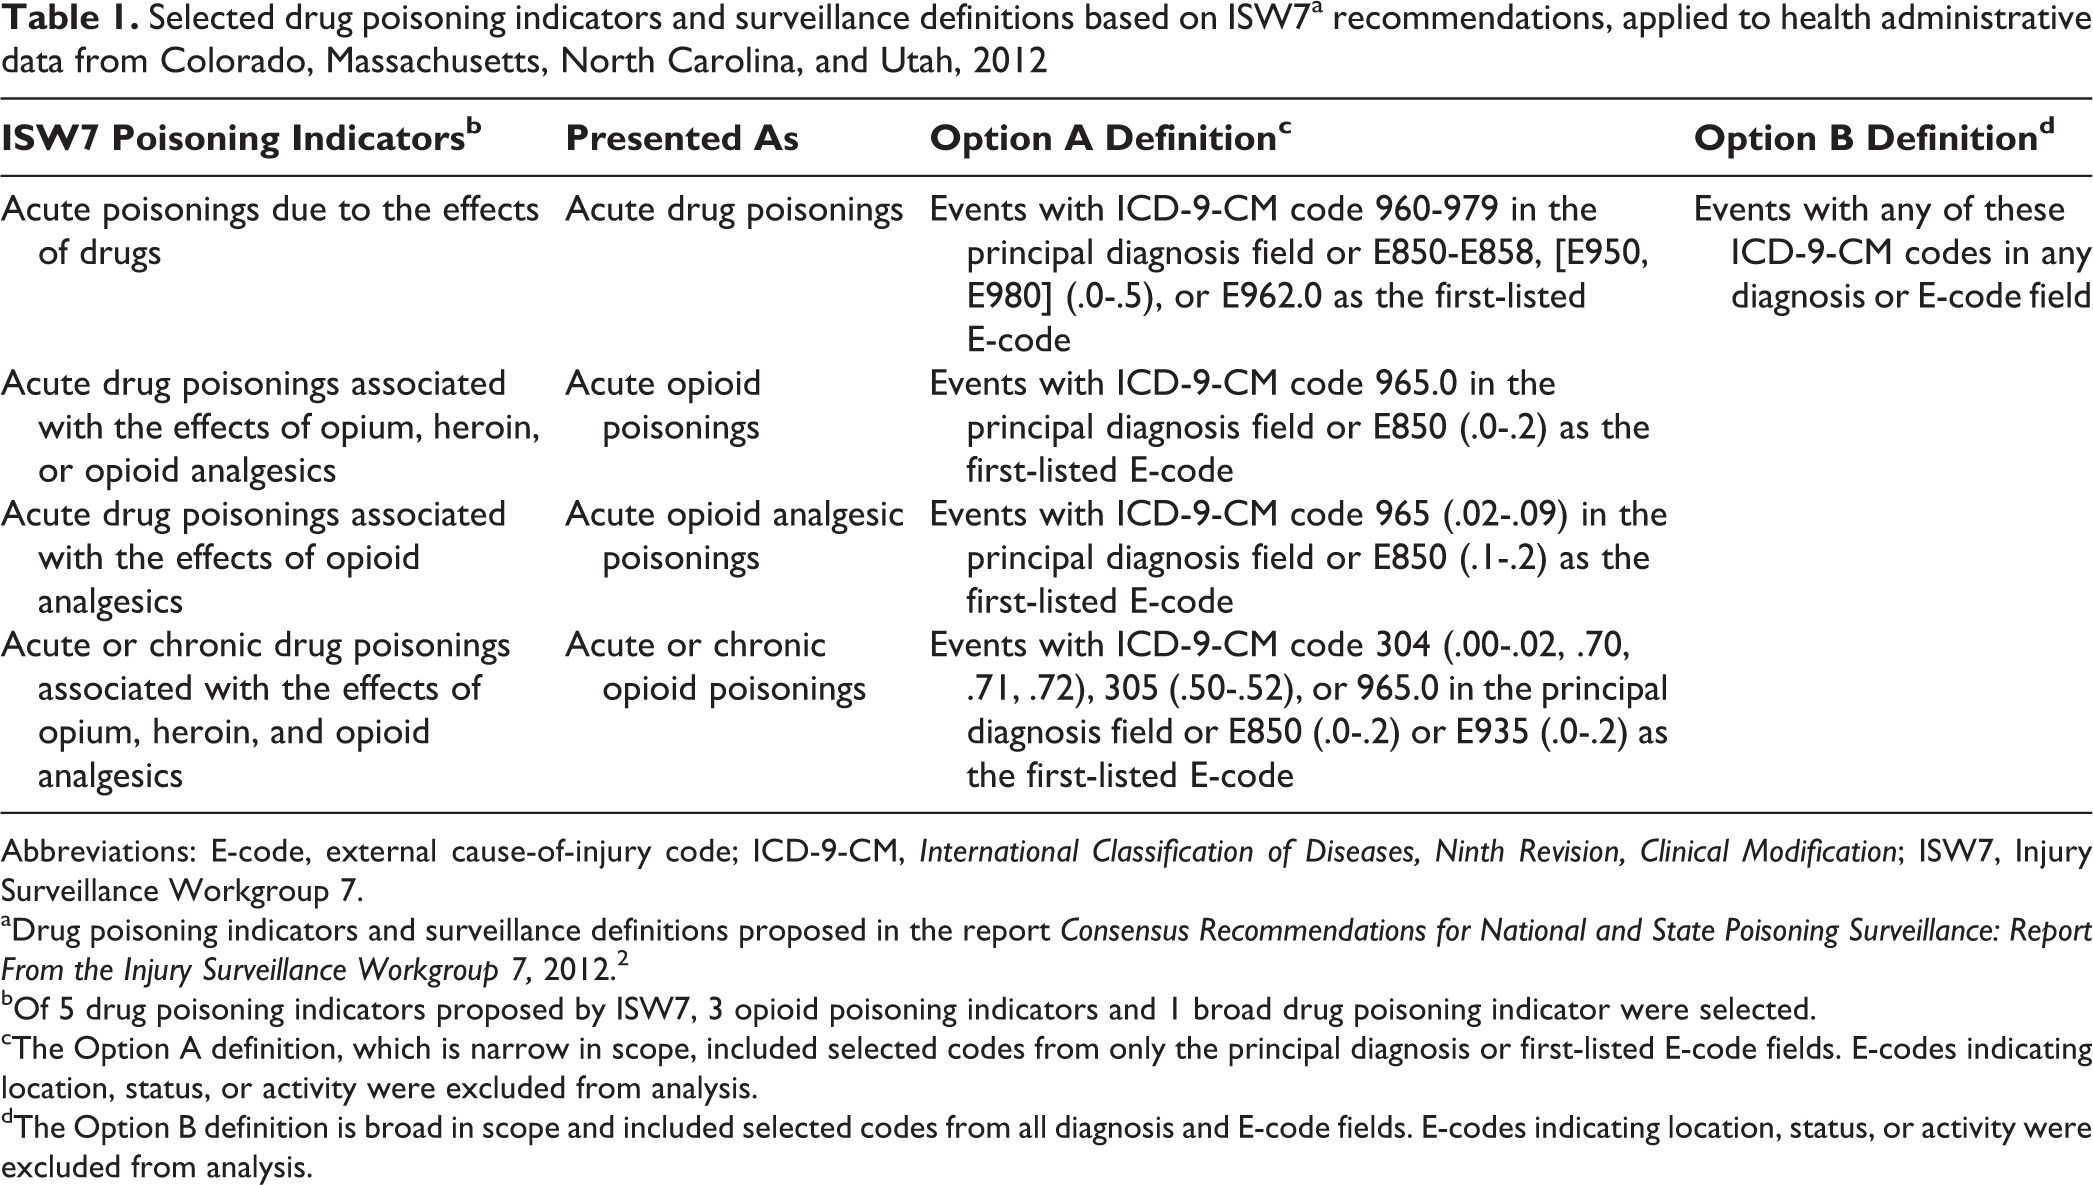
Abbreviations: E-code, external cause-of-injury code; ICD-9-CM, International Classification of Diseases, Ninth Revision, Clinical Modification; ISW7, Injury Surveillance Workgroup 7.
aDrug poisoning indicators and surveillance definitions proposed in the report Consensus Recommendations for National and State Poisoning Surveillance: Report From the Injury Surveillance Workgroup 7, 2012. 2
bOf 5 drug poisoning indicators proposed by ISW7, 3 opioid poisoning indicators and 1 broad drug poisoning indicator were selected.
cThe Option A definition, which is narrow in scope, included selected codes from only the principal diagnosis or first-listed E-code fields. E-codes indicating location, status, or activity were excluded from analysis.
dThe Option B definition is broad in scope and included selected codes from all diagnosis and E-code fields. E-codes indicating location, status, or activity were excluded from analysis.
The Option A surveillance definitions for the 4 indicators included searching for selected diagnosis codes from only the principal diagnosis and first-listed E-code fields in the database records (Table 1). The hospital and ED records from all states except Colorado had a designated field, separate from the other ICD-9-CM code fields, for this primary E-code. We used the first-listed E-code regardless of whether it was for a traumatic injury or for a poisoning. If the principal E-code field contained E-codes that were not considered valid according to definitions provided by the Centers for Disease Control and Prevention, 10 such as place of location of the injury (E8490-E8499) or activity patient was engaged in at the time of injury (E000-E30), we dropped these codes and replaced them with the next available valid E-code.
The Option B surveillance definitions for the 4 indicators included searching for selected diagnosis codes from all available diagnosis and E-code fields in the database records (Table 1). Because the number of diagnosis and E-code fields available in the health care administrative data varied by state, we made an effort, when possible, to control for this and standardize the search process by limiting the number of fields used for surveillance to the same minimum number of fields that were available in all states.
For ED data, we used the first 6 diagnosis codes and the first 6 valid E-codes listed in records (including the designated E-code field, if available) to identify visits for drug poisonings, because this number of fields was the minimum available in the data sources of all 4 states. For hospital data, we were able to use the first 9 diagnosis codes listed in records in all states. However, whereas 3 of the states had at least 6 E-code fields that could be searched in their hospital data sources, the North Carolina data source provided access to only 1 E-code field for hospital data. Thus, our investigators in North Carolina were provided access to a standard but somewhat limited dataset for this study, despite the existence of more E-code fields in North Carolina’s hospital administrative database. In addition, our investigators in Colorado had access in their hospital and ED diagnosis code data to “injury” codes only (ie, ICD-9-CM codes 800-999). Because these codes did not include diagnosis codes for drug abuse or dependence, we were unable to calculate acute or chronic opioid poisoning rates in either hospital or ED data for Colorado.
In each state, we analyzed data using either SAS version 9.3 11 or SPSS version 22. 12 We calculated age-adjusted rates per 100 000 population using the direct method of adjustment for each of the 4 ISW7 poisoning indicators in each state. Each state used 2012 postcensal population estimates 13,14 and calculated age-adjusted rates using age-specific US 2000 standard population weights. 15 We calculated rates separately for each definition type (Option A and Option B) and treatment site (hospital and ED). In addition, we calculated high-to-low rate ratios, which we defined as the ratio of the highest state rate to the lowest state rate for each poisoning indicator at each treatment site; these rate ratios were used to show the variations in age-adjusted poisoning rates among states for the 4 poisoning indicators. Finally, we calculated the differences in drug poisoning visits identified when using Option B instead of Option A, using the following formula to obtain the percentage of additional visits captured by using Option B: (Option B – Option A)/Option A × 100. Each state obtained an exemption from review from its institutional review board (IRB): Massachusetts Department of Public Health IRB (Massachusetts), Colorado Department of Public Health and Environment IRB (Colorado), North Carolina Department of Health and Human Services IRB (North Carolina), and Utah Department of Health IRB (Utah).
Results
Rate ratios differed by surveillance definition (Option A vs Option B) and treatment site (hospital vs ED) by varying degrees (Table 2). Among the 4 poisoning indicators, the acute drug poisonings indicator (range, 1.5-1.6) and the acute opioid analgesic poisonings indicator (range, 1.6-1.8) had the smallest rate ratios, and these ratios varied minimally by surveillance definition and treatment site (Table 2). The acute or chronic opioid poisonings indicator had the largest rate ratios (range, 2.0-3.5), and these ratios varied substantially by both surveillance definition and treatment site. That is, the rate ratios for this particular indicator for the Option A definition (range, 2.4-3.5) were generally substantially larger than were the ratios for the Option B definition (range, 2.0-2.8), and the rate ratios for ED visits (range, 2.8-3.5) were substantially larger than were the ratios for hospitalizations (range, 2.0-2.4).
Selected ISW7 drug poisoning indicatora counts and age-adjusted ratesb for Colorado, Massachusetts, North Carolina, and Utah, by surveillance definition and treatment site, 2012
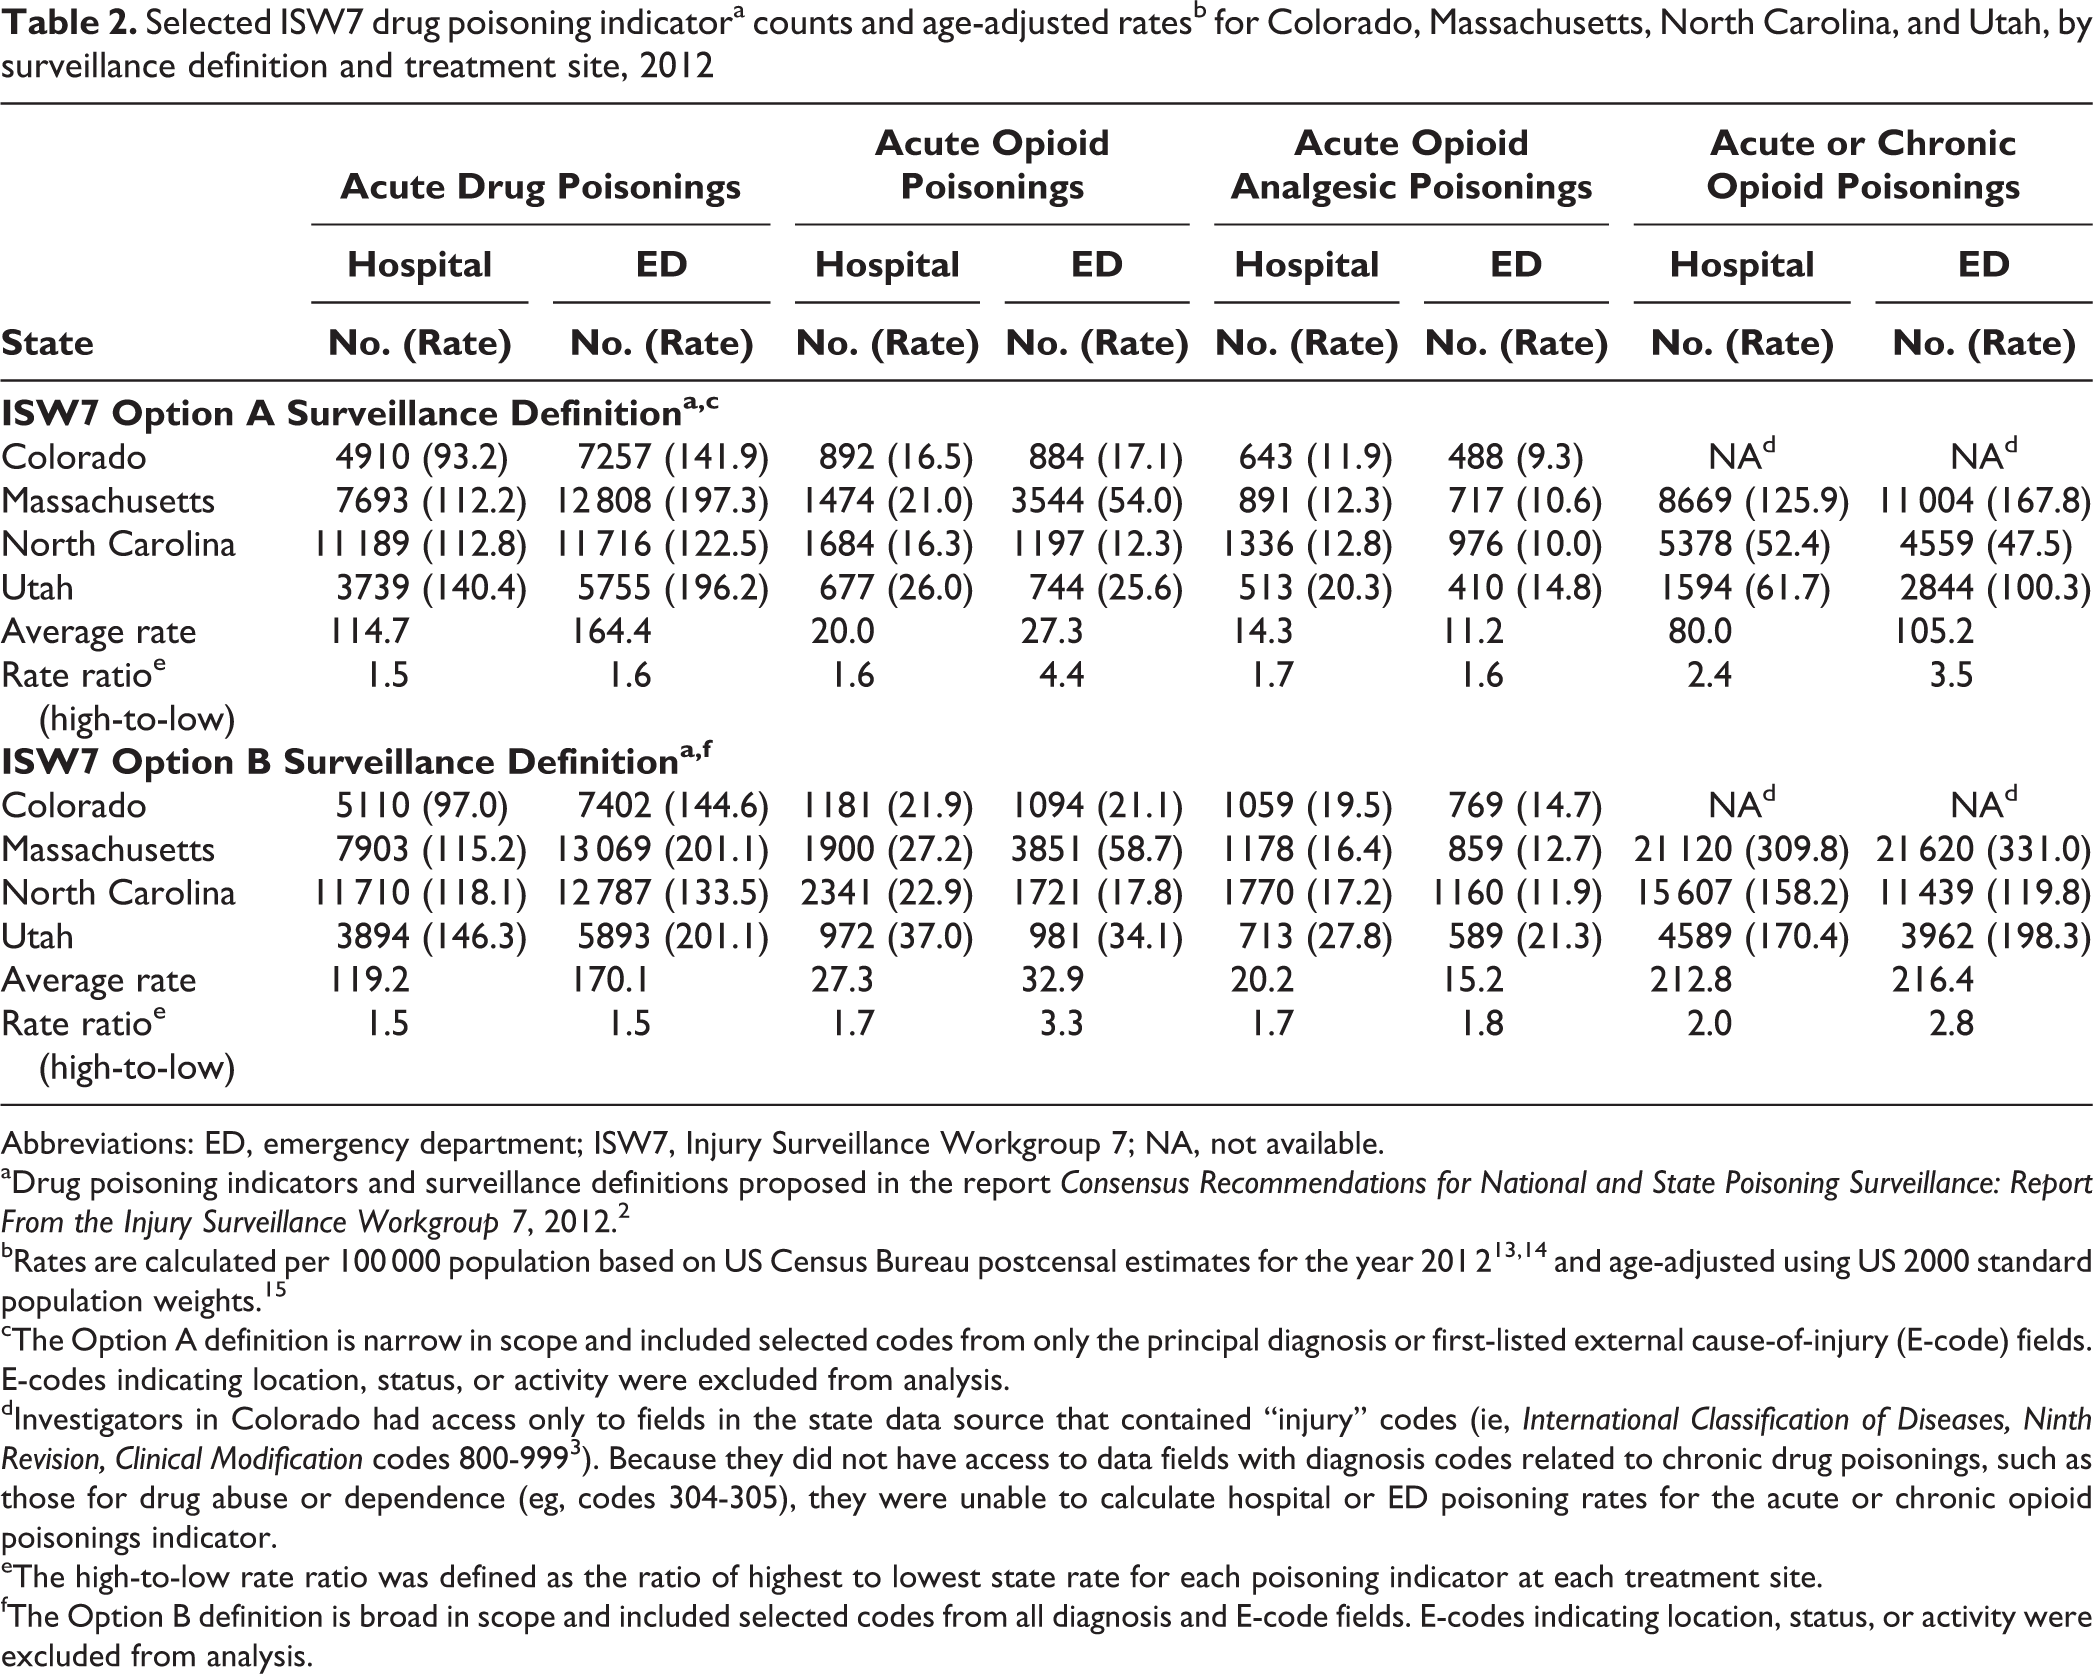
Abbreviations: ED, emergency department; ISW7, Injury Surveillance Workgroup 7; NA, not available.
aDrug poisoning indicators and surveillance definitions proposed in the report Consensus Recommendations for National and State Poisoning Surveillance: Report From the Injury Surveillance Workgroup 7, 2012. 2
bRates are calculated per 100 000 population based on US Census Bureau postcensal estimates for the year 201 2 13 , 14 and age-adjusted using US 2000 standard population weights. 15
cThe Option A definition is narrow in scope and included selected codes from only the principal diagnosis or first-listed external cause-of-injury (E-code) fields. E-codes indicating location, status, or activity were excluded from analysis.
dInvestigators in Colorado had access only to fields in the state data source that contained “injury” codes (ie, International Classification of Diseases, Ninth Revision, Clinical Modification codes 800-999 3 ). Because they did not have access to data fields with diagnosis codes related to chronic drug poisonings, such as those for drug abuse or dependence (eg, codes 304-305), they were unable to calculate hospital or ED poisoning rates for the acute or chronic opioid poisonings indicator.
eThe high-to-low rate ratio was defined as the ratio of highest to lowest state rate for each poisoning indicator at each treatment site.
fThe Option B definition is broad in scope and included selected codes from all diagnosis and E-code fields. E-codes indicating location, status, or activity were excluded from analysis.
In addition, the rate ratios for the fourth indicator, acute opioid poisonings, varied substantially by treatment site but less so by surveillance definition (Table 2). That is, the rate ratios for this indicator for ED visits (4.4 for Option A and 3.3 for Option B) were substantially larger than were the rate ratios for hospitalizations (1.6 for Option A and 1.7 for Option B). Finally, among the 4 poisoning indicators, the high-to-low rate ratios for hospitalizations for the acute drug poisonings, acute opioid poisonings, and acute opioid analgesic poisonings indicators were all similar, including by Option A and Option B surveillance definitions.
Average poisoning rates for the 4 ISW7 poisoning indicators were generally higher in ED visits than in hospitalizations, with the exception of the acute opioid analgesic poisonings indicator, for which the average rates were higher in hospitalizations (Option A: 14.3 per 100 000 population; Option B: 20.2 per 100 000 population) than in ED visits (Option A: 11.2 per 100 000 population; Option B: 15.2 per 100 000 population) (Table 2). Of the 4 states, Massachusetts had a noticeably higher rate of acute opioid poisonings in the ED (54.0 per 100 000 population) than in the other 3 states.
In all 4 states, and among both hospitals and EDs, the Option B surveillance definition identified more drug poisoning visits than the Option A definition did. However, the extent of this difference varied among the 4 drug poisoning indicators. Option B identified, on average, only 4% more acute drug poisoning visits than did Option A in both hospitalizations (n = 272) and ED visits (n = 404) (Table 3). However, for acute opioid poisonings and acute opioid analgesic poisonings, Option B identified an average of 20% to 30% more ED visits (n = 320 and n = 197, respectively) and 35% to 40% more hospitalizations (n = 417 and n = 334, respectively) than did Option A. These differences were even greater for acute or chronic opioid poisonings, for which Option B identified, on average, 101% more ED visits (n = 6205) and 164% more hospital visits (n = 8558) than did Option A. The proportions of additional visits identified by Option B definitions relative to Option A definitions tended to be roughly consistent across all 4 states.
Additional drug poisoning hospitalizations and ED visits identified when using ISW7 Option B instead of Option A surveillance definitions,a Colorado, Massachusetts, North Carolina, and Utah, 2012
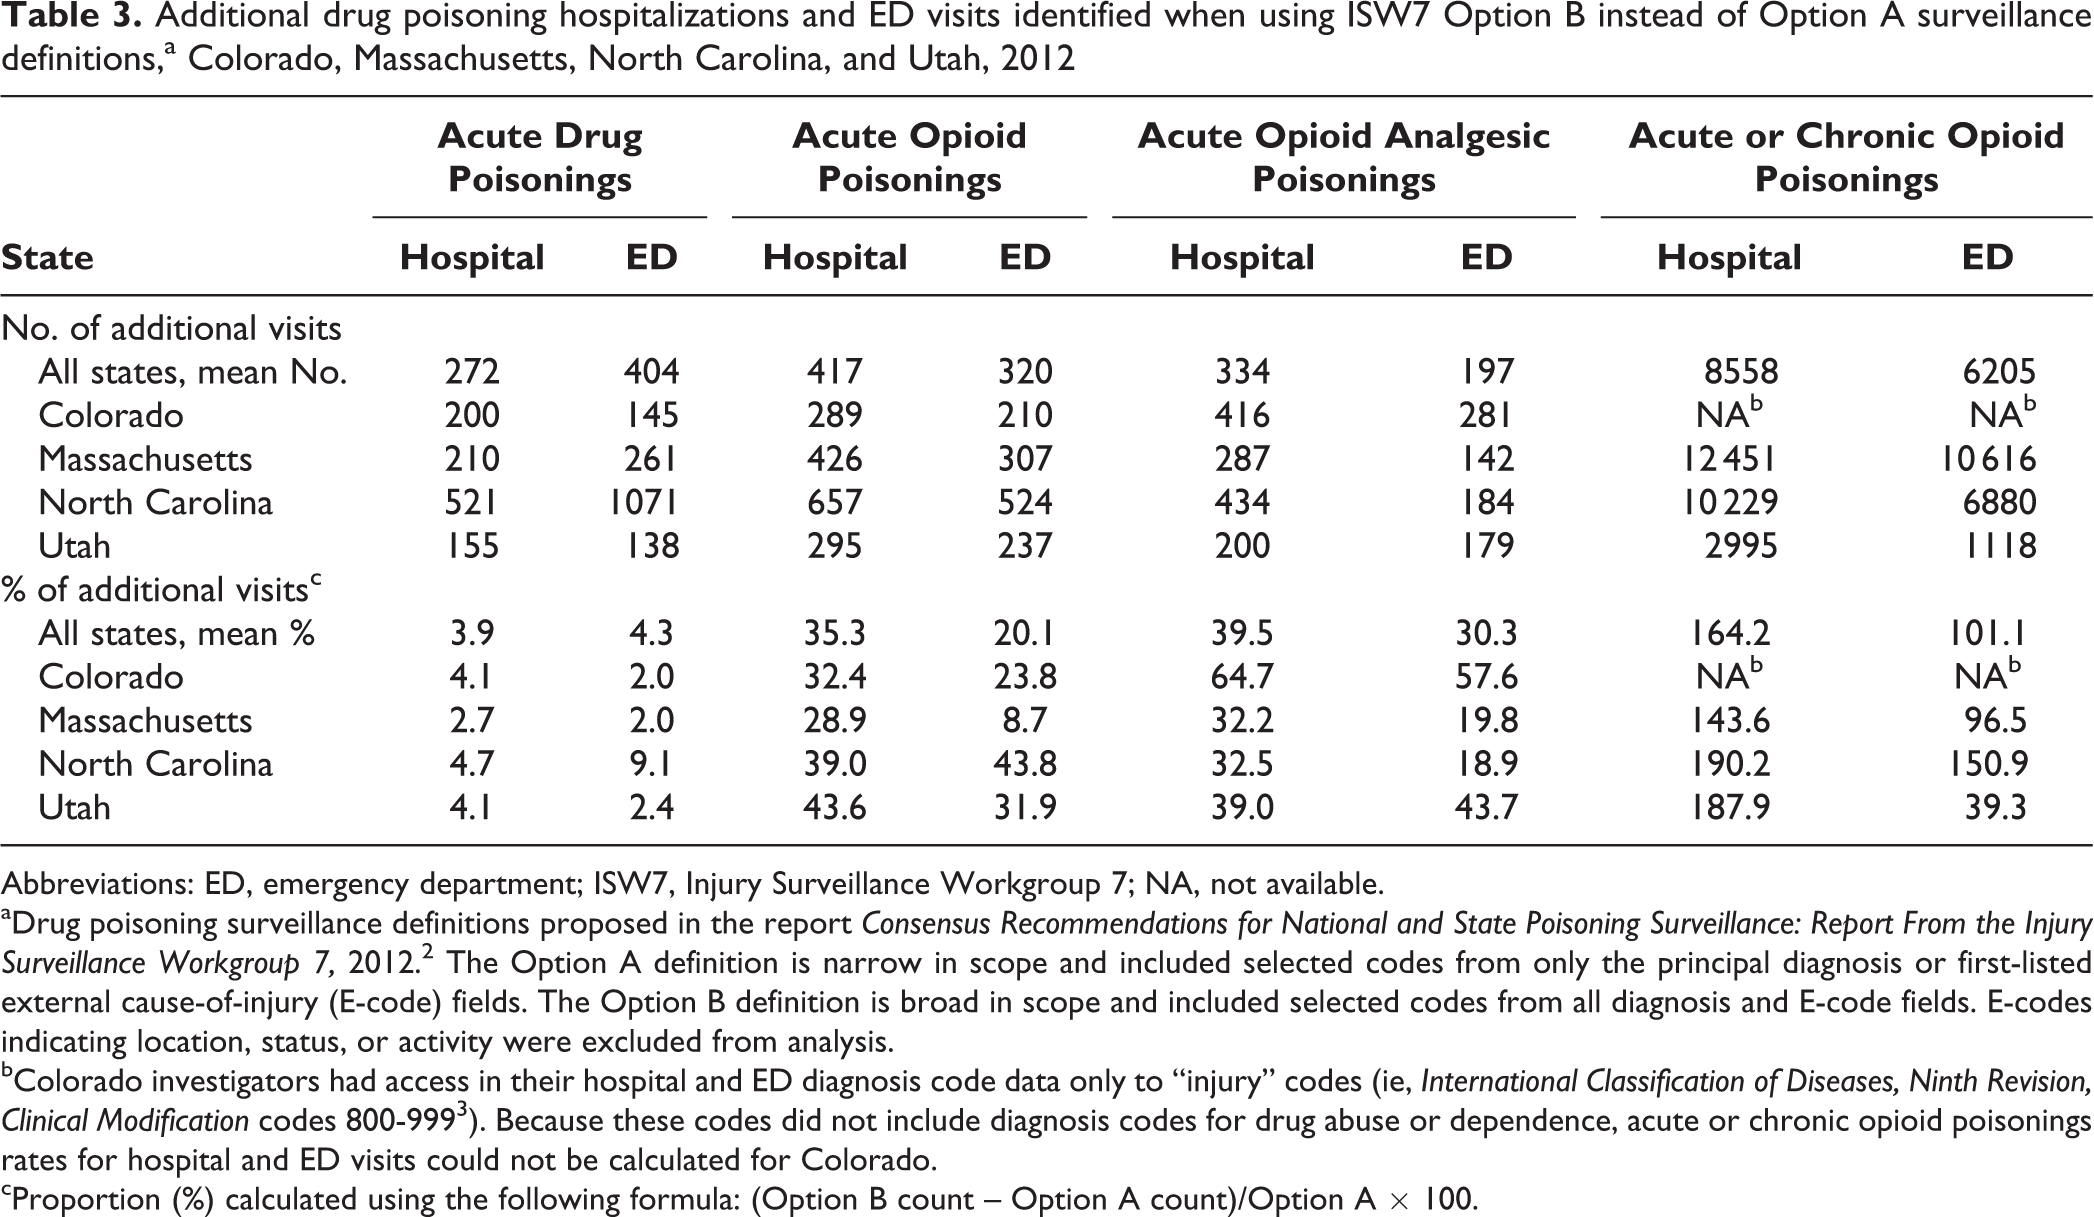
Abbreviations: ED, emergency department; ISW7, Injury Surveillance Workgroup 7; NA, not available.
aDrug poisoning surveillance definitions proposed in the report Consensus Recommendations for National and State Poisoning Surveillance: Report From the Injury Surveillance Workgroup 7, 2012. 2 The Option A definition is narrow in scope and included selected codes from only the principal diagnosis or first-listed external cause-of-injury (E-code) fields. The Option B definition is broad in scope and included selected codes from all diagnosis and E-code fields. E-codes indicating location, status, or activity were excluded from analysis.
bColorado investigators had access in their hospital and ED diagnosis code data only to “injury” codes (ie, International Classification of Diseases, Ninth Revision, Clinical Modification codes 800-999 3 ). Because these codes did not include diagnosis codes for drug abuse or dependence, acute or chronic opioid poisonings rates for hospital and ED visits could not be calculated for Colorado.
cProportion (%) calculated using the following formula: (Option B count – Option A count)/Option A × 100.
We also identified differences in the accessibility, submission regulations, and structure of the health care administrative data that each state used for this surveillance process (Table 4). These differences could have impaired the uniformity of our study results and the ability to accurately compare these results across the 4 states. The states differed in the degree of access health departments had to health care administrative data, the types of health care facilities submitting data, the number of diagnosis and E-code fields available in hospital and ED data, whether E-code submissions by hospitals and EDs were mandated by the state, whether there were designated E-code fields in the hospital and ED data, and the completeness of hospital and ED injury E-coding.
Factors related to state health care administrative data that potentially contributed to variations in drug poisoning rates in Colorado, Massachusetts, North Carolina, and Utah, 2012
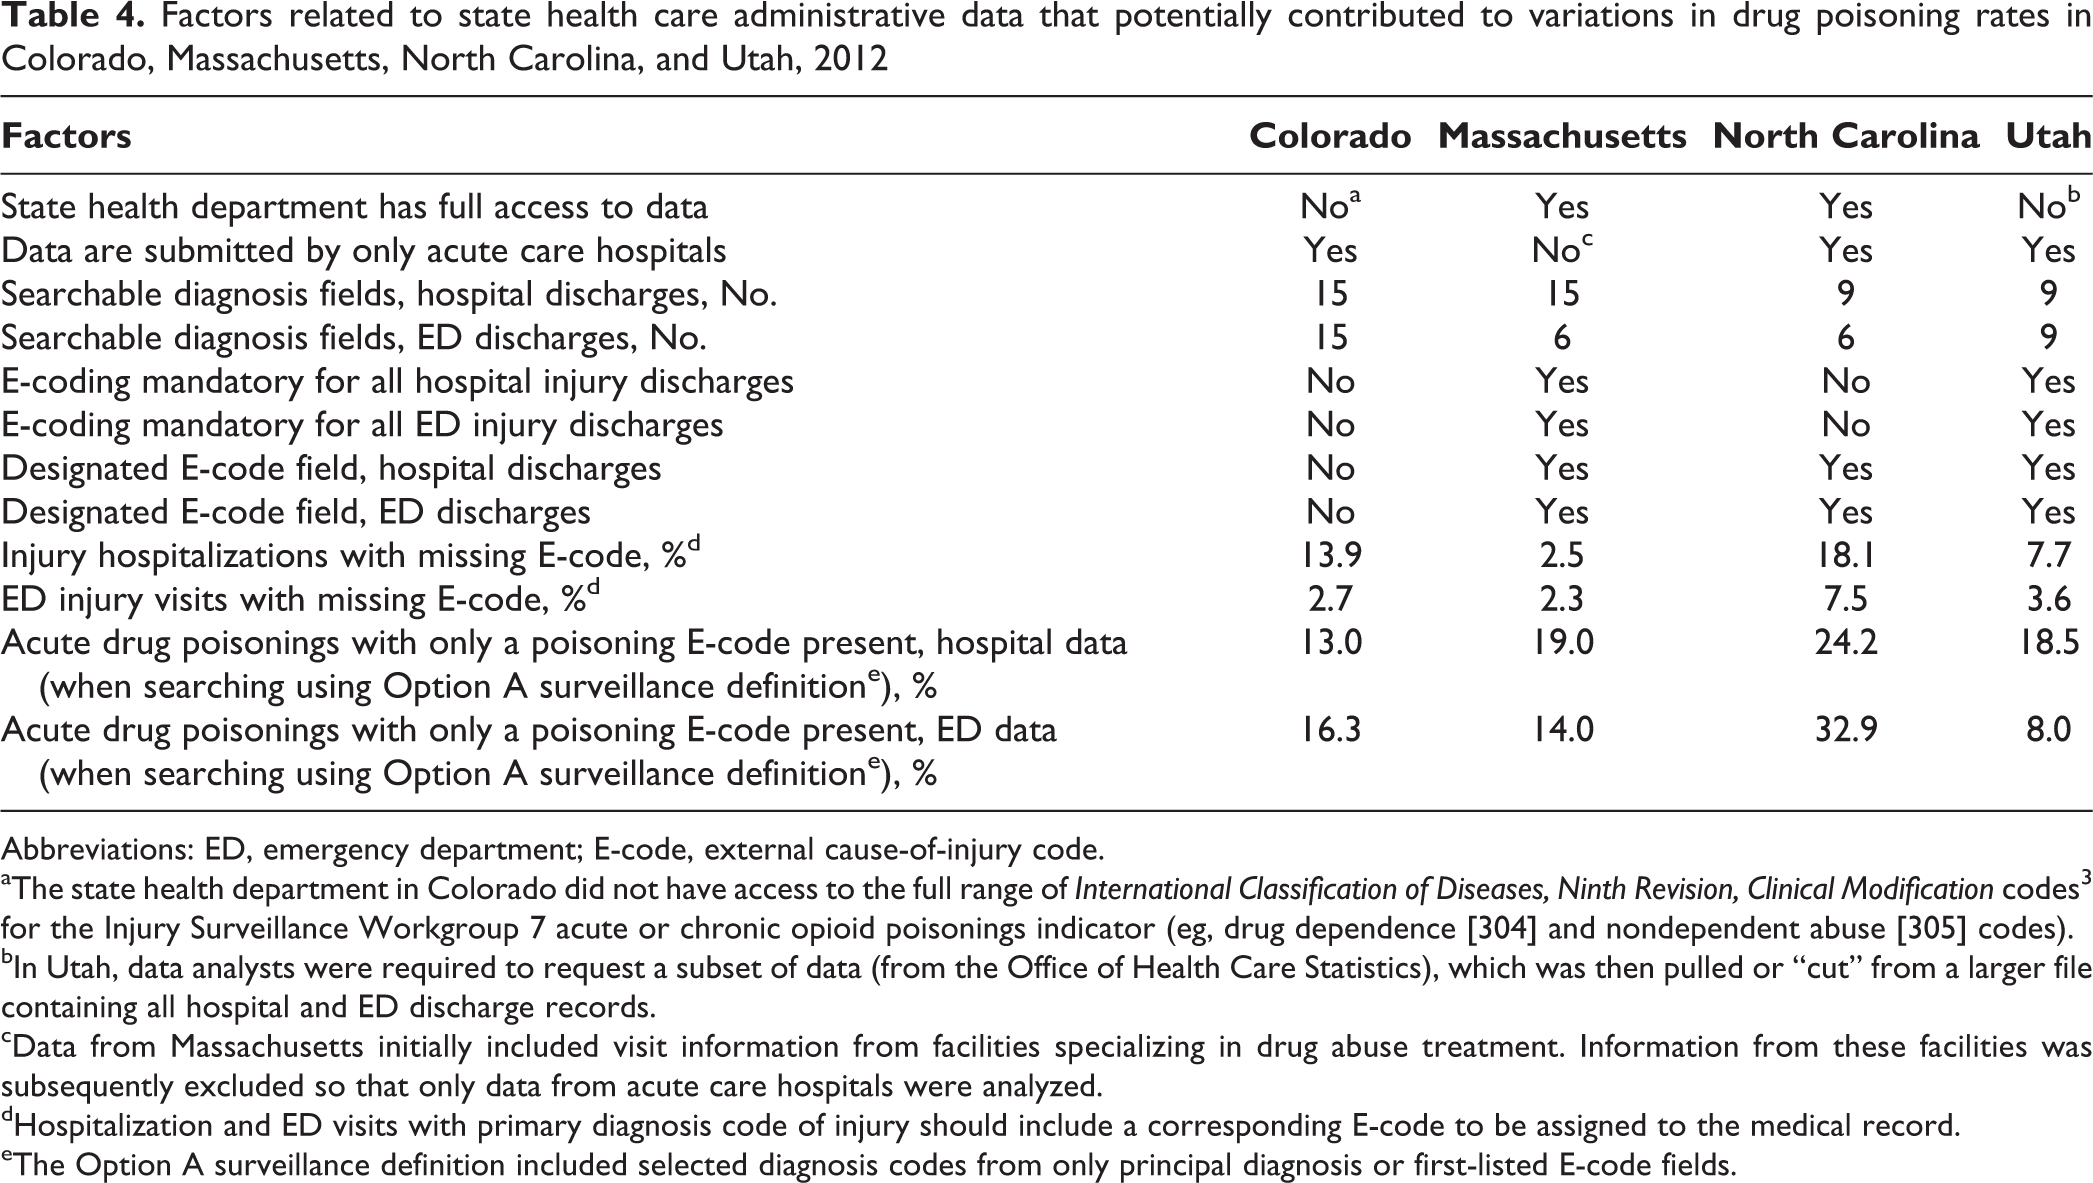
Abbreviations: ED, emergency department; E-code, external cause-of-injury code.
aThe state health department in Colorado did not have access to the full range of International Classification of Diseases, Ninth Revision, Clinical Modification codes 3 for the Injury Surveillance Workgroup 7 acute or chronic opioid poisonings indicator (eg, drug dependence [304] and nondependent abuse [305] codes).
bIn Utah, data analysts were required to request a subset of data (from the Office of Health Care Statistics), which was then pulled or “cut” from a larger file containing all hospital and ED discharge records.
cData from Massachusetts initially included visit information from facilities specializing in drug abuse treatment. Information from these facilities was subsequently excluded so that only data from acute care hospitals were analyzed.
dHospitalization and ED visits with primary diagnosis code of injury should include a corresponding E-code to be assigned to the medical record.
eThe Option A surveillance definition included selected diagnosis codes from only principal diagnosis or first-listed E-code fields.
Discussion
To our knowledge, this report is the first multistate assessment of ISW7 drug poisoning indicators. For the most part, these poisoning rates varied substantially according to the surveillance definition (Option A or Option B), treatment site (hospital or ED), and poisoning indicator used. Poisoning rates also varied among states, but we identified factors that may have reduced the accuracy of our state-to-state comparisons, despite our efforts to control for some of them.
For 3 of the 4 ISW7 indicators—acute drug poisonings, acute opioid poisonings, and acute opioid analgesic poisonings—poisoning rates for hospitalizations did not vary much from state to state (with high-to-low rate ratios of ≤1.8). For acute drug poisonings and acute opioid analgesic poisonings, rates for ED visits also did not vary much from state to state, but for acute opioid poisonings, rates varied substantially (rate ratio range, 3.3-4.4). This variation probably resulted from the high rate of acute opioid poisonings in EDs in Massachusetts (2 to 4 times higher than rates in other states). Upon further investigation, we found that most acute opioid poisonings in Massachusetts were related to heroin overdoses. We also discovered that patients with heroin overdoses were more likely than those with opioid analgesic overdoses to be treated and released from the ED. These findings suggest that the use of the acute opioid poisonings indicator along with a drug poisoning indicator specific to heroin might help improve the accuracy of state-to-state comparisons, particularly for drug poisonings in the ED.
As expected, the Option A surveillance definition, which used only the principal diagnosis code or first-listed E-code, identified substantially fewer patients with drug poisonings than did the broader Option B definition. The additional cases identified by Option B held for both hospitalizations and ED visits and for all drug poisoning indicators except acute drug poisonings. For acute drug poisonings, the Option B definition identified only an average of 4% more poisonings than the Option A definition did, suggesting that codes for acute drug poisonings were most often listed in either the principal diagnosis or first-listed E-code field of both hospital and ED records. Our findings agree with those of a report from Kentucky, in which the Option B definition captured 5% more drug poisoning hospitalizations than did the Option A definition. 9
When compared with the Option A definition and using either the acute opioid poisonings or acute opioid analgesic poisonings indicators, the Option B definition identified a range of averages of 20% to 40% more drug poisonings in both hospital and ED data. Codes for these indicators were less often listed in the principal diagnosis and first-listed E-code fields, perhaps because the first-listed diagnosis and E-code fields were being used for another drug (ie, multiple drug poisonings) or the poisoning was not the primary reason for the treatment visit. The potential undercount using Option A provides a strong argument for the use of Option B definitions, particularly if the goal is to identify all acute opioid poisonings. Option B also identified a range of averages of 101% to 164% more poisonings in both hospital and ED data when using the acute or chronic opioid poisonings indicator. This finding is not surprising given that diagnosis codes for the chronic conditions of opioid abuse and dependence are more likely to be assigned to a secondary diagnosis field than to the principal diagnosis field. This finding supports the use of Option B definitions when attempting to establish the full burden of both acute and chronic opioid poisonings.
One obstacle in our attempt to use the Option B definition uniformly across the states was that the number of available diagnosis and E-code fields in each state’s health care administrative data varied. For ED data, we were able to control for these differences by determining the minimum number of available fields in the records of all states and then searching only that minimum number of fields in each state’s database. For hospital data, we were unable to choose a minimum number of fields across states because North Carolina’s hospital data contained only a single E-code field. The remaining 3 states used 6 E-code fields, the minimum number available to them. Although all US hospitals submit data in a standardized form for federal reimbursement, we found that the form of data submitted to states for health care administrative purposes varied, likely as a result of different state submission requirements.
On a similar note, we developed a list of other substantial differences between states related to health care administrative data used for our surveillance process. These differences are likely to have affected the poisoning rates in each state and, thus, the comparability of these rates among states. Establishing national standards for state-level hospital administrative data submission, including specifying the types of facilities that would submit data and requiring a certain number of diagnosis and E-code fields in the data, would improve the comparability of datasets across states and increase their utility for public health surveillance. In addition, based on items on our list that may have contributed to underreporting of drug poisoning in some states, a number of additional changes, if implemented, might provide more accurate and comparable results. These changes include state-mandated use of designated E-codes fields and of E-coding for all hospital and ED discharges, as well as broad access for state health departments to all health care administrative data. For now, public health professionals working on state-level drug poisoning surveillance or research should be aware of some of these potential limitations of their data.
Limitations
This retrospective study had several limitations. First, limiting the number of diagnosis fields used in the Option B definition may have led to an undercount of the actual number of hospitalizations for drug poisoning. Investigators in Colorado and Massachusetts attempted to estimate the extent of this potential undercount by also searching 15 diagnosis fields in their hospital records. However, they found that compared with the use of the first 9 diagnosis fields, the use of 15 diagnostic fields captured only 1% to 5% additional poisonings across all 4 indicators. Therefore, limiting the number of diagnosis fields to 9 had limited impact on the hospital poisoning rates found in our analysis. Second, although we were able to generate a list of items related to health care administrative data that varied by state and may have caused differences between these states in their poisoning rate results, we were unable to assess the extent to which each item may have affected these poisoning rate results. Finally, the ISW7 poisoning indicators used in this study were defined by ICD-9-CM codes. In October 2015, the US health care system transitioned from using ICD-9-CM to using International Classification of Diseases, Tenth Revision, Clinical Modification (ICD-10-CM) codes. In ICD-10-CM, poisonings are coded by combining the diagnosis and external cause-of-injury codes into a single new code, so that E-codes for poisoning will no longer be required. Even so, it is likely that some of the other health care administrative data factors that we identified as influencing state-to-state comparability in our study, such as the number of searchable diagnosis code fields and the types of facilities submitting data, will continue to be relevant under this new coding system. Future studies based on ICD-10-CM codes will be needed to reassess poisoning indicators and their comparability.
Conclusions
Given the current epidemic of drug overdoses in the United States, it is critical that public health surveillance systems be able to accurately measure and compare drug poisoning morbidity and mortality rates, both within and among states. Although the ISW7 Option A definitions for drug poisonings captured data on the most pertinent visits, the Option B definitions captured a substantially larger proportion. This finding suggests that it is necessary to use the ISW7 Option B surveillance definition if the goal is to fully capture all data on drug poisonings, and particularly opioid poisonings, in both hospital and ED settings. Several factors related to the health care administrative data itself, and unrelated to the actual incidence of drug poisonings, may affect poisoning rate results and comparability among states. Efforts to control for these factors when comparing states, to standardize data sources on a national level, and to improve data source access for state health departments would improve the accuracy of drug poisoning surveillance both within and among states.
Footnotes
Acknowledgments
The authors thank Holly Hackman, MD, MPH, senior epidemiologist, Massachusetts Department of Public Health (now senior research scientist, Injury Prevention Center, Boston Medical Center), for initiating this multistate analysis. The contents of this article are solely the responsibility of the authors and do not necessarily represent the official view of the Centers for Disease Control and Prevention.
Declaration of Conflicting Interests
The authors declared no potential conflicts of interest with respect to the research, authorship, and/or publication of this article.
Funding
The authors disclosed receipt of the following financial support for the research, authorship, and/or publication of this article: This work was supported by Centers for Disease Control and Prevention grant/cooperative agreement #5U17/CE002011-2016.