
Abstract
Objectives:
Accurate data on immunization coverage levels are essential to public health program planning. Reliability of coverage estimates derived from immunization information systems (IISs) in states where immunization reporting by medical providers is not mandated by the state may be compromised by low rates of participation. To overcome this problem, data on coverage rates are often acquired through random-digit-dial telephone surveys, which require substantial time and resources. This project tested both the reliability of voluntarily reported IIS data and the feasibility of using these data to estimate regional immunization rates.
Methods:
We matched telephone survey records for 553 patients aged 19-35 months obtained in 2013 to 430 records in the San Diego County IIS. We assessed concordance between survey data and IIS data using κ to measure the degree of nonrandom agreement. We used multivariable logistic regression models to investigate differences among demographic variables between the 2 data sets. These models were used to construct weights that enabled us to predict immunization rates in areas where reporting is not mandated.
Results:
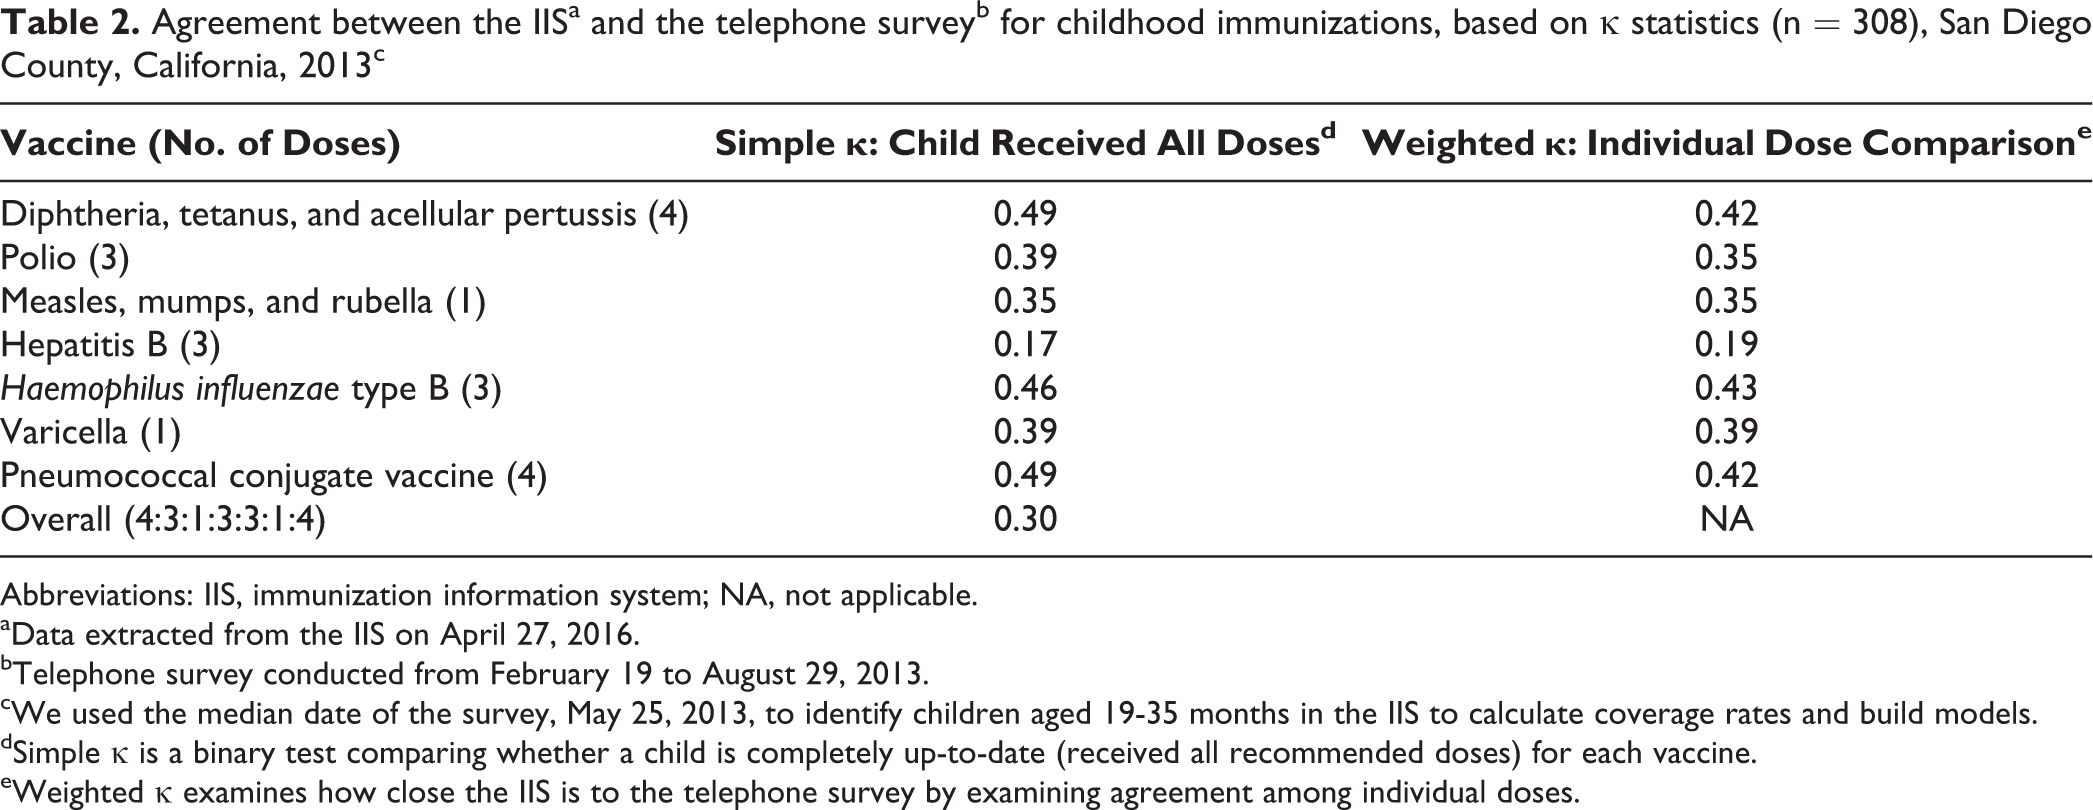
We found moderate agreement between the telephone survey and the IIS for the diphtheria, tetanus, and acellular pertussis (κ = 0.49), pneumococcal conjugate (κ = 0.49), and Haemophilus influenzae type b (κ = 0.46) vaccines; fair agreement for the varicella (κ = 0.39), polio (κ = 0.39), and measles, mumps, and rubella (κ = 0.35) vaccines; and slight agreement for the hepatitis B vaccine (κ = 0.17).
Conclusions:
Consistency in factors predicting immunization coverage levels in a telephone survey and IIS data confirmed the feasibility of using voluntarily reported IIS data to assess immunization rates in children aged 19-35 months.
Accurate, timely data on immunization coverage levels are essential for public health program planning and practice. 1 Coverage rates are used to determine the proportion of a population that is up-to-date on immunizations, identify groups at risk of vaccine-preventable diseases, monitor progress toward coverage targets, promote efforts to increase coverage, and assess the efficacy of prevention efforts. 1 Immunization rates are currently estimated in health care clinics through the Centers for Disease Control and Prevention’s Assessment, Feedback, Incentives, and eXchange program. 2,3 Rates are also assessed with retrospective school audits or surveys 4 ; surveys of the general population for population-based coverage rates, as used by the National Immunization Survey 5 ; and strategy-specific methods, such as those detailed in the American Immunization Registry Association’s “Analytic Guide for Assessing Vaccination Coverage Using an IIS.” 6
The use of IISs and other electronic medical records to estimate community immunization coverage is of growing interest in the public health field. 7 –10 Of 53 jurisdictions in the United States surveyed in 2012, 11 31 (58.5%) mandated at least 1 type of entity to report immunizations to their immunization information system (IIS). 12 Twenty-two (41.5%) jurisdictions, however, had no mandate to report immunizations. 11 California law does not require medical providers to report immunizations to their IIS, which currently limits the ability to estimate immunization coverage rates. One drawback to registry data in states that do not mandate reporting is that the data lack complete population information and may not provide reliable estimates of vaccination coverage. Because California does not mandate reporting of immunizations, methods must be developed to adjust registry data to represent the overall population so that accurate regional or state vaccine coverage rates can be calculated.
Despite the potential for using registries, published reports on registry data focus only on adolescent immunization coverage in states where all medical providers are mandated to report. 13,14 Efforts in Canada 15 and Europe 16 show how registries can be used for immunization surveillance and to identify disparities among underserved populations, which has led to interventions to address these disparities. 13 –16
Immunization coverage rates are often estimated through random-digit-dial telephone surveys, which are costly, vary in timeliness, and may not be generalizable to the entire country. The growing availability of electronic data, including data from medical providers participating in the Centers for Medicare & Medicaid Services’ Electronic Health Record Incentive Program, presents opportunities for submitting data electronically to regional immunization registries. 12,17,18 Such initiatives 18,19 have increased participation in IISs by hospitals and clinics nationally. For example, the San Diego IIS increased its population coverage by 40 415 records for children aged 19-35 months, and >100 health care clinics either joined or were in the process of submitting data to the IIS from 2010 to 2015. This new availability of electronic data, especially when difficulties in telephone survey research are increasing, 20 could lead to cost-effective, real-time estimates of regional immunization rates.
The primary objective of this study was to test the reliability of voluntarily reported IIS data to estimate local immunization coverage rates in San Diego County, California, for children aged 19-35 months by comparing these data with data generated through telephone surveys. A secondary objective was to determine consistencies and differences in demographic characteristics between the 2 data sources; data on these characteristics could be used to develop models for predicting immunization coverage rates based on voluntary reporting.
Methods
Study Design
We used data from a cross-sectional telephone survey on the immunization status of children aged 19-35 months to test the reliability of using the San Diego IIS (ie, San Diego Regional Immunization Registry) to estimate immunization coverage rates in San Diego County, California. The telephone survey took place during 6 months in 2013. Data were extracted from the IIS on April 27, 2016. This study was approved by the National University Institutional Review Board.
Telephone Survey Questionnaire
San Diego County has tracked childhood immunization coverage rates via standardized telephone survey methods modeled after the National Immunization Survey since 1995. The most recent telephone survey to assess immunization coverage rates for children aged 19-35 months was conducted in 2013.
San Diego County purchased random telephone numbers from the Scientific Telephone Sample Company (Santa Ana, California), which were screened to eliminate business and nonexistent numbers. If the respondent had the child’s California Immunization Record (also known as the yellow card), the interviewer recorded all vaccination dates on a data collection form. If an immunization record was not available, the interviewer asked the respondent to recall the number of doses the child received for each vaccine on a different data collection form. Both forms included the same questions about demographic characteristics, attitudes, and beliefs.
Interviewers also asked for the name, location, and telephone number of the child’s medical provider for each immunization and requested parental permission to contact the child’s immunization providers to obtain the immunization information. If the parent or guardian gave permission, a staff member from San Diego County searched the IIS and/or contacted the child’s health care provider to verify or amend incomplete immunization information collected during the survey. Data on participants who did not provide children’s names were included in calculations of coverage rates but excluded from the data reliability tests.
Recommended Immunization Schedule
This study focused on completion of the immunization schedule 21 for children aged 19-35 months, identical to the immunizations surveyed by the National Immunization Survey. Children were considered up-to-date for immunizations if they had received 4 doses of diphtheria, tetanus, and acellular pertussis (DTaP) vaccine; 3 doses of polio vaccine; 1 dose of measles, mumps, and rubella (MMR) vaccine; 3 doses of hepatitis B vaccine; 3 doses of Haemophilus influenzae type b vaccine; 1 dose of varicella vaccine; and 4 doses of pneumococcal conjugate vaccine (PCV). This regiment is commonly referred to as the 4:3:1:3:3:1:4 series.
San Diego Regional Immunization Registry
The San Diego IIS is an internet-based confidential IIS used by private and public organizations and medical systems in San Diego County, all of which voluntarily report immunization data. These organizations include public and community health centers, private providers, child care facilities, schools, school districts, colleges, the Special Supplemental Nutrition Program for Women, Infants, and Children, and health plans. As of June 2016, the database included approximately 2.5 million patient records, with >25 million immunizations. 22 Childhood immunizations in the IIS that were not included in this survey were influenza, hepatitis A, human papillomavirus, meningococcal conjugate, and rotavirus. The IIS data have limitations that affect the denominator of a potential coverage rate. Patients who move out of the area and adults aged ≥18 who died are not easily identified, although normal processing during the year removes data on those aged <18 who died.
Study Population
Telephone survey participants were parents or guardians living in San Diego County with a child aged 19-35 months in the home. To test the reliability of IIS data, we compared data from the telephone survey with data on children aged 19-35 months (born between March 15, 2010, and January 17, 2012) in 2013 in the IIS. At the time of our study, nearly 40% of immunization data in the IIS came from community clinics 23 ; for this reason, the IIS study population may have been more predisposed to being vaccinated than the telephone survey population.
The telephone survey was conducted from February 19 to August 29, 2013. We used the median date of the survey, May 25, 2013, to identify children aged 19-35 months in the IIS to calculate coverage rates and build models. Analyses included children born between May 26, 2010, and October 25, 2011.
IIS Data Selection Rules
The San Diego IIS stores data on demographic information from multiple medical providers for a single patient: if a patient receives immunizations from various health care facilities, demographic and birth records from each facility are retained in the registry. Most providers record the same demographic characteristics for each patient in the registry, although occasional discrepancies in a patient’s demographic characteristics may occur among providers.
We used data processing rules to select among discordant values for each demographic characteristic for each patient. For sex, ethnicity, race, primary language, and age, we selected the most frequently occurring value. For example, if a patient had received immunizations from 4 different providers and 3 of them indicated that the patient was male (and 1, female), we designated the patient as male. For ties (eg, 2 records indicating male and 2 female), we selected the most recent value. If a patient had demographic records from 2 providers, we used the most recent value. For ZIP code, medical provider type, and eligibility status in the federally funded Vaccines for Children (VFC) program, we selected the most recent value.
Analysis
We reported descriptive frequencies for each demographic characteristic. We calculated full immunization coverage rates for children aged 19-35 months as of May 25, 2013, in the IIS by dividing the number of children who were completely up-to-date for each vaccine by the total number of children in the IIS. We calculated rates based on immunization data uploaded into the IIS as of April 27, 2016. We reiterate that IIS estimates were calculated primarily from clinics and that a high proportion of immunization records were incomplete. Because the telephone survey was designed to be demographically representative of San Diego County, we conducted bivariate analyses to verify that the telephone survey subset with names (ie, those whose parents had consented) was demographically representative of the entire county.
We calculated κ to measure the degree of nonrandom agreement between the IIS and telephone survey. This measure of concordance was useful because it showed the extent to which the data in the IIS correctly represented telephone survey data. The level of agreement was defined as follows: greater than substantial agreement (κ = 0.8 to 1.0), substantial agreement (κ = 0.6 to <0.8), moderate agreement (κ = 0.4 to <0.6), fair agreement (κ = 0.2 to <0.4), and slight or poor agreement (κ = 0 to <0.2). 9 For this study, we considered substantial agreement or higher (κ > 0.6) to represent no practical difference between the IIS and telephone survey. We calculated κ values for binary receipt of all doses for each recommended vaccine and for having received all doses in the 4:3:1:3:3:1:4 series. We also calculated a weighted κ value, which gives mathematical benefit to “closeness,” to assess dose agreement. 24 We used the dates of survey as cutoff points for immunizations included in the IIS for the κ tests.
We built multivariable logistic regression models to evaluate associations among the outcomes of interest. We used adjusted odds ratios to evaluate the magnitude of associations between demographic characteristics (ie, sex, race/ethnicity, 7 regions defined by ZIP code, medical provider type, primary language, and VFC status) and outcomes of interest (ie, coverage for each immunization), adjusting for all other demographic characteristics in the model. We considered P < .05 to be significant with the Wald χ2 test for bivariate analyses (not tabulated) and by adjusted odds ratios and 95% CIs. We examined model assumptions, investigated for confounders and collinearity, and ranked standardized coefficients for predictors. We conducted data analyses using SAS version 9.3. 25
Results
Both IIS and telephone survey data included a greater proportion of participants who were male, white, and English speaking. However, more values were missing in the IIS data than in the survey data (Table 1).
Demographic characteristics of children aged 19-35 months from a telephone survey and the immunization information system, San Diego County, Californiaa
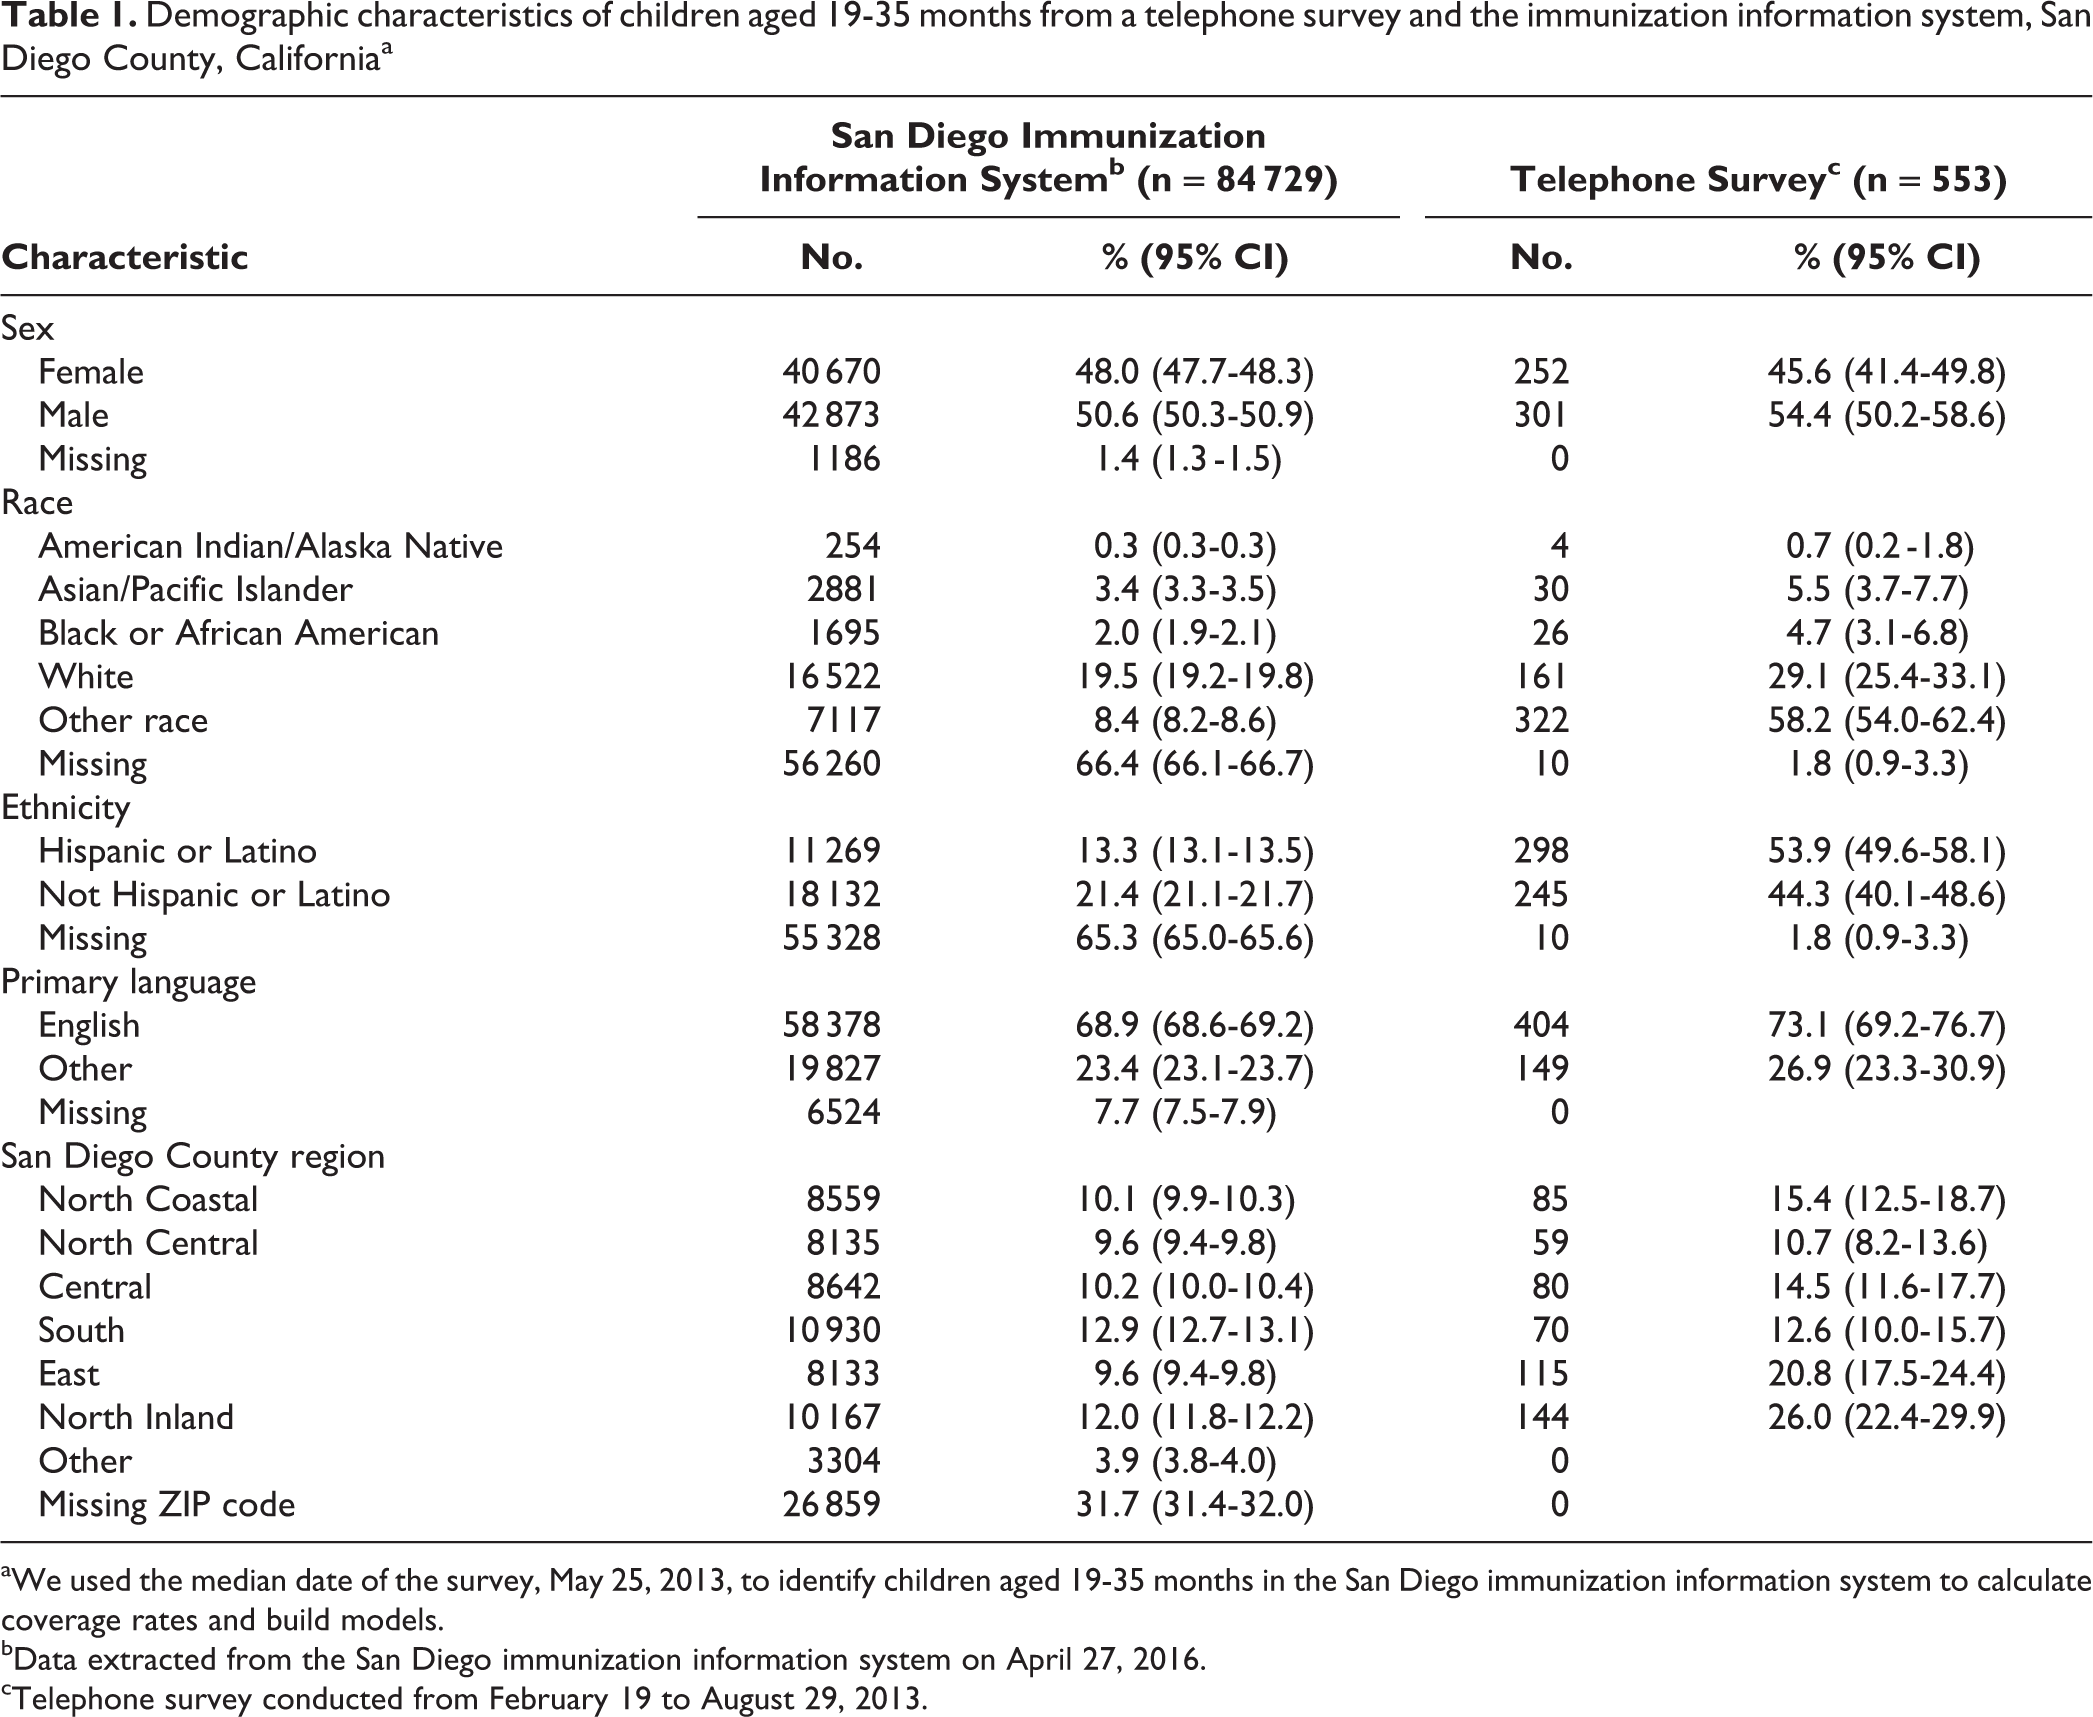
aWe used the median date of the survey, May 25, 2013, to identify children aged 19-35 months in the San Diego immunization information system to calculate coverage rates and build models.
bData extracted from the San Diego immunization information system on April 27, 2016.
cTelephone survey conducted from February 19 to August 29, 2013.
Completeness of Registry (IIS) Data
Of the 84 729 children aged 19-35 months as of May 25, 2013, in the San Diego IIS, 36 349 (42.9%) were shown to be up-to-date for DTaP, 42 534 (50.2%) for polio, 43 297 (51.1%) for MMR, 38 467 (45.4%) for hepatitis B, 44 567 (52.6%) for H influenzae type b, 41 856 (49.4%) for varicella, and 31 180 (36.8%) for PCV (Figure). According to the telephone survey, rates were 88.0% for DTaP (95% CI, 85.1%-90.9%), 93.2% for polio (95% CI, 90.9%-95.5%), 93.7% for MMR (95% CI, 91.4%-96.0%), 92.9% for hepatitis B (95% CI, 90.6%-95.2%), 94.7% for H influenzae type b (95% CI, 92.7%-96.7%), 95.0% for varicella (95% CI, 93.0%-97.0%), and 85.1% for PCV (95% CI, 81.8%-88.4%). Of telephone survey participants, 54.2% were male and 49.7% were Hispanic (Table 1).
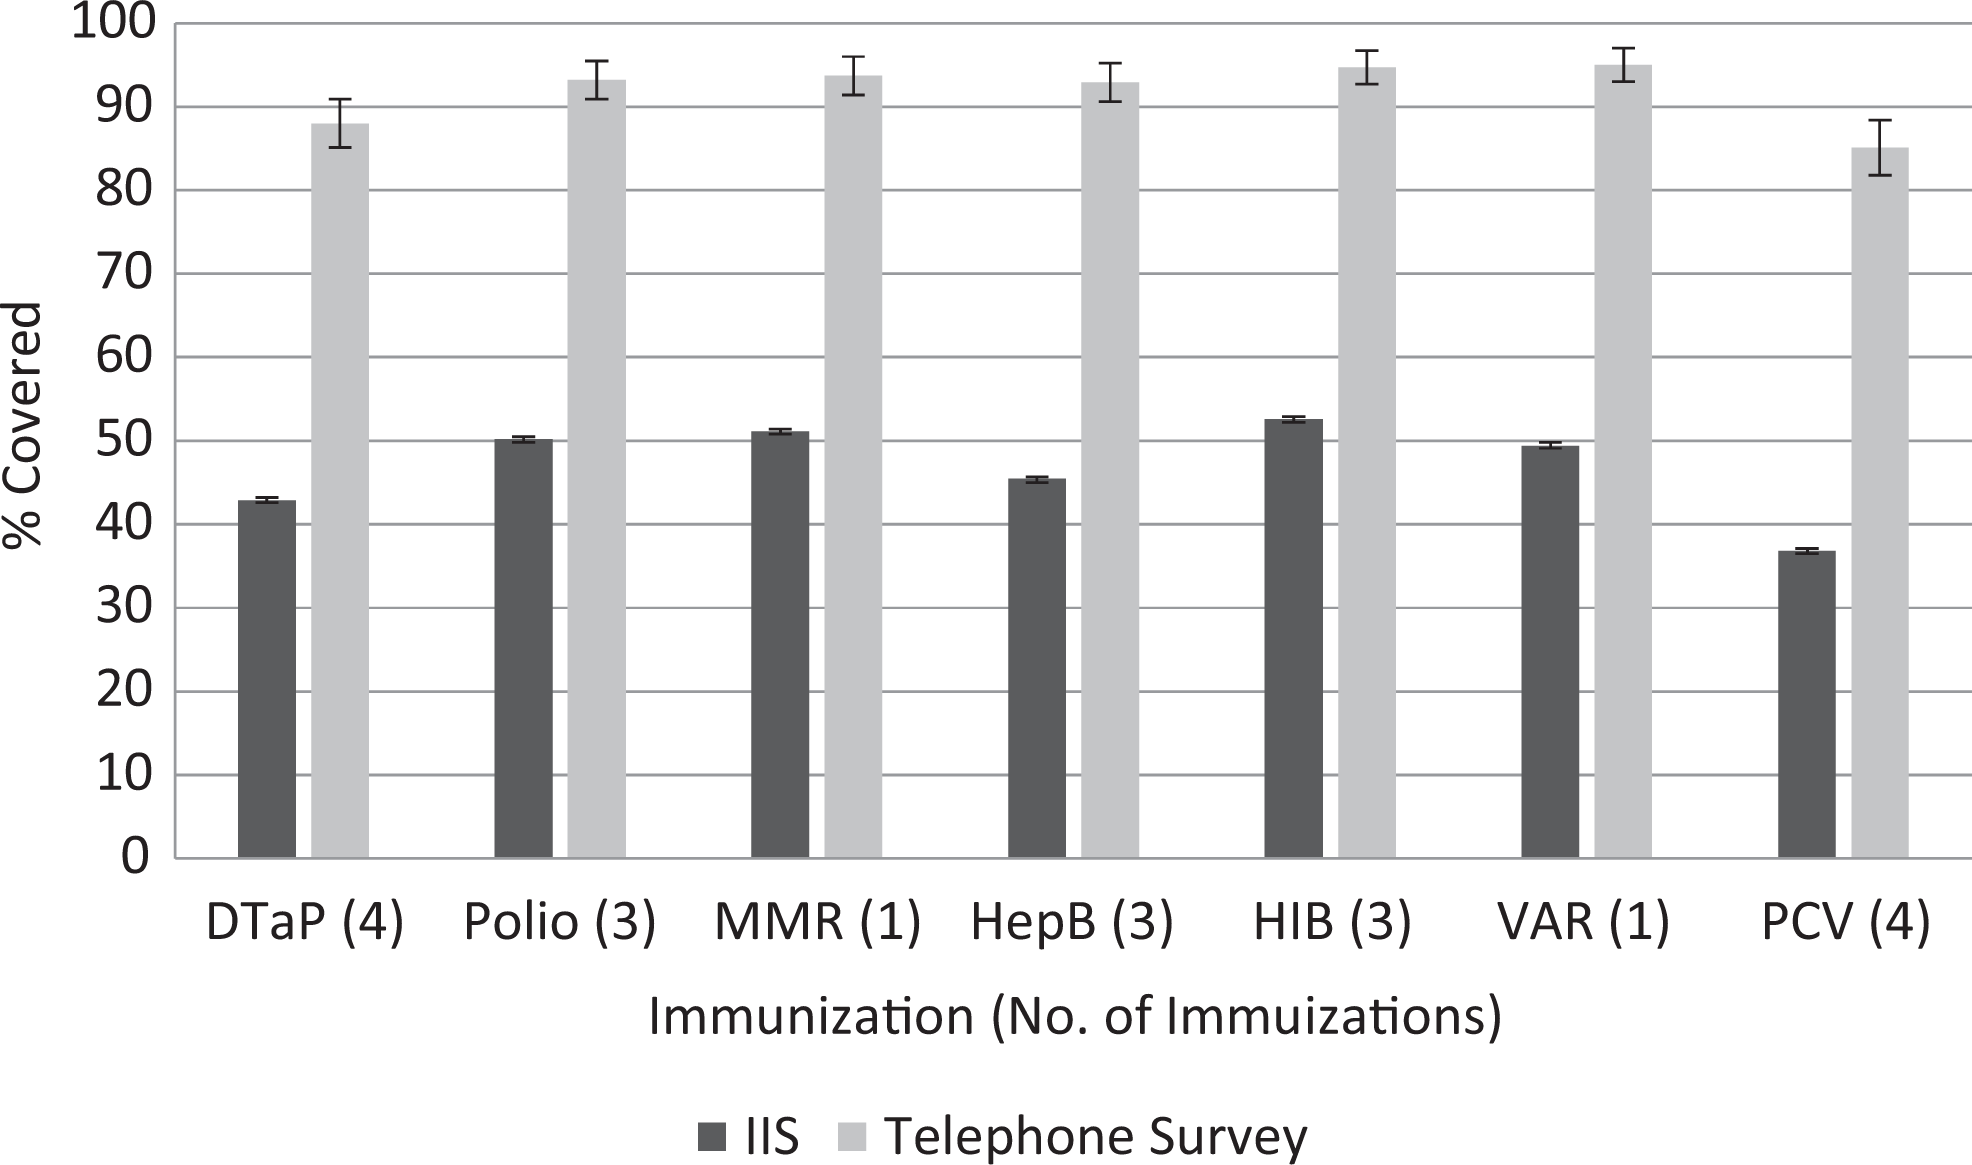
Immunization information system (IIS) and telephone survey immunization coverage rate estimates for children aged 19-35 months, San Diego, California, 2013. The IIS does not contain records for everyone in San Diego County, California; therefore, coverage rates are dependent on provider participation. Error bars indicate 95% CIs. Abbreviations: DTaP, diphtheria, tetanus, and acellular pertussis; HepB, hepatitis B; HIB, Haemophilus influenzae type b; MMR, measles, mumps, rubella; PCV, pneumococcal conjugate vaccine; VAR, varicella.
Completeness of Telephone Survey Data
More than 200 000 calls to both landline and cellular telephone numbers resulted in 553 completed surveys: 512 (92.6%) surveys were administered via landline telephone calls and 41 (7.4%) via cellular telephone calls for children aged 19-35 months. Additionally, 430 (77.8%) parents consented to providing the child’s name, and 435 (78.7%) consented to having the child’s immunization record verified with the medical provider. Participants who did not provide names were included in coverage rates but excluded from κ reliability tests.
Reliability Tests and Standardized Coefficients
Of the 430 telephone survey records with children’s names, 412 (95.8%) were in the IIS as of April 27, 2016: 308 (74.8%) had records of immunizations from the 4:3:1:3:3:1:4 series in 2013.
κ tests compared immunization records from participants in the telephone survey with immunization records for the same participants in the IIS. We found moderate agreement between the telephone survey and the IIS for DTaP (κ = 0.49), PCV (κ = 0.49), and H influenzae type b (κ = 0.46); fair agreement for varicella (κ = 0.39), polio (κ = 0.39), and MMR (κ = 0.35); and slight or poor agreement for hepatitis B (κ = 0.17; Table 2). An overall κ testing whether a child was completely up-to-date on all vaccines indicated fair agreement between the telephone survey and the IIS (κ = 0.30).
Agreement between the IISa and the telephone surveyb for childhood immunizations, based on κ statistics (n = 308), San Diego County, California, 2013c
Abbreviations: IIS, immunization information system; NA, not applicable.
aData extracted from the IIS on April 27, 2016.
bTelephone survey conducted from February 19 to August 29, 2013.
cWe used the median date of the survey, May 25, 2013, to identify children aged 19-35 months in the IIS to calculate coverage rates and build models.
dSimple κ is a binary test comparing whether a child is completely up-to-date (received all recommended doses) for each vaccine.
eWeighted κ examines how close the IIS is to the telephone survey by examining agreement among individual doses.
Weighted κ tests for doses revealed moderate agreement between the telephone survey and the IIS for H influenzae type b (κ = 0.43), DTaP (κ = 0.42), and PCV (κ = 0.42); fair agreement for varicella (κ = 0.39), polio (κ = 0.35), and MMR (κ = 0.35); and slight or poor agreement for hepatitis B (κ = 0.19; Table 2).
One important observation from review of these data is that children without complete records in the IIS are less likely to have a record of immunizations than children with complete demographic records. For example, after adjusting for sex, race, ethnicity, provider source, and VFC status, children with missing values for region were 61% less likely to have a record of hepatitis B immunization than children with values for region (95% CI, 0.35-0.41; Table 3). Additionally, after adjusting for sex, race, ethnicity, age, primary language, region, provider source, and VFC status, patient records that were missing data on sex were 27% to 47% less likely than records with values for sex to have a record of immunizations for each vaccine. Analyses of standardized coefficients indicated that region and VFC status were important predictors of immunization coverage for each IIS model (not tabulated). Primary language and insurance ranked high among telephone survey predictors; however, bivariate analyses indicated that these variables were not significant.
Age-adjusted odds of associations between immunization status and demographic characteristics for children aged 19-35 months in the immunization information system, San Diego County, California, 2013a
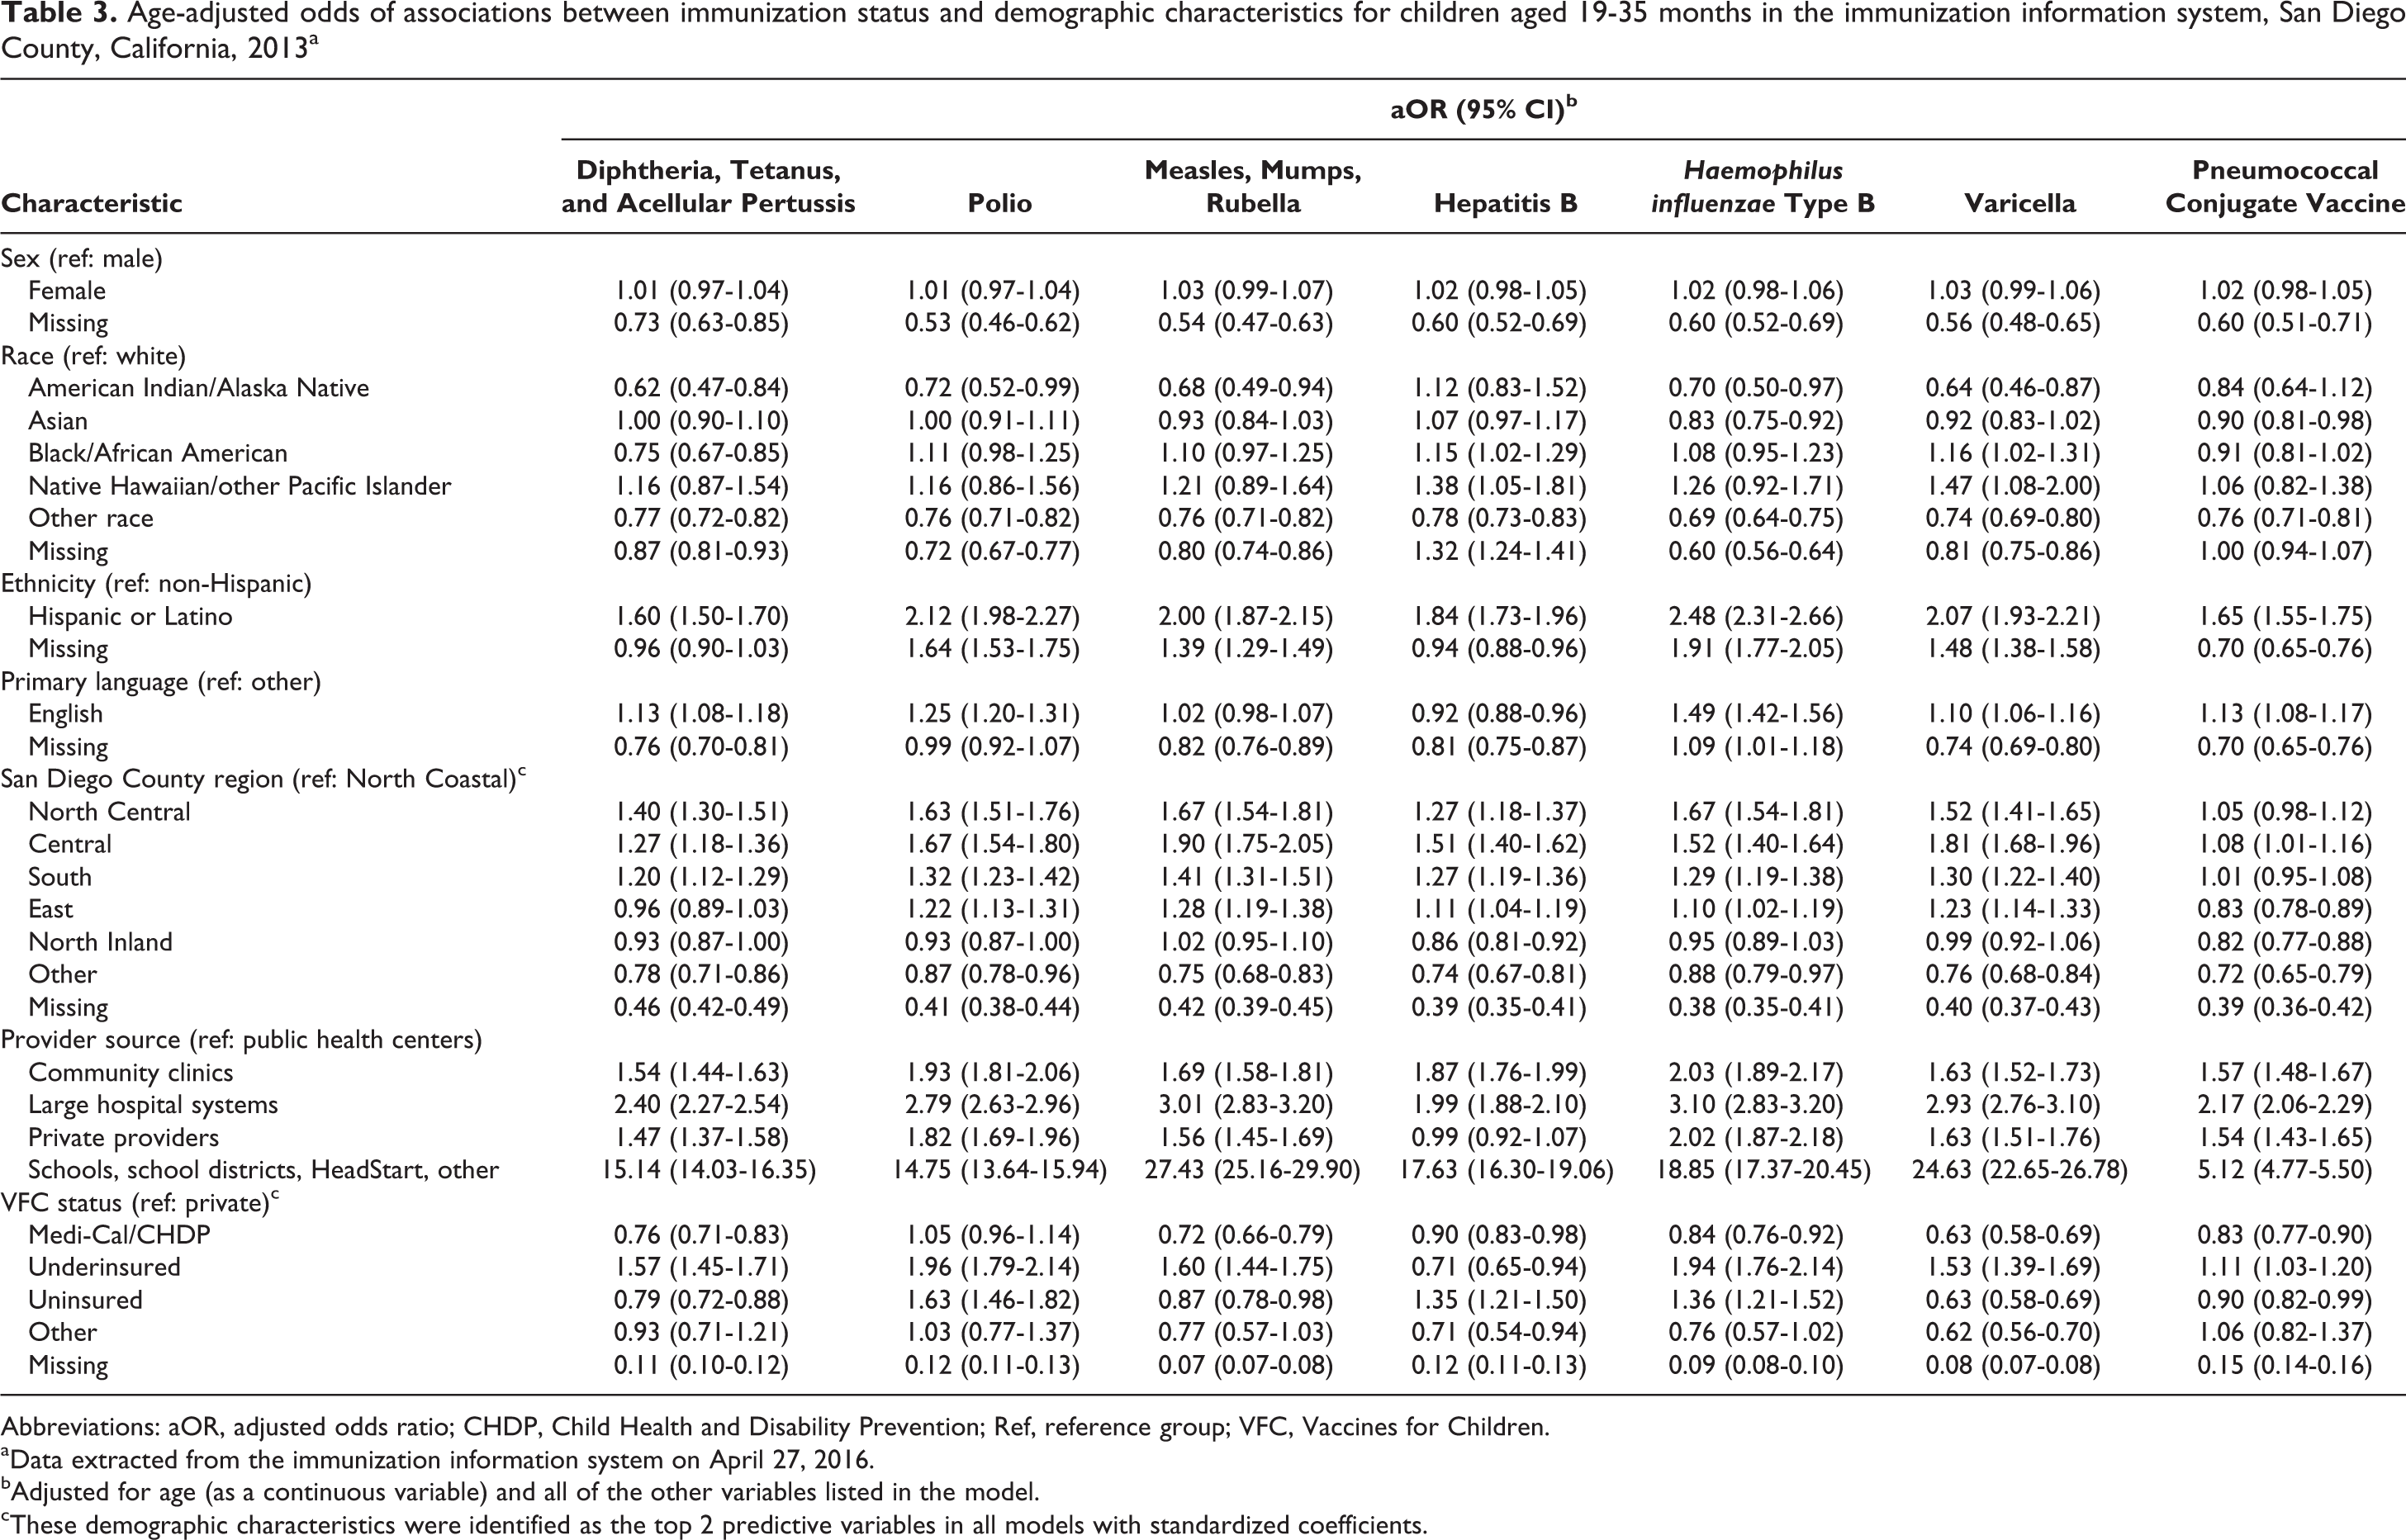
Abbreviations: aOR, adjusted odds ratio; CHDP, Child Health and Disability Prevention; Ref, reference group; VFC, Vaccines for Children.
aData extracted from the immunization information system on April 27, 2016.
bAdjusted for age (as a continuous variable) and all of the other variables listed in the model.
cThese demographic characteristics were identified as the top 2 predictive variables in all models with standardized coefficients.
Discussion
κ tests indicated fair to moderate agreement between the IIS and telephone survey for 6 of 7 immunizations studied, which is promising given that these results were calculated from incomplete data in the IIS. Coverage rates depend on provider participation. The IIS was missing data on immunizations from several large clinic systems in San Diego, so the κ agreements determined in this study are expected to improve as these large clinics begin sending data.
Agreement between data sources in factors predicting immunization coverage rates in our study confirmed the feasibility of weighting IIS data to conform to demographic characteristics. Documenting the completeness of reporting in this IIS sample identified areas for improvement, such as onboarding additional immunization data to bring the 36.8% for PCV immunization closer to the telephone survey rate of 85.1%. Overall data reporting percentages in San Diego’s IIS are expected to increase with the addition of 100 new health care organizations by the end of 2017. Registry data can be used to build models to predict immunization coverage rates in states that do not mandate reporting of vaccinations, offering these states a more cost-effective alternative to telephone surveys. Another potential solution is a national immunization registry system, 26 which has been successful in immunization surveillance and measuring vaccine effectiveness in other countries, including Taiwan, Denmark, Norway, and Australia. 16,26,27
If immunization records were not available during the telephone survey, respondents were asked to recall the number of doses that their children had received. Studies of parental recall of children’s immunization histories show that the validity of parental recall depends on the vaccine and the age of the child. However, most studies reported that adult recall is unreliable and should not replace immunization record review. 28 –31 Overreporting is a common problem that occurs when parents forget the number of doses the child has received for each vaccine or when they give socially desirable responses. 29 –31 Reporting errors may also occur when children receive immunizations from multiple providers. 29
The results of our study identified gaps in the IIS data. Our multivariable analyses showed that children missing data on demographic characteristics in the IIS were significantly less likely than children with data on demographic characteristics to have a record of immunizations. Next steps include exploring the data for missing values through both complete case analysis and multiple imputation techniques.
Limitations
This study had several limitations. First, some patients in the IIS had moved or left the coverage rate area, which may have led to a bias that we could not account for in this analysis. However, we believe that the bias would be nondifferential and shift results toward the null. Second, the IIS contains duplicate records, which occurs when a provider creates a unique record for a patient who already exists in the database. This duplication may have led to an overestimation of the sample size. Third, data that are uploaded into the IIS may be incomplete or of poor quality, with incorrectly coded or missing demographic characteristics and data fields, which may have led to underestimated coverage rates. For example, 66.4% of participants were missing data on race. Fourth, this study focused on only 1 age group; older age groups in the IIS may have more gaps in data. Fifth, it was unclear whether the parent or guardian interviewed in the telephone survey was the person most likely to take the child to the medical provider for the vaccination, which may have reduced the validity of parental recall of the child’s immunizations. Finally, the children in the IIS who had no immunization history were more often those whose data on demographic characteristics were derived from birth records. Data from birth records were less complete than records created by providers who had administered immunizations.
Strengths
Our study also had several strengths. First, the large sample size of the population in the IIS and the weighting scheme for the telephone survey allowed for a robust comparison of survey data and electronic measures in a representative population. Second, San Diego County has a diverse population, and the IIS is a mature database, covering all ages. Third, the study focused on children aged 19-35 months, the age range when most immunizations are administered; therefore, our study included a large sample of immunizations. Fourth, the IIS receives data from many pediatric providers, resulting in this age range being well represented in the registry. Finally, all data on births in San Diego County are loaded into the IIS, making the population denominator accurate.
Conclusion
In the past decade, technological advances have created new and powerful tools to enhance public health. Understanding data origins, managing data flow, and expanding data warehouses can help frame future predictive analytics by using these large databases for real-time public health needs, such as real-time vaccine coverage rates. Our study shows promise in data reliability and consistency in factors predicting vaccine uptake between a traditional telephone survey assessment and electronically available data stores. This analysis frames some of the limitations that public health agencies will need to overcome when having to rely on disparate data sources. Limitations including attrition or migration of study participants may be mitigated with additional data linkages to databases, such as the National Change of Address services. As the quality and completeness of the data increase, the validity of the findings derived from those data will also increase.
Footnotes
Declaration of Conflicting Interests
The authors declared no potential conflicts of interest with respect to the research, authorship, and/or publication of this article.
Funding
The authors disclosed receipt of the following financial support for the research, authorship, and/or publication of this article: This study was supported in part by an appointment to the Applied/Public Health Informatics Fellowship Program administered by the Council of State and Territorial Epidemiologists and funded by the Centers for Disease Control and Prevention (cooperative agreement 3U38-OT000143-01S3).