
Abstract
Objective:
Reports about infectious disease (ID) hospitalization rates among American Indian/Alaska Native (AI/AN) persons have been constrained by data limited to the tribal health care system and by comparisons with the general US population. We used a merged state database to determine ID hospitalization rates in Alaska.
Methods:
We combined 2010 and 2011 hospital discharge data from the Indian Health Service and the Alaska State Inpatient Database. We used the merged data set to calculate average annual age-adjusted and age-specific ID hospitalization rates for AI/AN and non-AI/AN persons in Alaska. We stratified the ID hospitalization rates by sex, age, and ID diagnosis.
Results:
ID diagnoses accounted for 19% (6501 of 34 160) of AI/AN hospitalizations, compared with 12% (7397 of 62 059) of non-AI/AN hospitalizations. The average annual age-adjusted hospitalization rate was >3 times higher for AI/AN persons (2697 per 100 000 population) than for non-AI/AN persons (730 per 100 000 population; rate ratio = 3.7, P < .001). Lower respiratory tract infection (LRTI), which occurred in 38% (2486 of 6501) of AI/AN persons, was the most common reason for ID hospitalization. AI/AN persons were significantly more likely than non-AI/AN persons to be hospitalized for LRTI (rate ratio = 5.2, P < .001).
Conclusions:
A substantial disparity in ID hospitalization rates exists between AI/AN and non-AI/AN persons, and the most common reason for ID hospitalization among AI/AN persons was LRTI. Public health programs and policies that address the risk factors for LRTI are likely to benefit AI/AN persons.
Historically, American Indian/Alaska Native (AI/AN) persons have had a high burden of infectious diseases (IDs), particularly when compared with other populations. 1 –5 In a 1994 comparison of Indian Health Service (IHS) hospital discharge data with published hospitalization trends for the general US population, the annual age-adjusted ID hospitalization rate for AI/AN persons (1863 per 100 000 population) was 21% higher than the rate for the US population (1534 per 100 000 population). 4 In a study comparing IHS inpatient data with data from the US Nationwide Inpatient Sample, the average annual ID hospitalization rate among AI/AN persons from 2004 to 2006 (1707 per 100 000 population) declined but was higher than that of the US population (1609 per 100 000 population). 5 ID mortality rates among AI/AN persons have also been relatively high. According to a study based on National Vital Statistics System mortality data linked to IHS patient registration data from 1999 to 2009, AI/AN persons (86 per 100 000 population) were twice as likely as white persons (44 per 100 000 population) to die from an ID. 6
Moreover, among the 12 IHS regions in the United States, the Alaska region has consistently had one of the highest annual ID-related hospitalization rates for AI/AN persons. 2,4,5,7 –9 In a study comparing Alaska IHS data with data from the National Hospital Discharge Survey, the average annual AI/AN hospitalization rate per 1000 infants for respiratory syncytial virus in 2000 and 2001 was 71 in Alaska versus 27 in the general US population. 8 In a study comparing Alaska IHS direct and contract health service inpatient data with US population data from the Nationwide Inpatient Sample, the average annual age-adjusted ID hospitalization rate for 2007 to 2009 was 2126 per 100 000 population for AI/AN persons living in Alaska, as opposed to 1679 per 100 000 population for the general US population. 7
Previous studies reporting ID hospitalization rates in AI/AN persons were constrained by data limited to the IHS/tribal health care system and by comparisons of AI/AN rates with the general US population, rather than with common reference populations. 2 –5,7,8,10 Fifty-seven percent of persons who self-identify as AI/AN live in an area serviced by an IHS/tribal or contract health care facility. 9 Therefore, databases that draw only from IHS/tribal or contract health care facilities might be incomplete.
In an attempt to overcome these limitations, we created a merged hospital discharge database based on the Alaska IHS and the Alaska State Inpatient Database. The objectives of our study were to use this more comprehensive database, with its common reference population, to (1) determine and compare the ID hospitalization rates for AI/AN and non-AI/AN persons in Alaska, (2) identify the most common IDs that contribute to these hospitalizations, and (3) enumerate the most common non-ID diagnoses associated with ID hospitalizations. Our hypothesis was that this merged database would provide a more comprehensive estimate of the ID health disparities of AI/AN persons in Alaska than previous studies of the ID health disparities experienced by AI/AN persons in Alaska.
Methods
We conducted a cross-sectional analysis of state hospital discharge records of Alaska residents from 2010 to 2011. We merged records for 2010 and 2011 from 2 data sources: (1) the IHS National Patient Information Reporting System, which provided inpatient data for all Alaska IHS and tribal facilities, 9,11 and (2) the Alaska State Inpatient Database, part of the Healthcare Cost and Utilization Project, which is sponsored by the Agency for Healthcare Research and Quality. 12 We assigned participants to the AI/AN group if their record in the National Patient Information Reporting System or the State Inpatient Database designated their race as AI/AN alone or in combination with another race.
This study was a collaboration among the Agency for Healthcare Research and Quality, the IHS, the Alaska State Department of Health and Social Services, and the Centers for Disease Control and Prevention. The study was considered exempt from human subjects review by the institutional review boards of all collaborating agencies because use of Healthcare Cost and Utilization Project and IHS hospital discharge data is not considered human subjects research.
Of the 7 tribal hospitals, 1 contributed data to both the National Patient Information Reporting System and the State Inpatient Database; as such, we included only data from the State Inpatient Database for that facility to avoid duplication. We excluded the records of newborn infants (defined as discharges with a diagnosis code for normal delivery). In addition, when comparing hospitalizations rates, we excluded the records of those for whom race was not recorded. We were unable to include the hospital discharge data from 1 of 12 nonfederal community-based acute care hospitals because it stopped reporting data to the State Inpatient Database after 2007, at which time it accounted for approximately 6.5% of all hospital discharges included in the State Inpatient Database (Kim Laird, Alaska Department of Health and Social Services, oral communication, August 2015).
We defined ID hospitalizations as those that occurred when hospital discharge records listed ID as the first diagnosis. We determined the most frequent non-ID diagnoses by counting up to 14 secondary diagnoses listed in each hospital discharge record. We identified these diagnoses via International Classification of Diseases, Ninth Revision, Clinical Modification codes that were used in previous studies to evaluate ID disparities among AI/AN persons. 5 –7,10,13 Because our analysis focused on hospitalizations rather than participants, we counted hospital transfers and additional hospitalizations of the same patient separately. Because of privacy concerns, we did not report the number of hospitalizations for diagnostic categories that contained ≤10 hospitalizations. 12
We obtained annual data on the general Alaska population from the Alaska Department of Labor and Workforce Development to calculate hospitalization rates. 14 We calculated the average annual age-adjusted and age-specific hospitalization rates per 100 000 population, adjusting for age with the direct method and using the 2000 US population as the standard, with the following age groups (in years): <1, 1-4, 5-9, 10-19, 20-29, 30-39, 40-49, 50-59, 60-69, 70-79, and ≥80. 15 We did not calculate age-adjusted rates for diagnostic categories with <20 hospitalizations because of the likelihood of random error. 16
We calculated the relative frequencies of, and stratified the hospitalization rates by, ID diagnosis categories. We also calculated and ranked the relative frequencies of associated non-ID diagnoses.
We determined age-specific hospitalization rate ratios (RRs) and 95% confidence intervals (CIs) by comparing the hospitalization rates of AI/AN and non-AI/AN persons for each age group and using Poisson regression analysis to compare AI/AN and non-AI/AN hospitalization rates by sex and ID diagnosis category, controlling for age. 17 We compared the median age of AI/AN and non-AI/AN persons using the Wilcoxon rank-sum test. 18 We considered P < .05 to be significant.
Results
Demographic Characteristics
The median age for all hospitalized AI/AN persons was 36 years, and the median age for all hospitalized non-AI/AN persons was 50 years (P = .01). The median age for AI/AN persons hospitalized with an ID diagnosis was 34 years, whereas the median age for non-AI/AN persons hospitalized with an ID diagnosis was 52 years (P = .01). About half (51%, 3322 of 6501) of the AI/AN group and 50% (3704 of 7397) of the non-AI/AN group were female (Table 1).
Average annual age-adjusted and age-specific ID hospitalization rates of and rate ratios between AI/AN and non-AI/AN persons in Alaska, by sex and age, 2010-2011a
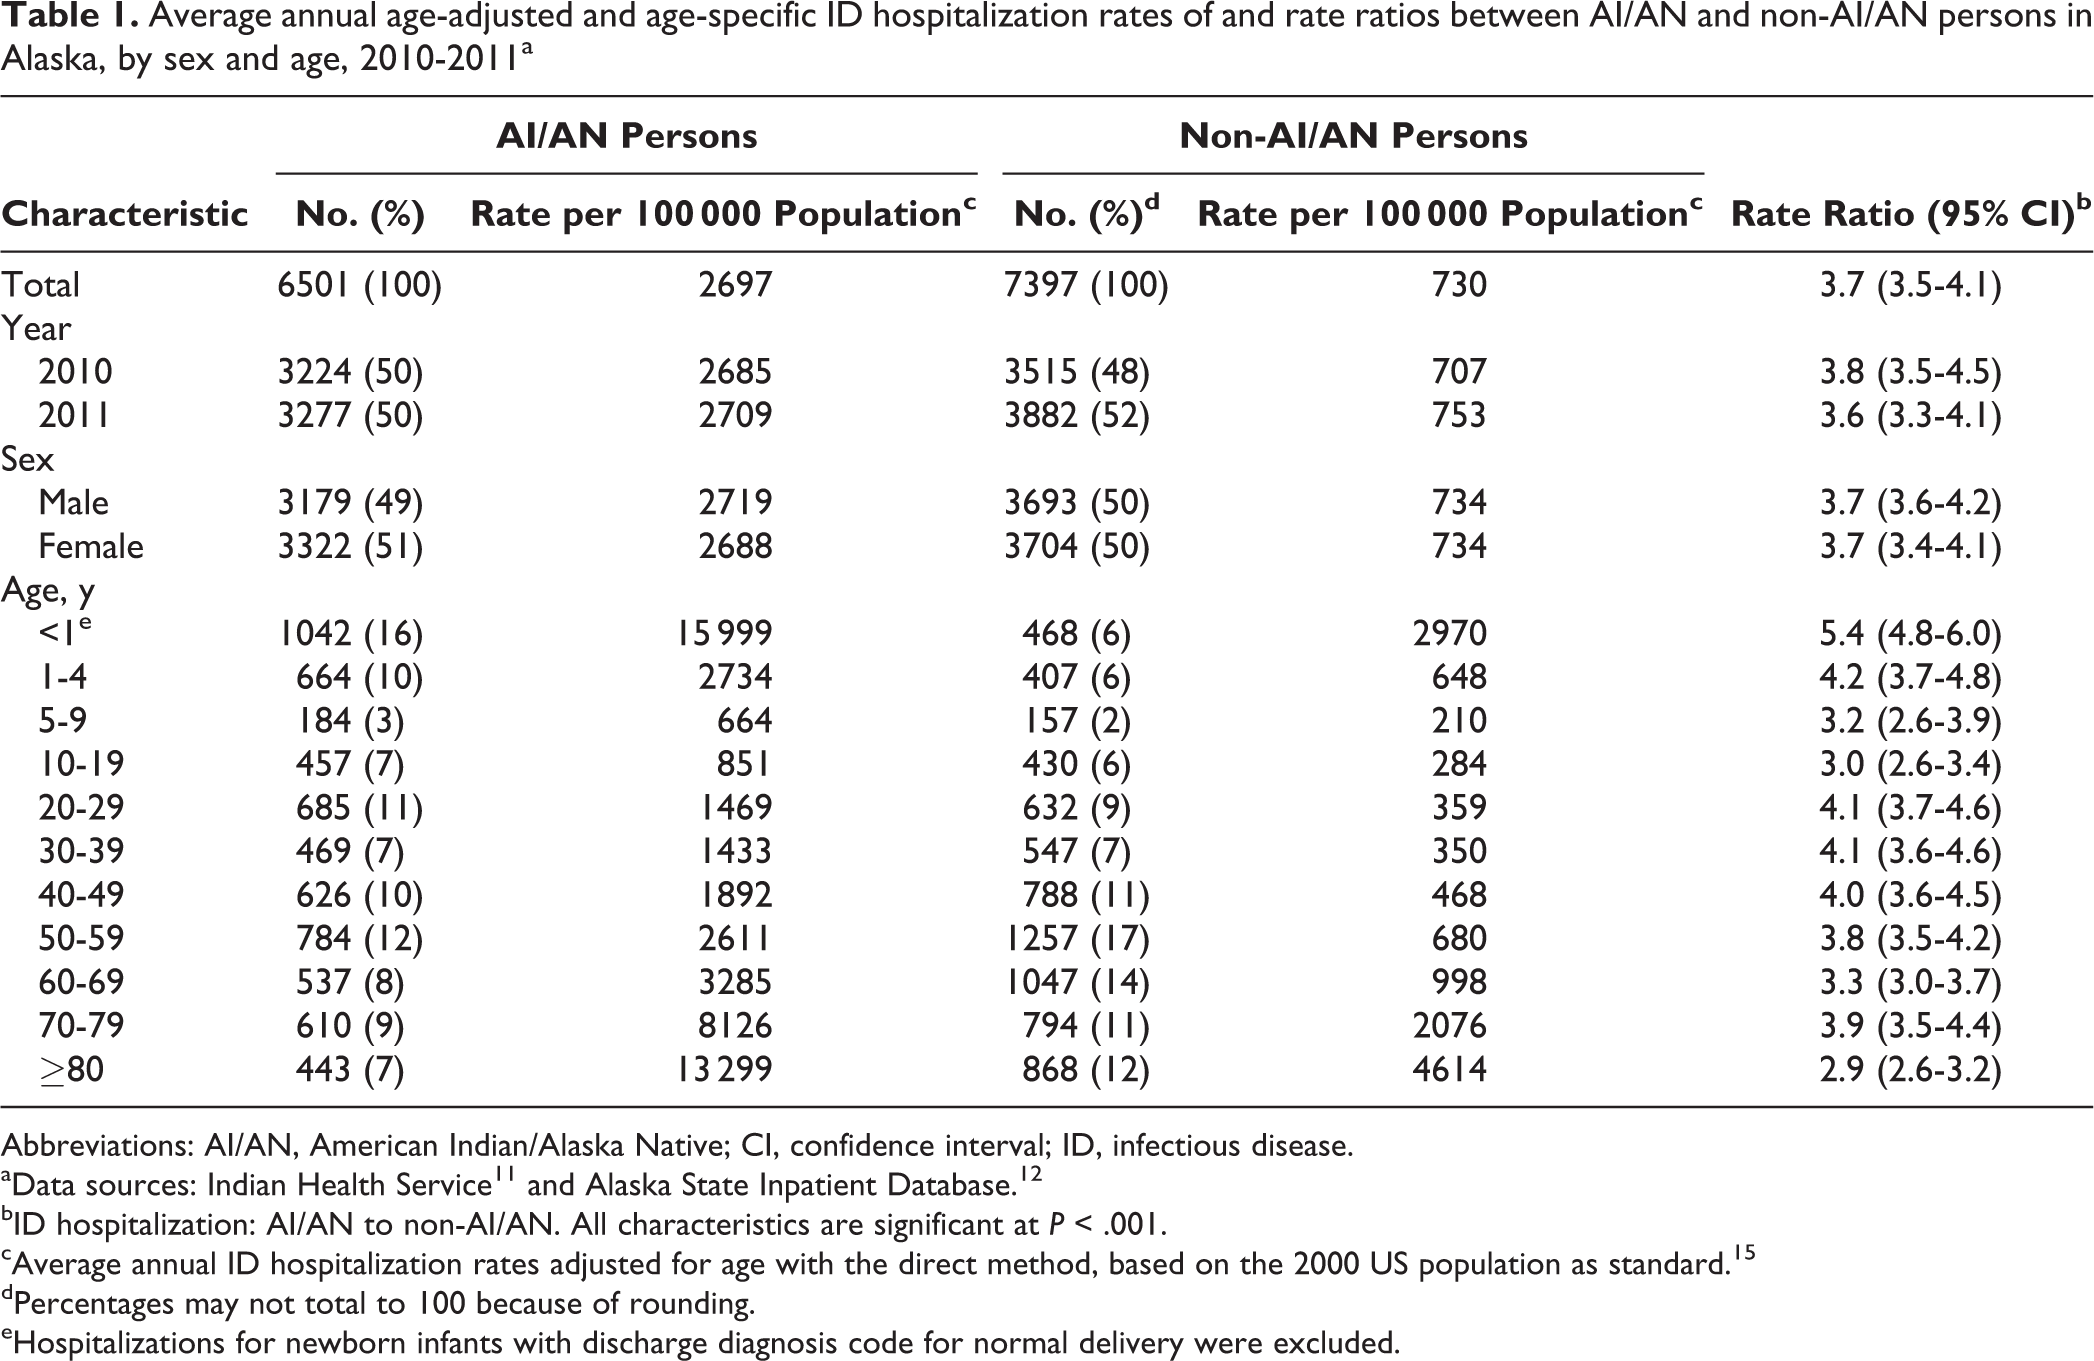
Abbreviations: AI/AN, American Indian/Alaska Native; CI, confidence interval; ID, infectious disease.
bID hospitalization: AI/AN to non-AI/AN. All characteristics are significant at P < .001.
cAverage annual ID hospitalization rates adjusted for age with the direct method, based on the 2000 US population as standard. 15
dPercentages may not total to 100 because of rounding.
eHospitalizations for newborn infants with discharge diagnosis code for normal delivery were excluded.
Frequency of Hospitalization
From 2010 to 2011, of 97 243 all-cause hospitalizations in Alaska, 14 004 (14%) were for an ID diagnosis, and 1024 (1%) did not have race recorded. Of the 13 898 ID hospitalizations in which race was known, 6501 (47%) were among AI/AN persons, and 7397 (53%) were among non-AI/AN persons (Table 1). Among all-cause hospitalizations for which the person’s race was known, 34 160 (35%) were among AI/AN persons, and 62 059 (64%) were among non-AI/AN persons. Although 19% (6501 of 34 160) of hospitalizations among AI/AN persons were for ID diagnoses, only 12% (7397 of 62 059) of hospitalizations among non-AI/AN persons were for ID diagnoses.
Adults aged ≥70 accounted for 16% (1053 of 6501) of ID hospitalizations among AI/AN persons and 22% (1662 of 7397) of ID hospitalizations among non-AI/AN persons. Children <5 years of age accounted for 26% (1706 of 6501) of ID hospitalizations among AI/AN persons and 12% (875 of 7397) of ID hospitalizations among non-AI/AN persons (Table 1).
Hospitalization Rates
From 2010 to 2011, the average annual age-adjusted all-cause hospitalization rate per 100 000 population in Alaska was 7498; the AI/AN hospitalization rate, 14 459; and the non-AI/AN hospitalization rate, 5873. AI/AN persons had a significantly higher annual age-adjusted all-cause hospitalization rate than non-AI/AN persons (RR = 2.5, P < .001; Table 2).
Average annual age-adjusted all-cause and ID hospitalization rates of and rate ratios between AI/AN and non-AI/AN persons in Alaska, by hospitalization diagnosis and age group, 2010-2011a
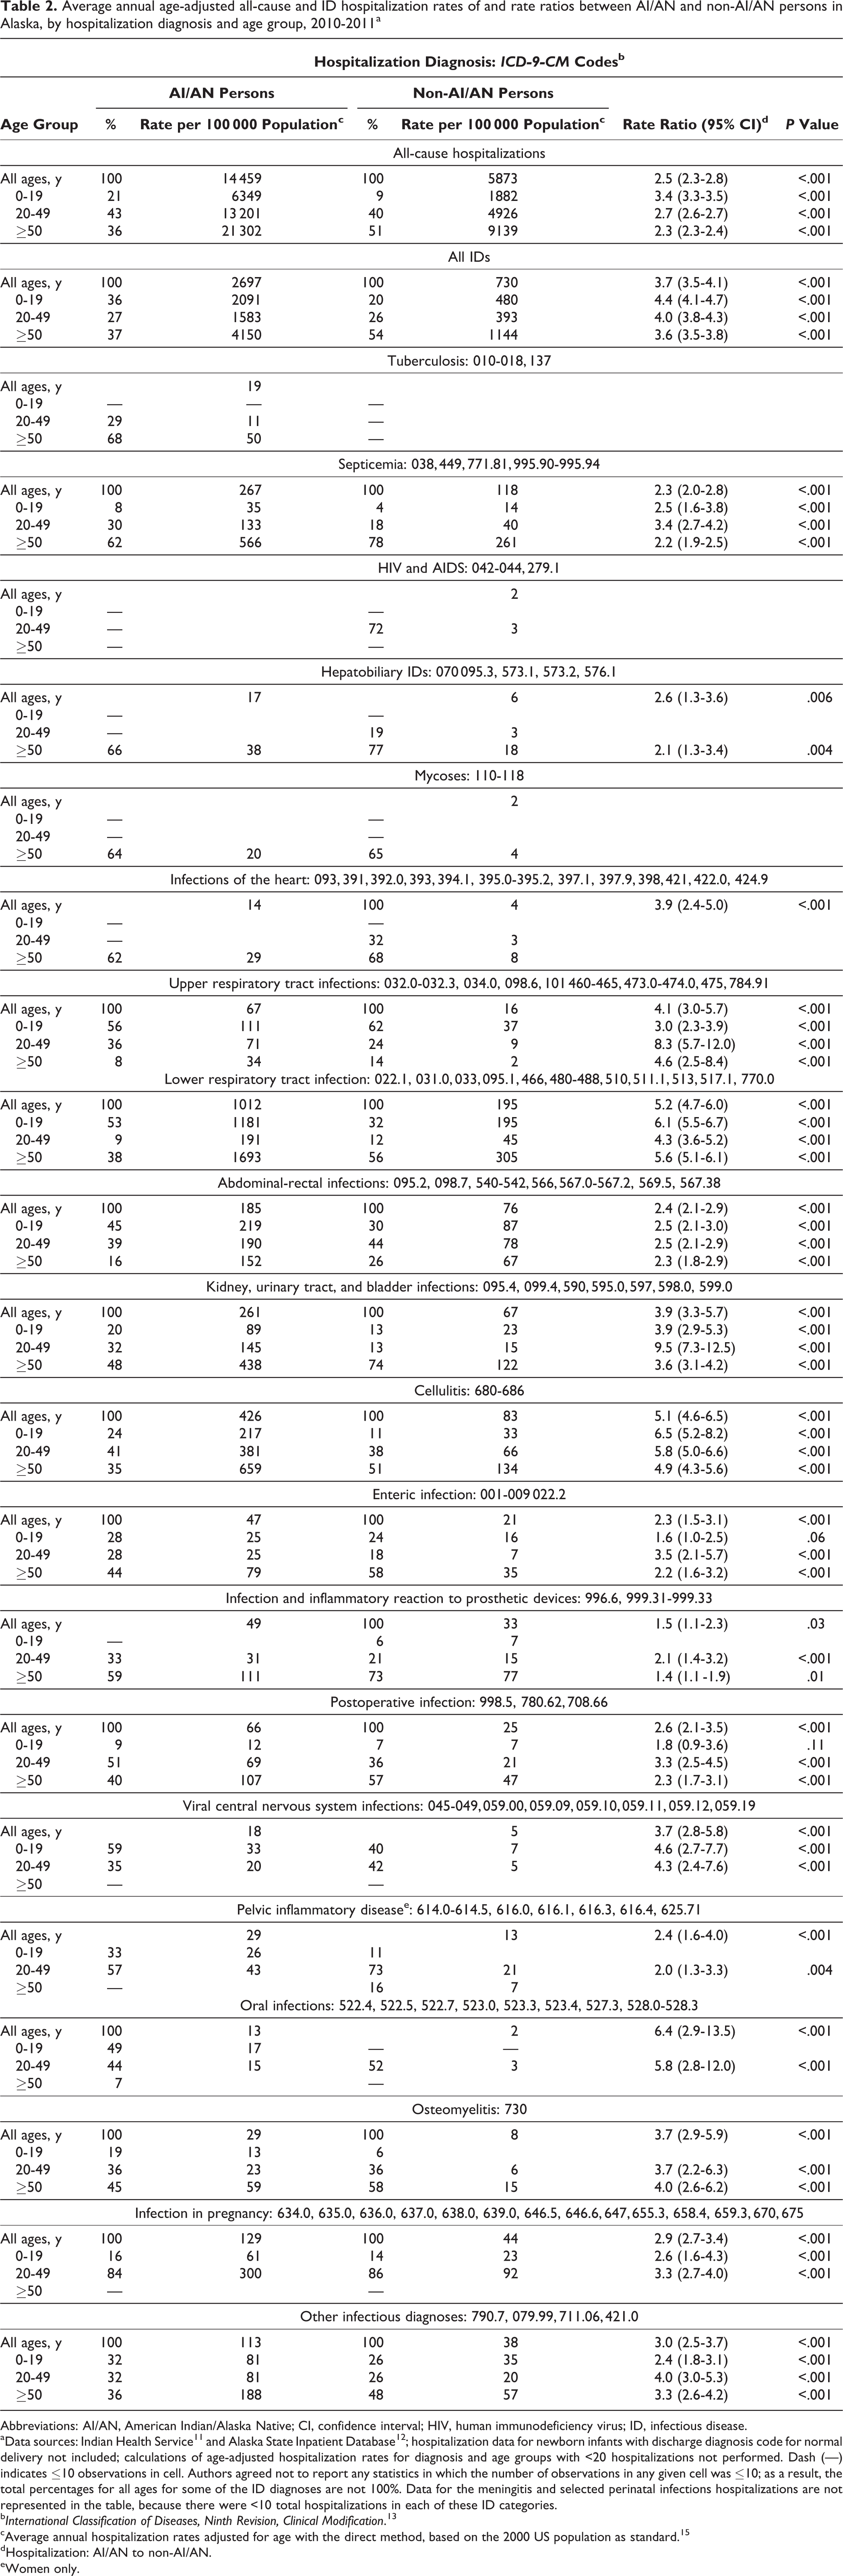
Abbreviations: AI/AN, American Indian/Alaska Native; CI, confidence interval; HIV, human immunodeficiency virus; ID, infectious disease.
aData sources: Indian Health Service 11 and Alaska State Inpatient Database 12 ; hospitalization data for newborn infants with discharge diagnosis code for normal delivery not included; calculations of age-adjusted hospitalization rates for diagnosis and age groups with <20 hospitalizations not performed. Dash (—) indicates ≤10 observations in cell. Authors agreed not to report any statistics in which the number of observations in any given cell was ≤10; as a result, the total percentages for all ages for some of the ID diagnoses are not 100%. Data for the meningitis and selected perinatal infections hospitalizations are not represented in the table, because there were <10 total hospitalizations in each of these ID categories.
b International Classification of Diseases, Ninth Revision, Clinical Modification. 13
cAverage annual hospitalization rates adjusted for age with the direct method, based on the 2000 US population as standard. 15
dHospitalization: AI/AN to non-AI/AN.
eWomen only.
The average annual age-adjusted ID hospitalization rate for Alaska was 1102 per 100 000 population. This rate was >3 times higher for AI/AN persons (2697 per 100 000 population) than for non-AI/AN persons (730 per 100 000 population; RR = 3.7, P < .001). Similarly, the ID hospitalization rate for AI/AN males (2719 per 100 000 population) was significantly higher than for non-AI/AN males (734 per 100 000 population; RR = 3.7, P < .001), and the rate for AI/AN females (2688 per 100 000 population) was significantly higher than for non-AI/AN females (734 per 100 000 population; RR = 3.7, P < .001; Table 1).
When we stratified the results by age, the average annual age-specific ID hospitalization rates were highest for AI/AN and non-AI/AN adults aged ≥80 (13 299 and 4614 per 100 000 population, respectively) and infants aged <1 (15 999 and 2970 per 100 000 population, respectively). Differences in ID hospitalization rates between AI/AN and non-AI/AN persons were highest among infants aged <1 (RR = 5.4; 95% CI, 4.8-6.0) and children aged 1-4 (RR = 4.2; 95% CI, 3.7-4.8). The difference in ID hospitalization rates between AI/AN and non-AI/AN persons was significant for all age groups. Although not linear, the general trend was that these differences decreased with increasing age, reaching their lowest level for those aged ≥80 (RR = 2.9; 95% CI, 2.6-3.2; Table 1).
ID Diagnoses
Among 14 004 ID hospitalizations in Alaska, the most common diagnoses were lower respiratory tract infection (LRTI) in 4357 (31%) cases, cellulitis in 1942 (14%) cases, and septicemia in 1649 (12%) cases. Of 6501 ID hospitalizations among AI/AN persons, the most common ID diagnoses were LRTI in 2486 (38%) cases, cellulitis in 1039 (16%) cases, and abdominal-rectal infections in 545 (8%) cases. Of 7397 ID hospitalizations among non-AI/AN persons, the most common ID diagnoses were LRTI in 1849 (25%) cases, septicemia in 1126 (15%) cases, and abdominal-rectal infections in 878 (12%) cases (Figure). AI/AN persons were significantly more likely than non-AI/AN persons to be hospitalized for LRTI (RR = 5.2, P < .001), cellulitis (RR = 5.1, P < .001), abdominal-rectal infections (RR = 2.4, P < .001), and septicemia (RR = 2.3, P < .001; Table 2).
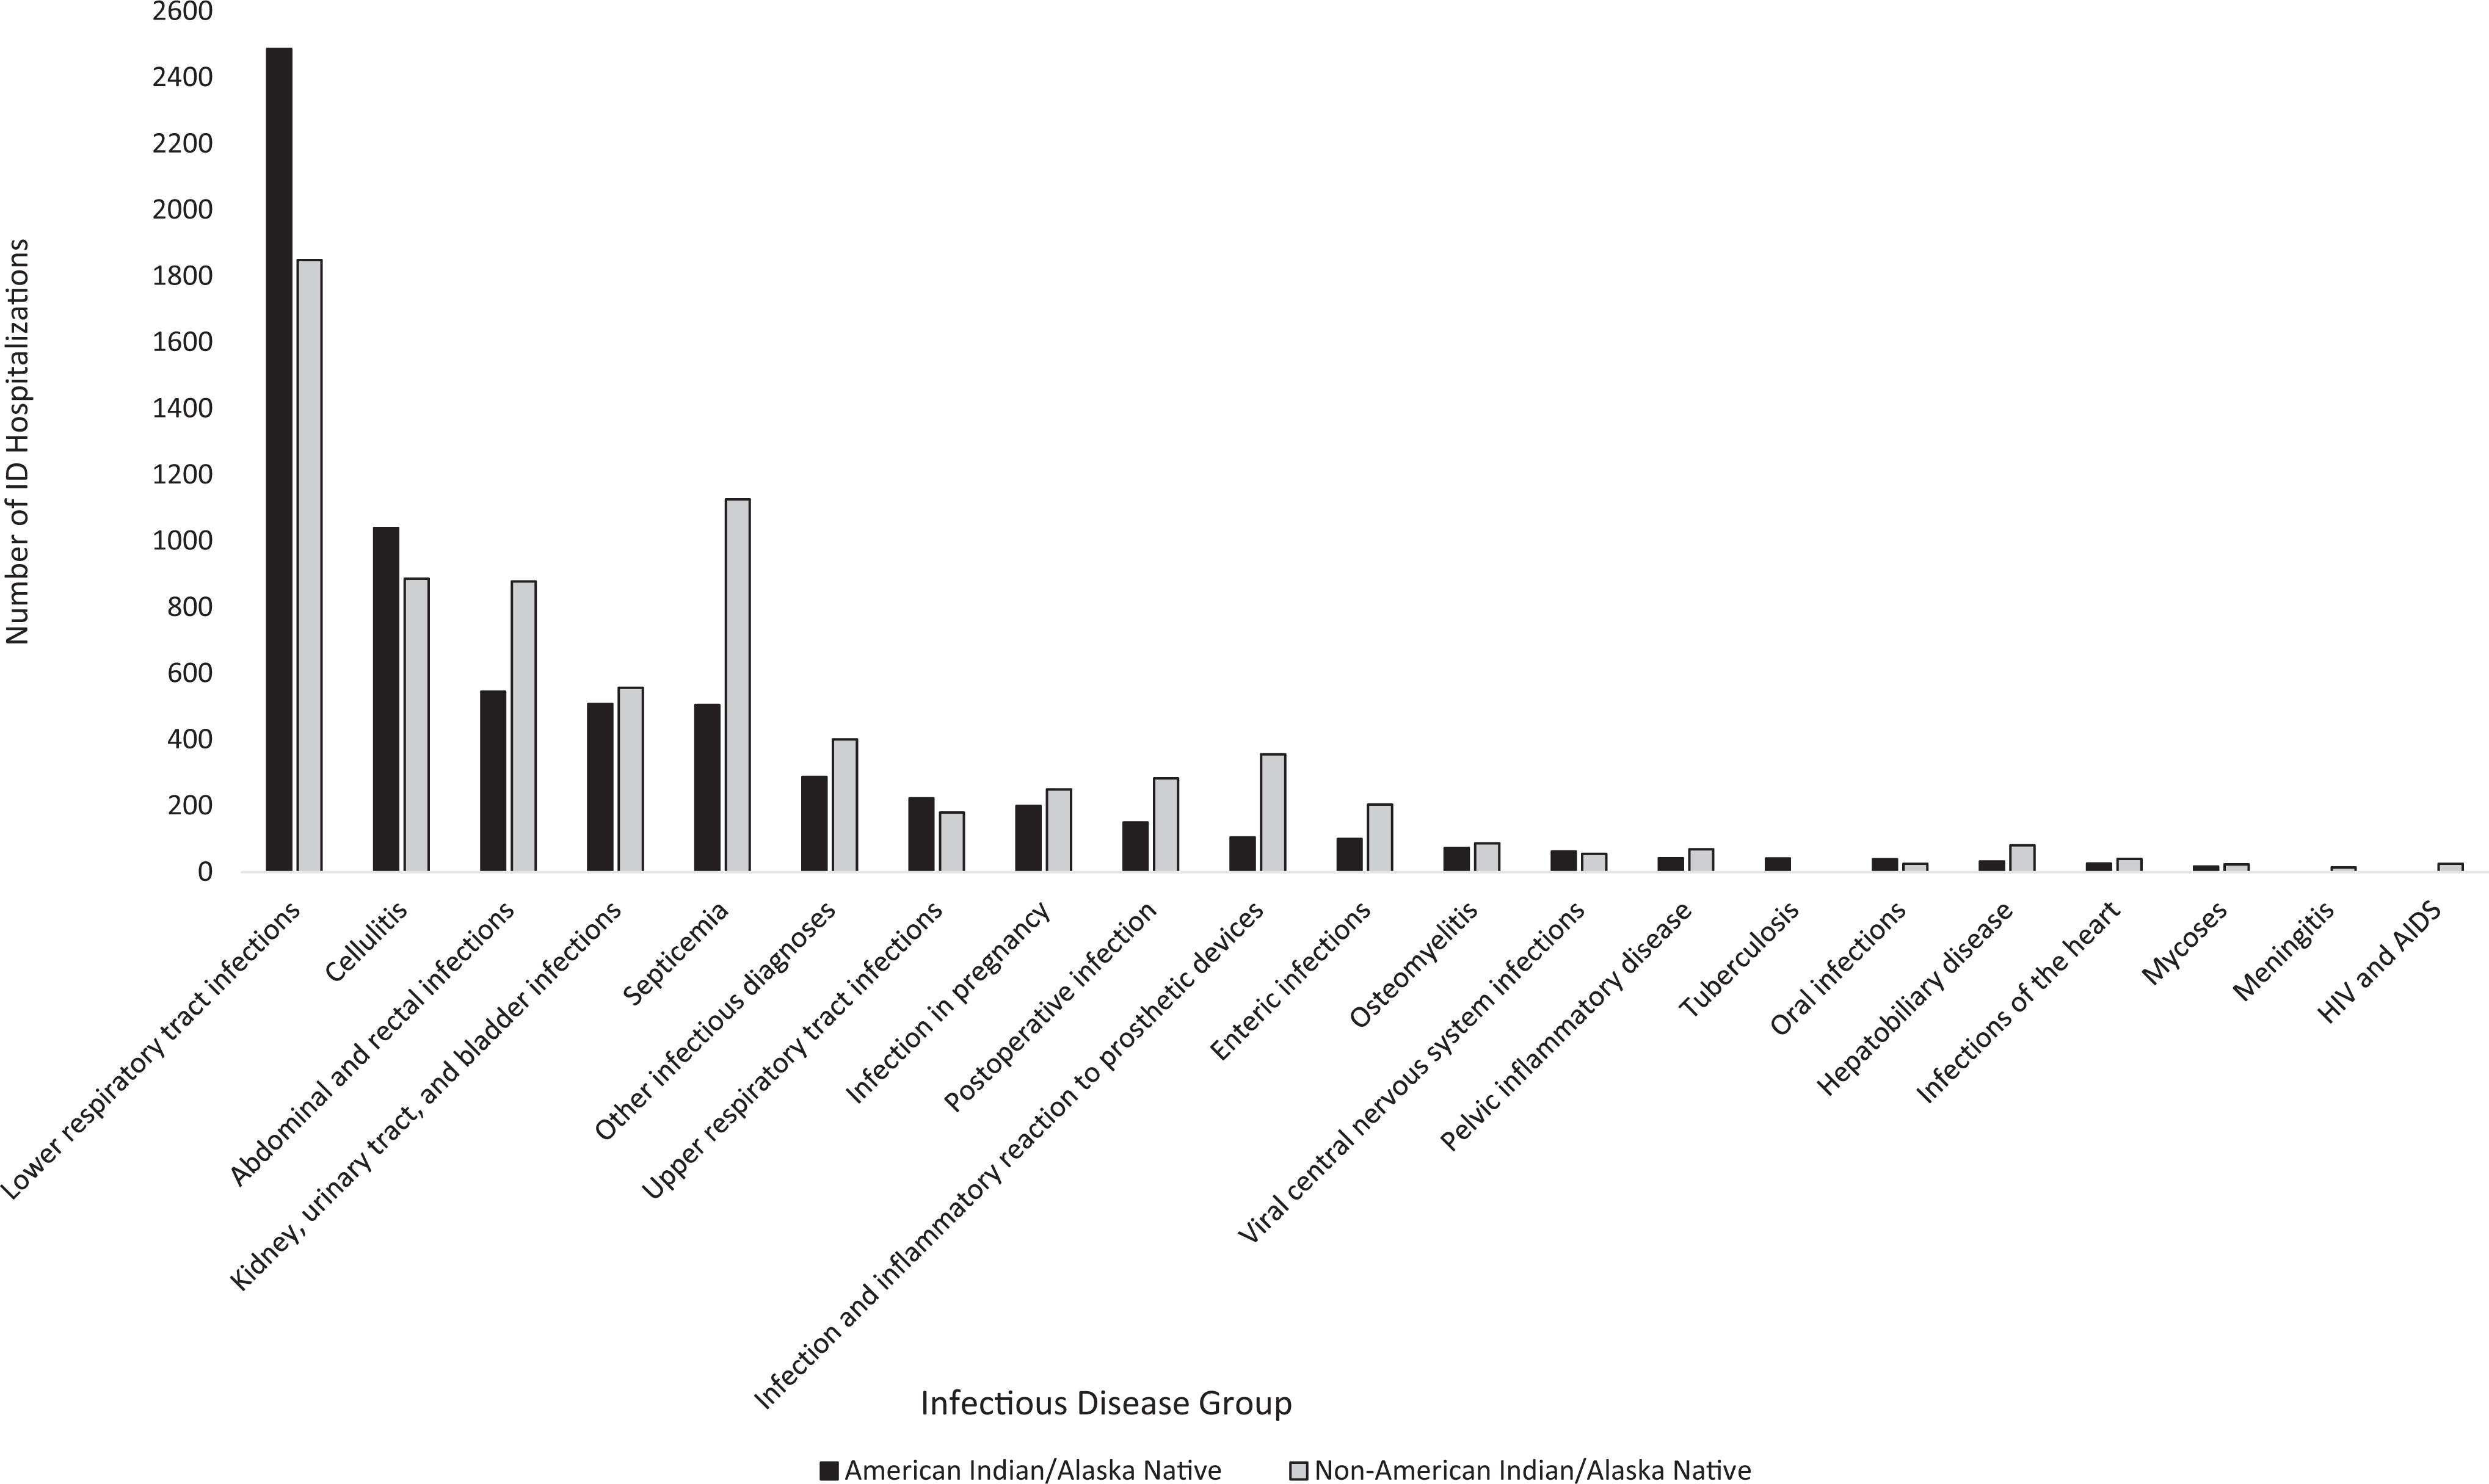
Frequency of infectious disease (ID) hospitalizations among American Indian/Alaska Native (n = 6501) and non–American Indian/Alaska Native (n = 9397) persons in Alaska, 2010-2011. Perinatal infection was excluded for both groups because there were <10 hospitalizations in each group for which perinatal infection was the discharge diagnosis. Data sources: Indian Health Service 11 and Alaska State Inpatient Database. 12 Abbreviation: HIV, human immunodeficiency virus.
All average annual age-specific ID hospitalization rates were significantly higher among AI/AN persons than among non-AI/AN persons for all ID diagnosis groups with a sufficient number of hospitalizations for analysis, with 2 exceptions. The differences in hospitalization rates between AI/AN and non-AI/AN persons were not statistically significant for enteric and postoperative infections in those aged 0-19 (RR = 1.6, P = .06, and RR = 1.8, P = .11, respectively; Table 2).
The highest average annual age-specific ID hospitalization rates per 100 000 population among AI/AN persons aged 0-19 were 1181 for LRTI, 219 for abdominal-rectal infections, and 217 for cellulitis. Among non-AI/AN persons, the highest ID hospitalization rates per 100 000 population for those aged 0-19 were 195 for LRTI, 87 for abdominal-rectal infections, and 37 for upper respiratory tract infections. For adults aged 20-49, the highest ID hospitalization rates per 100 000 population among AI/AN persons were 381 for cellulitis, 300 for infections in pregnancy, and 191 for LRTI. Among non-AI/AN adults aged 20-49, the highest ID hospitalization rates per 100 000 population were 92 for infections in pregnancy, 78 for abdominal-rectal infections, and 66 for cellulitis. Finally, for those aged ≥50, the highest ID hospitalization rates per 100 000 population among AI/AN persons were 1693 for LRTI, 659 for cellulitis, and 566 for septicemia, whereas the highest ID hospitalization rates per 100 000 population among non-AI/AN persons were 305 for LRTI, 261 for septicemia, and 134 for cellulitis (Table 2).
Associated Non-ID Diagnoses
The most frequently listed non-ID diagnoses among ID hospitalizations in Alaska were essential hypertension in 19% (1234 of 6501) of discharges for AI/AN persons and 24% (1754 of 7397) for non-AI/AN persons and tobacco use disorder in 18% (1166 of 6501) of discharges for AI/AN persons and 15% (1082 of 7397) for non-AI/AN persons. Asthma (9%, 221 of 2347) was the third-most common non-ID diagnosis among AI/AN persons aged 0-19, but it was not a common diagnosis among their non-AI/AN peers (Table 3). Tobacco use disorder was the most common non-ID diagnosis listed among AI/AN persons (35%, 619 of 1780) and non-AI/AN persons (25%, 501 of 1967) aged 20-49. Tobacco use disorder was the second-most frequently listed diagnosis among AI/AN persons (21%, 497 of 2374) but the fifth-most frequently listed diagnosis among non-AI/AN persons (14%, 556 of 3966) aged ≥50. In this same age group, chronic airway obstruction was listed in 15% (364 of 2374) of records of AI/AN persons, but it was not a common diagnosis for non-AI/AN persons.
Ranka and percentage of non-IDs associated with ID hospitalizations among AI/AN (n = 6501) and non-AI/AN (n = 7397) persons in Alaska, overall, by sex, and by age group, 2010-2011b
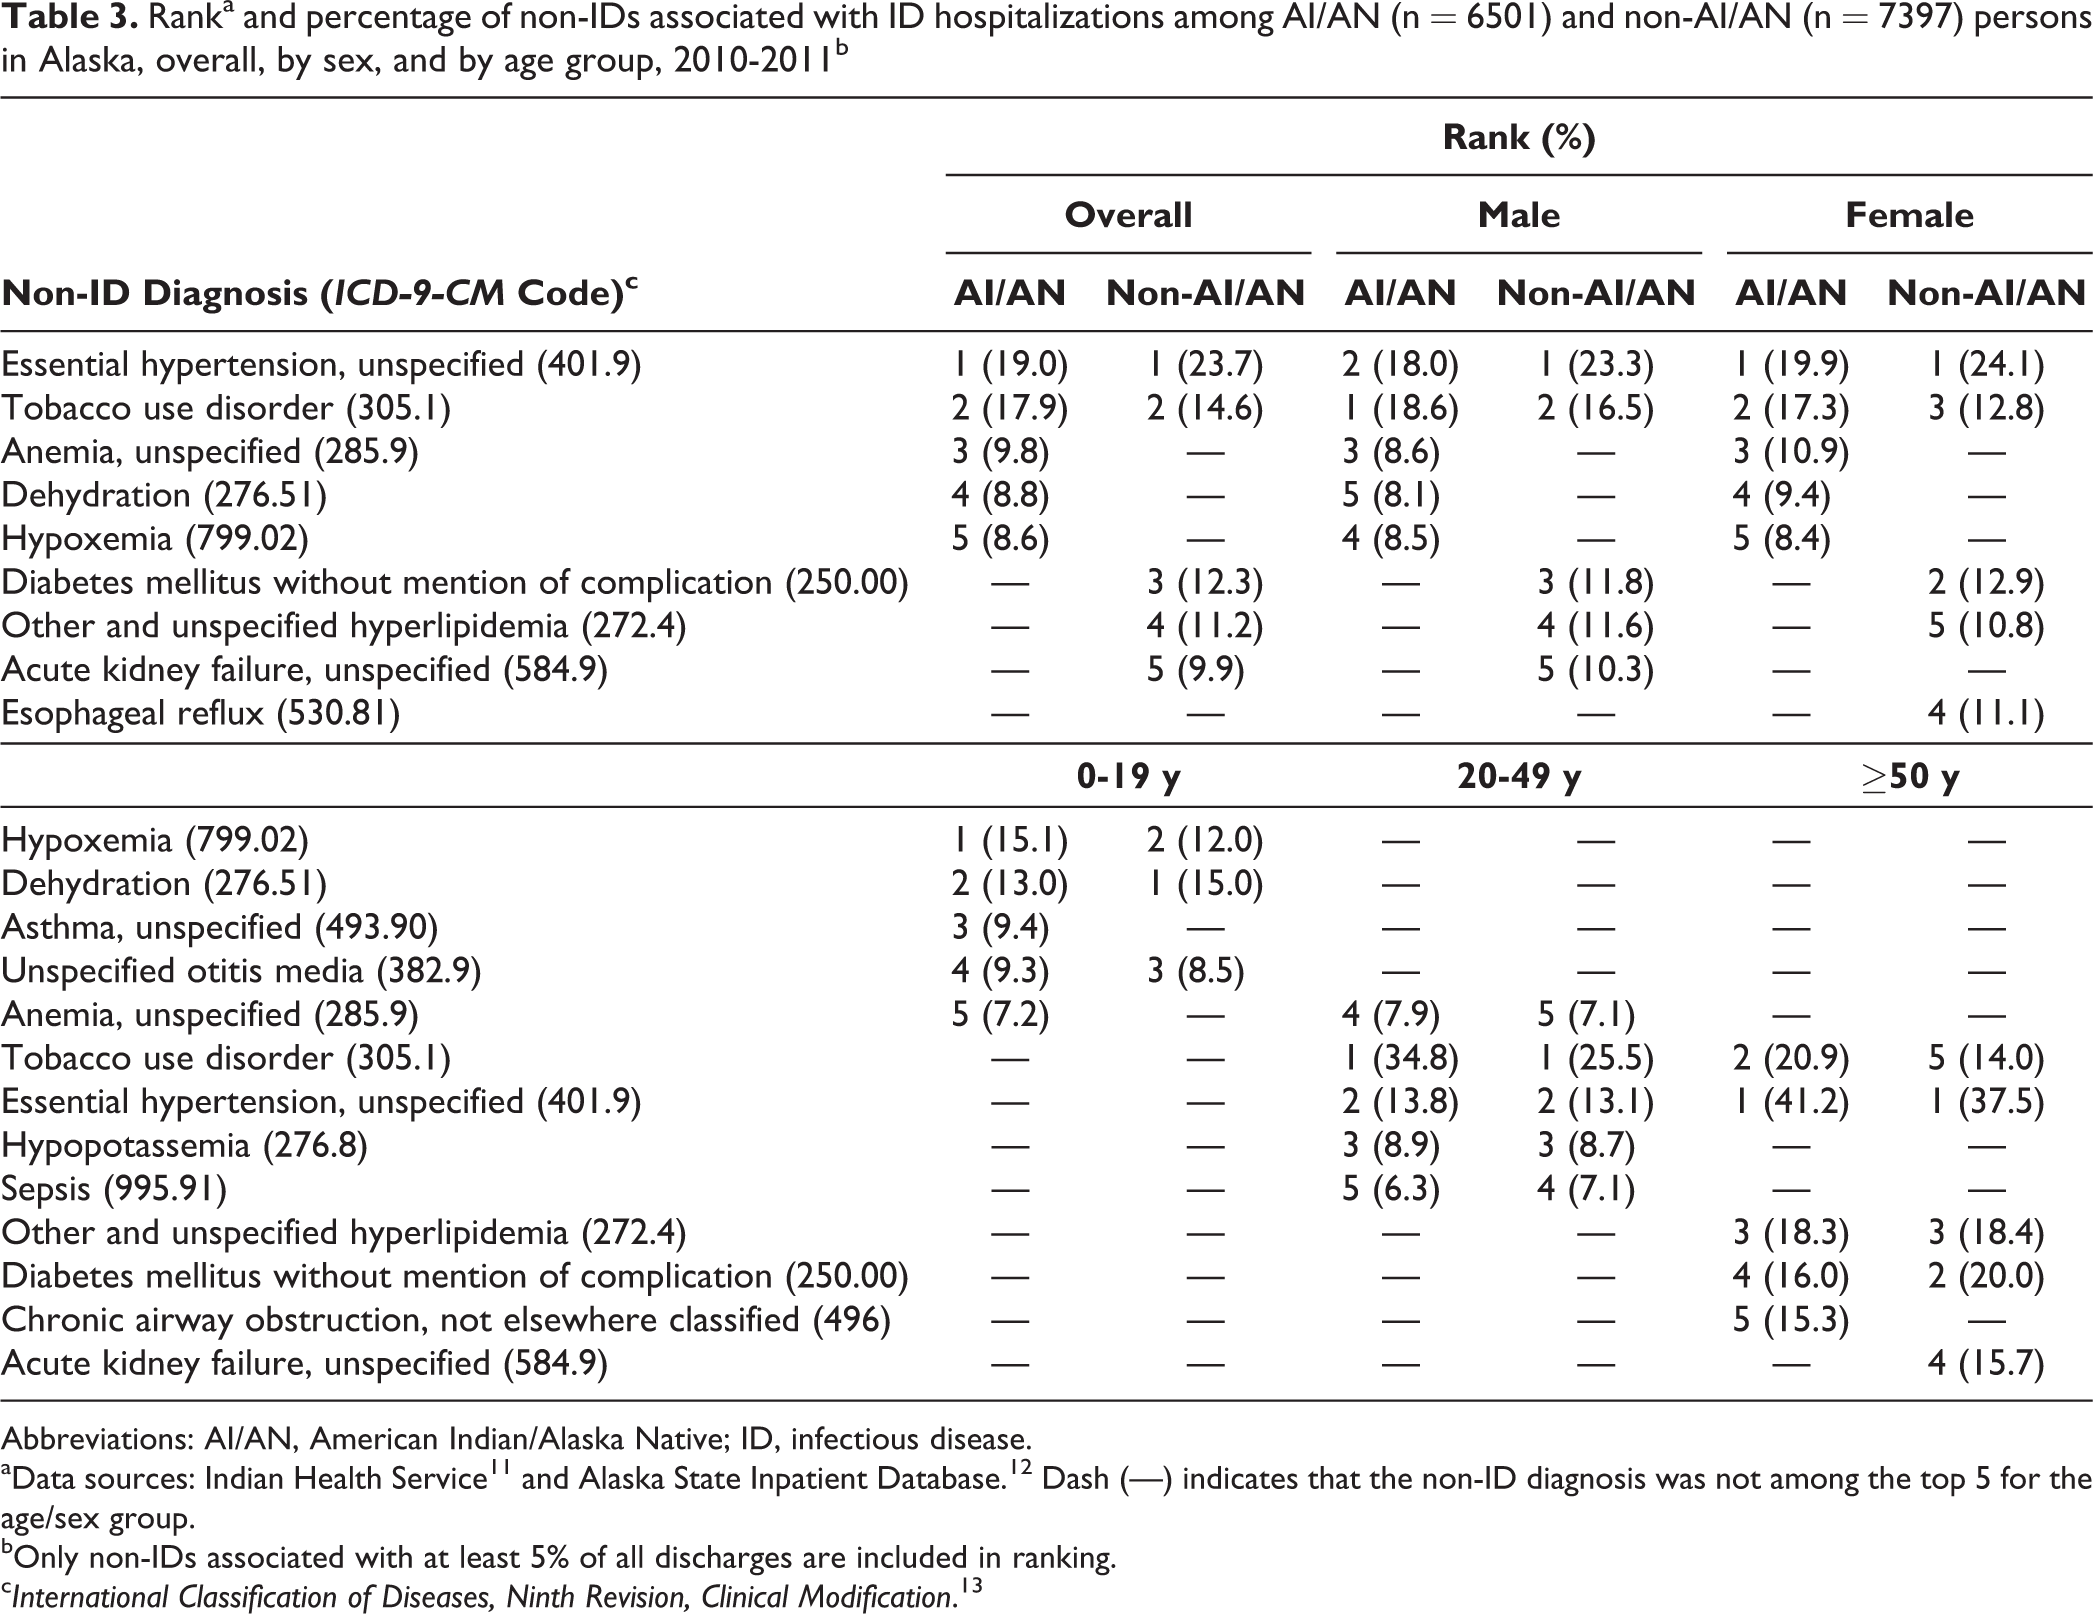
Abbreviations: AI/AN, American Indian/Alaska Native; ID, infectious disease.
aData sources: Indian Health Service 11 and Alaska State Inpatient Database. 12 Dash (—) indicates that the non-ID diagnosis was not among the top 5 for the age/sex group.
bOnly non-IDs associated with at least 5% of all discharges are included in ranking.
c International Classification of Diseases, Ninth Revision, Clinical Modification. 13
Discussion
Using a merged statewide Alaska hospital discharge data set to investigate ID hospitalizations among AI/AN and non-AI/AN persons during 2010 and 2011, we detected important ID health disparities among AI/AN persons in Alaska. Most important, we found that AI/AN persons were 3 times more likely than non-AI/AN persons to be hospitalized with IDs. The ID hospitalization disparity was highest among children <5 years but persisted through all age groups. We also observed that LRTI was the most common reason for ID hospitalization among AI/AN persons and that AI/AN persons were more likely than non-AI/AN persons to be hospitalized for LRTI.
To our knowledge, this study is the first to use a single state database of hospital discharges from both tribal and nontribal hospitals to evaluate ID hospitalizations. Unlike previous studies that were based primarily on hospitalization data from IHS/tribal facilities, we used a database that included AI/AN persons hospitalized within and outside IHS/tribal facilities. Use of this database allowed us to generate a possibly more comprehensive estimate of ID hospitalization rates for AI/AN persons in Alaska than previous studies. For example, the annual age-adjusted ID hospitalization rate for AI/AN persons in our study (2697 per 100 000 population) was 31% higher than the analogous rate (2063 per 100 000 population) reported for the IHS Alaska region from 2004 to 2006, when only IHS and tribal inpatient direct and contract health care data were used. 5
In addition, the database that we used allowed us to eliminate some potential biases observed in previous studies resulting from the use of different denominators when comparing populations. Instead, we were able to use the same reference population to calculate hospitalization rates for AI/AN and non-AI/AN persons. We were also able to compare the annual age-adjusted ID hospitalization rate for AI/AN persons in Alaska with the ID hospitalization rate for non-AI/AN persons in Alaska (730 per 100 000 population) rather than with the rate for the general US population (1610 per 100 000 population for 2004-2006). 5 Such differences suggest that previous studies comparing the ID hospitalization rates of AI/AN persons with those of the general US population may have substantially underestimated ID health disparities of AI/AN persons in Alaska. At this time, however, a single merged IHS region database that includes IHS/tribal and non-IHS/tribal hospitalization data exists only in Alaska. Consequently, studies examining differences in hospitalization rates among AI/AN persons in other IHS regions will continue to rely on comparisons with the general US population, and results from those studies may continue to underestimate the disparities between AI/AN and non-AI/AN persons.
The substantial disparity in ID hospitalization rates between AI/AN and non-AI/AN persons may have at least 2 possible causes. First, because a higher percentage of the AI/AN population lives in rural areas, they may have greater exposure to environmental risk factors for infection. 19 Several studies reported a higher overall risk for ID among AI/AN persons living in rural versus urban areas of Alaska. 20,21 Many rural Alaskan communities lack in-home piped water and flush toilets; inadequate access to water and sanitation services is associated with increased risks for respiratory and skin infections. 21,22 Household crowding is also more common in rural communities, which can facilitate ID transmission among household members. 19,23 Finally, homes in rural communities rely on indoor wood-burning stoves, which create poor indoor air quality and increase the risk for respiratory infections, especially among children. 24 Our findings suggest that AI/AN persons may benefit from programs that aim to improve access to water, sanitation, and alternative sources of heat in rural areas.
A second cause of the disparity in ID hospitalizations between AI/AN and non-AI/AN persons may be a higher prevalence of chronic diseases that predisposes AI/AN persons to IDs. In our study, LRTI was the most common reason for ID hospitalizations among AI/AN persons. Chronic respiratory diseases, which we found to be more common among AI/AN persons than among non-AI/AN persons, may increase the likelihood of hospitalization among persons with LRTI. We observed that an associated asthma diagnosis was more common among AI/AN persons aged 0-19 than among their non-AI/AN peers, whereas an associated diagnosis of chronic airway obstruction was more common among AI/AN persons aged ≥50 than among their non-AI/AN peers. We also noted that LRTI was the ID hospitalization diagnosis for >38% of AI/AN persons but only 25% of non-AI/AN persons. Other studies showed that LRTI can lead to exacerbations of asthma and chronic obstructive airway disease. 25 –27 Although LRTI may be amenable to outpatient treatment in otherwise healthy persons, it may be more likely to require hospitalization for those with asthma or chronic obstructive airway disease. Thus, the higher prevalence of chronic respiratory diseases in AI/AN persons may lead to a relatively higher number of LRTI hospitalizations. 28 On a related note, smoking increases the risk of LRTI and causes chronic obstructive airway disease. 29,30 Smoking as a risk factor for LRTIs is particularly relevant to the AI/AN population because some studies have found a high prevalence of tobacco use and diseases related to tobacco use in this group. 5,31,32 Together, these findings suggest that AI/AN persons would likely benefit from public health policy and programs focused on curbing tobacco use and promoting influenza vaccination. The results also support the recent recommendation for vaccinating adults aged ≥65 with the 13-valent pneumococcal conjugate vaccine. 33
Limitations
This study had several limitations. First, ID diagnoses can be miscoded or not coded on the hospital discharge record. 34 We attempted to minimize this potential bias by restricting our analysis to only those hospitalizations with an ID diagnosis as the first of up to 15 listed on the discharge record, rather than by relying on ID diagnoses that were lower on the lists and may have been prone to inaccurate coding. This restriction may have led to an underestimation of the burden of ID hospitalizations. Second, persons requiring transfer to another hospital or readmission for the same health problem would have had their hospitalizations counted twice in our study, thereby overestimating hospitalization rates. Third, several studies showed that AI/AN persons are more likely than non-AI/AN persons to be misclassified as another race. 35 –37 Such race misclassification would most likely have resulted in an underestimation of the disparity in ID hospitalization rates.
Fourth, despite having the same ID, AI/AN persons may be hospitalized less frequently than their non-AI/AN counterparts. For example, during the 2009 H1N1 influenza pandemic, AI/AN persons were more likely than non-Hispanic white persons to report influenza-like illness symptoms, but they were less likely to be hospitalized for influenza. 38 If this phenomenon occurred with IDs during the study period, our use of hospitalization rates would have underestimated the disparity in ID hospitalizations between AI/AN and non-AI/AN persons. Fifth, one nonfederal community-based acute care hospital did not participate in the Alaska State Inpatient Database, which may have reduced the state ID hospitalization rates in our study. However, most patients admitted to the nonparticipating hospital were non-AI/AN persons; as such, its impact on the hospitalization rates for AI/AN persons was likely minimal. Finally, we could not adjust for other potential confounding factors that could have affected our estimate of the ID hospitalization disparity. For example, the location of patients’ residence was not recorded in the Alaska State Inpatient Database. Some of the differences in the observed ID hospitalization rates among AI/AN versus non-AI/AN persons could have resulted from differences in the proportion of each population that lives in rural Alaska.
Conclusions
IDs accounted for a substantial proportion of all hospitalizations in Alaska, and AI/AN persons had a disproportionate share of ID hospitalizations when compared with non-AI/AN persons. LRTI was the most common reason for ID hospitalization among AI/AN persons in Alaska. AI/AN persons are likely to benefit from public health programs and policies that aim to curb tobacco use, improve access to water and sanitation, and maintain high coverage of influenza and pneumococcal vaccines. In addition, the results of this study may serve as a baseline for evaluating the impact of programs and policies aimed at reducing IDs in Alaska.
Footnotes
Acknowledgments
We thank Jason Mehal (Centers for Disease Control and Prevention), Kirk Greenway (Indian Health Service), and Barbara Strzelczyk (Indian Health Service) for their technical assistance, as well as staff members at all of the Alaska hospitals involved in our study. We also thank the Alaska State Hospital and Nursing Home Association for participating in the Healthcare Cost and Utilization Project.
Declaration of Conflicting Interests
The author(s) declared no potential conflicts of interest with respect to the research, authorship, and/or publication of this article.
Funding
The author(s) disclosed receipt of the following financial support for the research, authorship, and/or publication of this article: This study received in-kind support (no grant support) from the Centers for Disease Control and Prevention, Indian Health Service, and Agency for Healthcare Research and Quality. The findings and conclusions in this article are those of the authors and do not necessarily represent the official position of the Centers for Disease Control and Prevention or the Agency for Healthcare Research and Quality. Preliminary results from this study were presented at the 16th International Congress on Circumpolar Health, Oulu, Finland, June 10, 2015.