
Abstract
Situation models, mental representation of events that are unfolding in the environment, are known to help structure our experiences in our memory, but what exactly are the ingredients of a situation model and to what degree do abstract event features contribute to the updating cycle of a situation model? Here, we used an event card experiment in which we systematically manipulated abstract event feature dimensions (e.g., narrative X has a location change from event 1 to 2) and narrative specific factors (e.g., John walked from the kitchen into the living room after having a coffee). During this experiment, participants actively constructed a narrative from a random order of event descriptions, presented as event cards. After narrative construction, memory of the narrative specific events was tested in an oddball paradigm. We investigated the influence of the abstract factors “degree of feature change” and “position within the story” on response speeding during the oddball task. We discovered that participants were faster for oddballs with a different degree of feature change, which interacted with whether the oddball was from within the same story or from another story. When zooming in on oddballs from other stories only, we found an interaction between position within the event structure and degree of feature change. Our results suggest that people make use of an abstraction for keeping track of an event feature space and narrative specific representations. These abstractions of event features are important for the instantiation of a situation model.
Introduction
In everyday life, we seamlessly remember and integrate experienced events into a coherent life story. Events that happen in the afternoon, like you applying moisterizing cream to your skin after you took a shower, can be linked back to events in the morning, like you getting sunburned on a beach trip with your friends. We do this on the fly, with the purpose to glue events and experiences together into a coherent understanding of the world around us. But how do we do this? And what components of events are important for this?
Event Segmentation Theory
One theory behind event processing is called event segmentation theory (EST). In event segmentation theory, perception and memory are organized into discrete and hierarchically structured events. An event represents a segment in time and contains information about core components that make up an event, like locations, characters, objects and state changes of these characters and objects (Huff et al., 2014; Su & Swallow, 2024). We use so called situation models of our experiences, mental representations of how events unfold in our environment, which can be constructed and updated (Brich et al., 2024; Ferstl & von Cramon, 2002; Kumar et al., 2023; Kurby & Zacks, 2008; Magliano et al., 2014; Pettijohn & Radvansky, 2016; Radvansky & Zacks, 2014; Rouhani et al., 2020; Speer et al., 2003, 2007; Wahlheim et al., 2022; Zacks et al., 2007). This updating of these situation models is initiated upon the beginning of a new event. Incoming sensory information is compared to a current mental model of the environment, which determines the fit between the new information with the current situation model. Incompatible or new information for the current model indicates an event boundary, a marker for the end of an old and the beginning of a new event. At such an event boundary, the current situation model is indeed updated. However, while there is a lot known about how situation models use event boundaries and retrieval of past event features for updating (Hermann et al., 2021), less is known about the precise function of the various core features of events in situation model updating. Participants make inferences about upcoming events based on their position in a sequence and rely on episodic event representations to make these sequential inferences (DuBrow & Davachi, 2013; Kurby & Zacks, 2008). For successful event segmentation, one needs to keep track of changes in several core event components. There are five key event components, including changes in time, location, characters (as well as object-state changes), intentions and causation (Huff et al., 2014), as originally proposed by the event-indexing model (Zwaan et al., 1995). You can view these event components at the level of specific narratives (e.g., “John walked from the kitchen into the living room after having a coffee”, which represents a change in location) but also at a more abstract level (e.g., narrative X has a location and object state-change from event 1 to event 2). Thus, abstractions of these core event components would be formalized in a more generic way which would mean it can be implemented and used in various narratives (Cohn, 2019; Lee & Chen, 2022). Here, we investigated if we keep such abstractions from core event components in mind during situation model updating. For this purpose, we used narratives as stimulus material. Narratives are increasingly often used as stimulus material to study memory function and event processing, because of its larger ecological validity compared to traditional lab stimuli. Similar to real life, narratives consist of related events that unfold over time and are rich in semantics and emotional content (Lee et al., 2020).
Hypothesis
We hypothesize that our brain holds these abstractions of core event components in mind as placeholders for event-specific information. Concepts are suggested to be represented in a distributed manner at different levels of abstraction (Morton et al., 2020). In line with this, Constantinescu et al. (2016) indicates that we have global relational codes that allow us to represent conceptual knowledge as a mental map. Narrative processing is therefore supported by an active event segmentation process, in which abstraction provides a placeholder for event specific information. While event segmentation theory has been linked to a variety of cognitive domains, event segmentation in narrative processing still requires deeper investigation. It remains to be elaborated what exactly the ingredients of a situation model are and to what degree abstract event features contribute to the updating cycle of such a model.
Current Study
To that end we make use of a newly designed event card experiment, in which we manipulate abstract event feature dimensions and narrative specific factors, like the position of described events within a narrative (i.e., position resembling a change in time, which is one of the key event features, Huff et al., 2014). In a two part validation approach, we let participants actively construct a narrative from a random order of event descriptions, presented as event cards. We tested participants’ memory for the narratives implicitly in an oddball paradigm, relying on repetition priming to influence reaction times when related events follow each other compared to events unrelated to each other (Schacter & Buckner, 1998). We measured response speeding to the oddball event cards and hypothesized that reaction times will be influenced by an interaction between oddball cards from within the same narrative (i.e., out of order cards) or from a different narrative, and the degree of abstract event feature change. Investigating this hypothesis will allow us to draw conclusions about whether abstract event features contribute to updating of a situation model. We also expected to observe an interaction as reflected by reaction times between event position within a narrative and the degree of change of abstract event features. Furthermore, we also investigated the influence of visual similarity between event cards on overall reaction times to determine whether visual similarity might be a factor to take into account when drawing conclusions on our main research question.
Result Summary
In short, we were able to show that abstractions of factors like narrative, narrative position and changes in an event feature space have an influence on how participants are able to remember and segment events. We argue that people are able to use an abstraction of event features (e.g., narrative has location change from event 1 to event 2) as an important contribution for the instantiation of a situation model, while low level factors like visual similarity represent only a minor contribution.
Materials & Methods
Participants
100 participants (mean age 29 years, range 18-63, 50 males) participated in the experiment. The experiment took place online. Participants were recruited on Prolific (https://www.prolific.co/) and were Dutch native speakers. Participants completed the experiment on Gorilla (https://gorilla.sc) and were sent back to Prolific after completion. Participants gave written informed consent before participating in the experiment. The study was approved by the local ethics committee (CMO Arnhem-Nijmegen, Netherlands). The data of three participants were excluded from further analyses because they did not finish the experiment.
Stimulus Material
For the experiment, twelve stories were created (see https://osf.io/ydpsk/), and each story consisted of six events. Each event was designed as an event gaming card with a front and a back. The back of each event card contained a written description of the event, while the front of the card displayed the specific event visually. The written event description always concerned a protagonist who found himself in a particular event situation. Five key dimensions including location, character, character state change, object and object state change were used as ingredients for the event description. These key dimensions were a priori defined based on the work of Huff et al. (2014) and Zwaan et al. (1995), identifying core components that make up an event. All event descriptions were written in Dutch and had an average length of 47 words with a standard deviation of 11.3.
The front of the event cards displayed a visual representation of the end state of an event. We used the end state given this is the eventual state that participants would remember the event features as for that particular event. For that, the card was subdivided into five sections. Four of these sections were reserved for the corners of the card. These corners had a white square as background and were placeholders for characters and objects. Characters were always put into the upper and lower corner on the left side of each card, while objects were put on the right side of each card. Characters and objects were always presented in their end state, which means that whenever for example an object was described to break within the event, a broken object was also displayed visually on the front of the card. The last section filled in the rest of the event card, which was spared by the white squares in the corners. Within this section, the scenery of the location was depicted. Which and how many of the event features changed was counterbalanced within and across stories (see Appendix Table 1).
In addition to the six event cards, each story also had a written introduction and an introductory story image. Together, these were meant to on the one hand frame the context of the story, and on the other hand the image was used later as a story prime in the oddball task. All visual representations were clipart, which in turn were created on Pixton (https://www.pixton.com) and adapted with Adobe Photoshop.
Experimental Procedure
All participants were recruited and preselected on Prolific. Participants had to be Dutch native speakers. Participants conducted the experiment online, from home. Via an external link, participants were led to the experiment on the Gorilla platform. Participants were first presented with a written consent and the instructions of the experiment. They were advised to prevent distraction from their environment by for example turning off their phone. The instruction foreshadowed that they were asked to complete two parts of the experiment: a first part (hereafter referred to as the learning task) in which they were asked to find the correct order of events and memorize it. In a second part, participants’ memory of the previously learned event sequence was tested (hereafter referred to as the oddball task).
During the learning task, participants were first presented with a story introduction, including a story image (e.g., an image of a pyramid), a story title and a written description (see Figure 1(A)). Upon button press, participants proceeded to the actual task, in which they had to find the correct order of an event sequence to fit a story. For that, participants were faced with six event cards on one screen (see Figure 1(B)). Each card’s visual front and written back were displayed at the same time, with the back of the card in the upper row and the belonging front of the card just underneath, in the lower row. The front and the back of each event card were marked with a number between 1 and 6. At the lower part of the screen, a text field was presented in which participants had to type in the correct order of numbers (e.g., 315264) and press ‘Return’ in order to continue to the next story. Only with a correct number entry, the participants were able to proceed. There is no limit as to how often a participant could try. The order of stories and the order of event cards within a story were randomized for each participant. After a correct entry, a succession of individual event card presentations followed (after a 1-s fixation cross display). Each card’s visual front was presented in correct order and individually for 3 seconds in succession. The successive presentation of cards ensured that participants memorized the event visuals and their correct order for the oddball task after the learning task. The successive presentation contained no written text. After the successive event card presentation ended, another 1-s fixation cross display followed and subsequently a new trial began and a new story was introduced. Again an array of 6 event card fronts and 6 event card backs was presented for which the correct order needed to be found. Participants encountered each of the 12 stories only once during the learning part. Stimulus Material. (A) Example of a Story Image (Used to Introduce a Trial in the Learning as Well as Oddball Task) and Introductory Text (Used to Introduce a Trial in the Learning Task, Alongside the Story Image. (B) Example Trial of the Learning task. Participants had to Enter the Correct Number Order to Create a Coherent Story. Stimuli Were in Dutch, but This Example Story Is Translated to English to Explain the Design in This figure. All Twelve Stories (Images as Well as Text) can be Found Online [https://osf.io/ydpsk/]. In This Example, the Correct Order Is: 314526. To Illustrate the Logic as to How the Event Features Change From One Event to the Next, Here in the Fourth Event (on Card 5 in the figure) to the Fifth Event (on Card 2 in the figure), There Is a Change in Location (From Giant Door to Old Grave), Characters Present (From Protagonist “Hero” and Bat Present to Only Protagonist Present), Objects Present (Old Golden Chest Introduced), Obj Change (Chest From Closed to Open)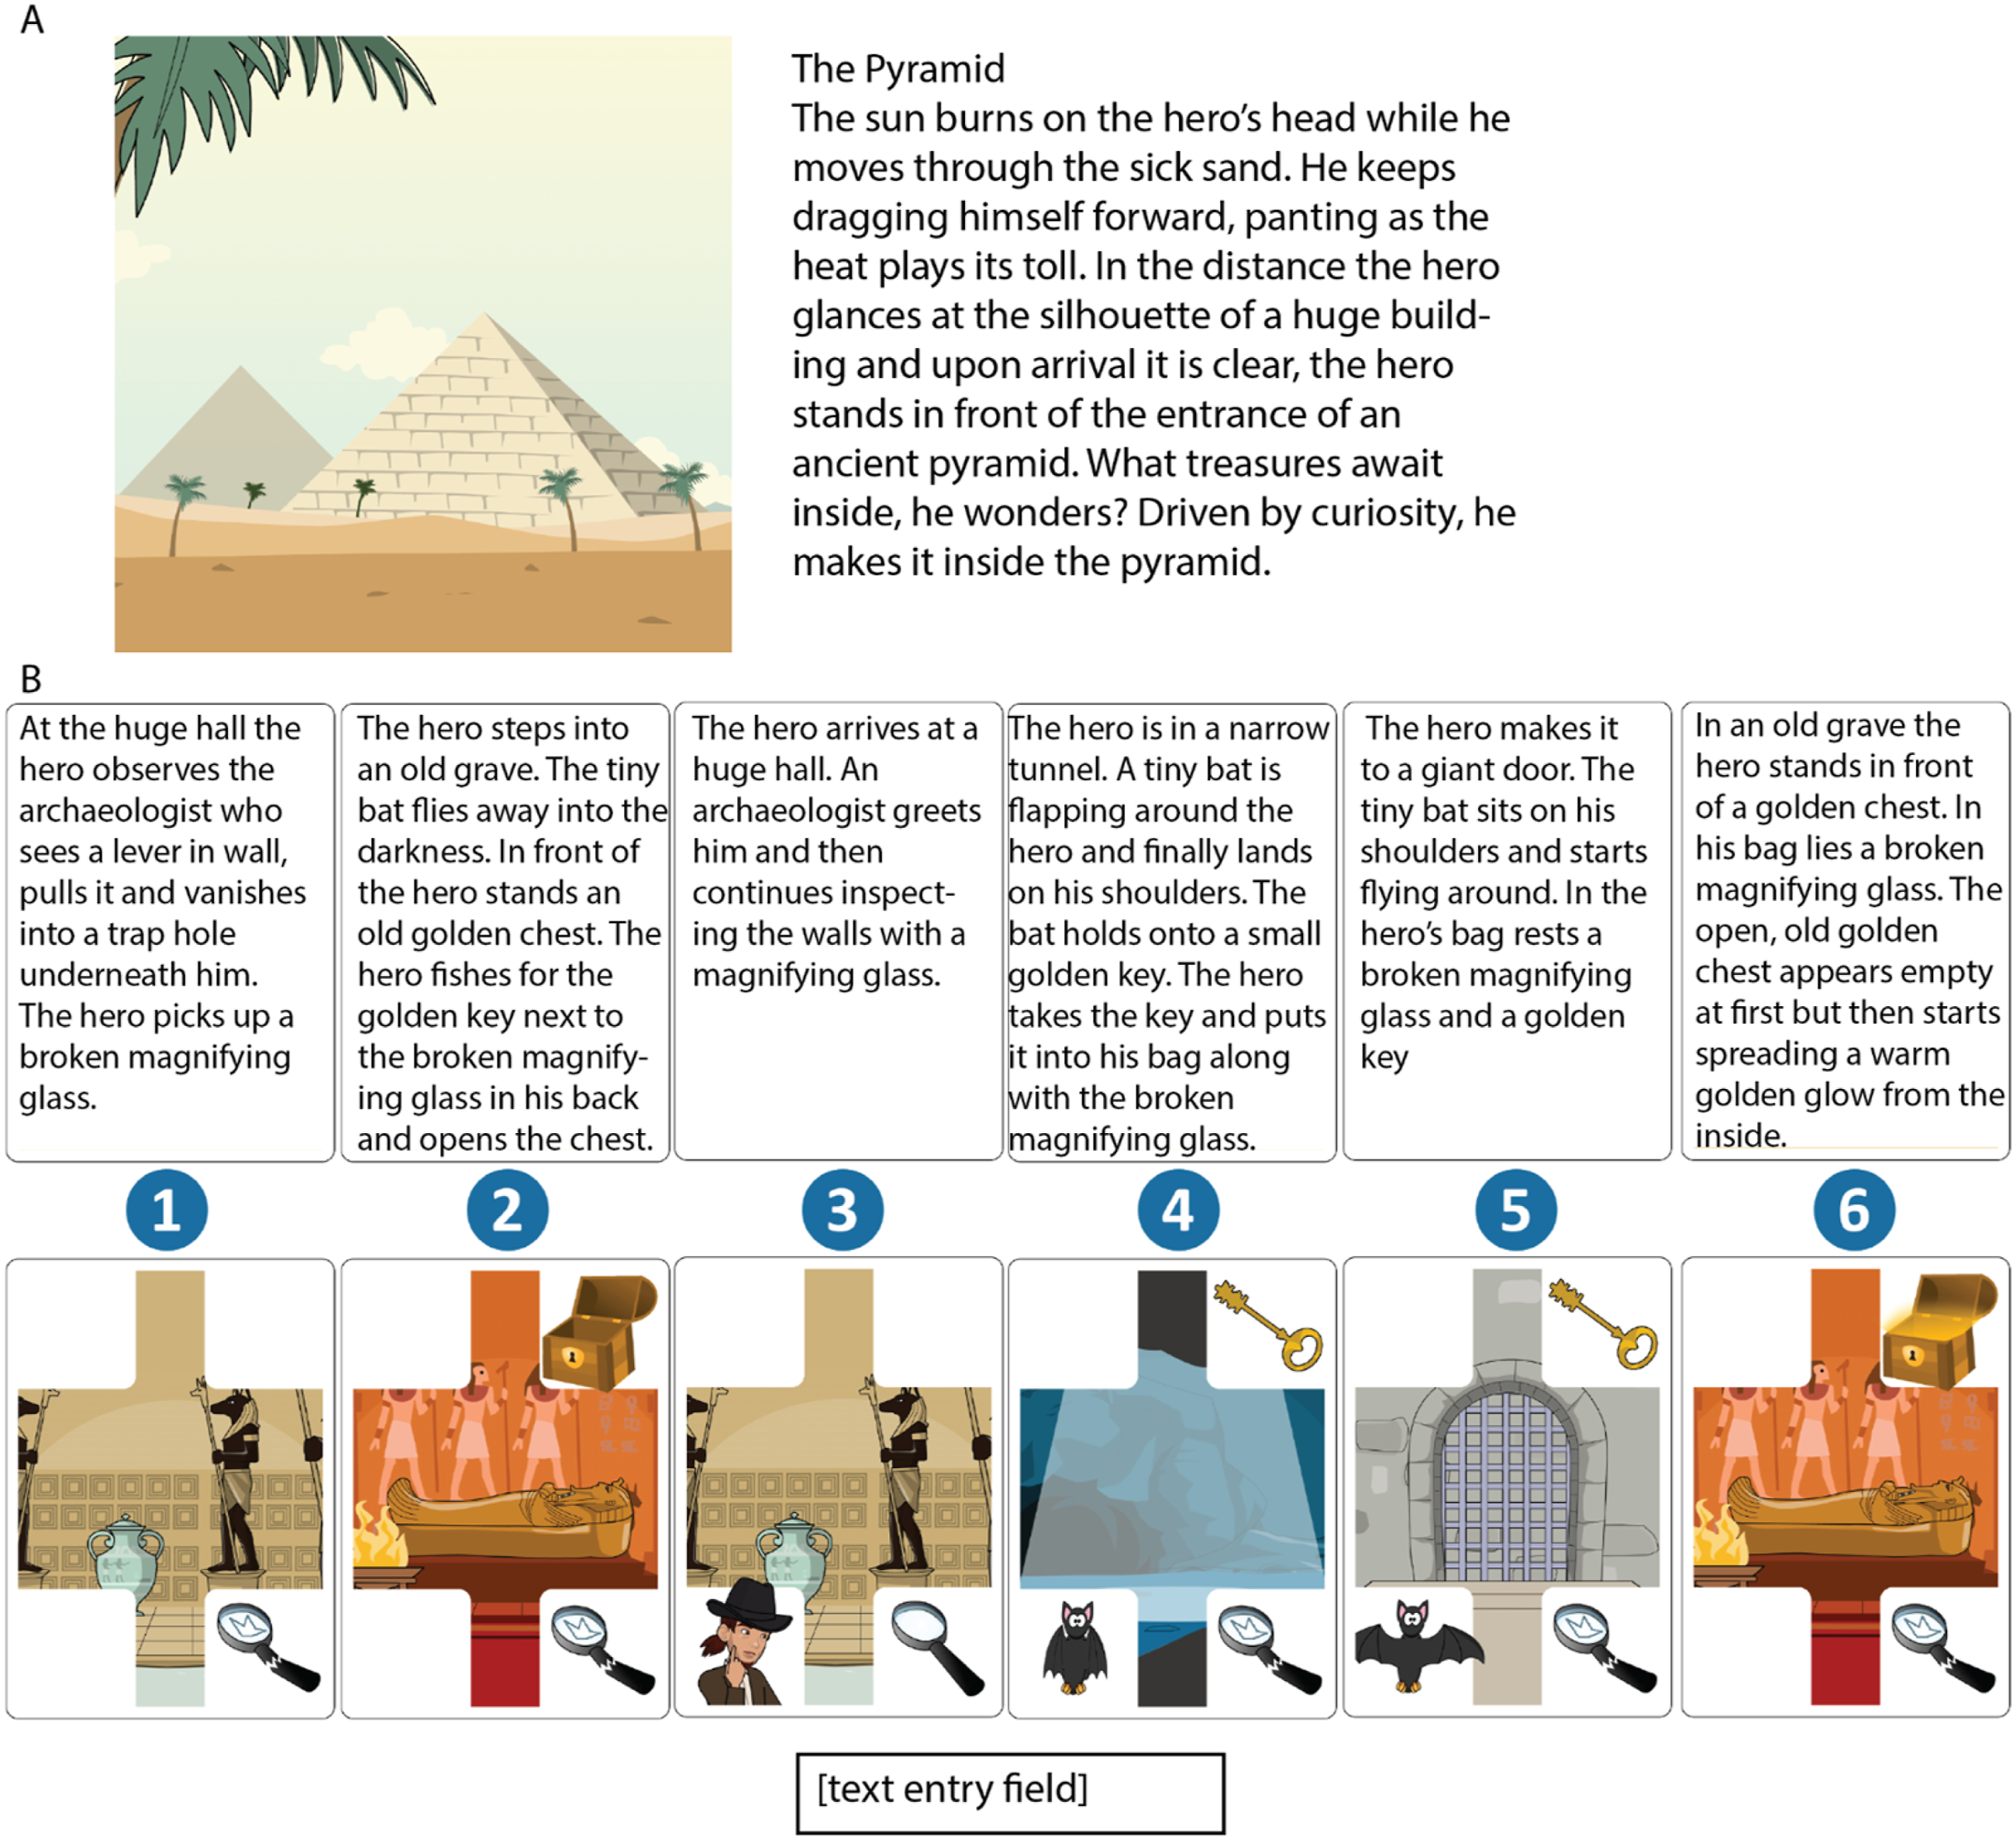
After the correct order of events was found for each of the 12 stories, participants started the oddball task. They were instructed to find and react by button press as quickly as possible to the odd card within a successive event card presentation. For that, each trial began with the display of the story image to prepare participants to recall the correct order of events belonging to that particular story. They had to press a button to start the trial. Subsequently, a 1-s fixation cross display was shown after which each visual front of an event card was displayed in correct order successively for 1,500 ms with an inter stimulus interval of 250 ms in which a fixation cross was displayed. Participants were asked to press their space bar upon identification of an odd event card. After button press, feedback was presented underneath the card in the form of either a green checkmark for a correct response or a red cross for an incorrect response. After completion of the oddball detection trial, the same order of the event card’s fronts but without any oddball was presented successively, again introduced by the story image. This was to ensure that participants do not forget about the actual events for each story. Images were presented for 3 seconds each. Subsequently, a new trial began. Participants encountered 4 blocks, with each block containing a randomized order of the 12 stories. After each block, participants were able to take a self-paced break. The experiment lasted on average 1.5 hours and after completion, participants were sent back to prolific with a completion code.
For the oddball task, event cards were used that either came from within the same story or from another story. Additionally, the odd event cards were chosen as such that the following dimensions were manipulated: story (within or across), position (same or different) and feature change (same or different). An odd event card could therefore come from either within the same story or from across a different story. It could have the same or a different degree of feature change as the replaced card, and have the same or a different position within the event structure as the replaced card, whenever it came from across a different story. The degree to which these dimensions differed across odd event cards was counterbalanced across the blocks. Each story used for an odd event card from across a story was only used once per block. No specific odd event card was used more than once within and across blocks.
Data Acquisition
All data were recorded online via the Gorilla online experiment environment. Participant’s demographic data was recorded online via Prolific.
Data Analysis
From the learning task, reaction times and number of tries until identification of the correct event sequence per story, were analyzed. For the oddball identification task, number of hits, false positives, misses and reaction times were analyzed. Subject performance was evaluated based on a d-prime calculation (relative performance of hits minus false alarms, Swets et al., 1961), and subjects with a d-prime score of lower or equal to zero were disregarded from all further analyses. Analyses were executed by looking at a story Comparison (within or across) and degree of Feature Change (same or different) interaction, and a Position (same or different) and degree of Feature Change (same or different) interaction separately. This split in the analytic approach was due to an incompatibility of a Comparison and Position interaction, as Position cannot be the same for within a story. In such a case, the oddball would be exactly the original event card, and therefore it would not be classified as an oddball. Hence, the Position and Feature Change interaction only considered oddball hits from across different stories.
In addition to the behavioral data, the visual similarity between an oddball event card and the original card was also investigated. For that, the Python package scikit-image was used, which calculates similarity in the RGB and grayscale space between smaller quadrants of the PNGs of the to be compared cards (van der Walt et al., 2014). The similarity score for the red, green, blue and gray scales was averaged into one score to express overall similarity. A score closer to 1.0 indicates higher similarity. Visual similarity was included in the statistical analyses to control for low level visual differences which could potentially influence reaction times, even after counterbalancing the oddball event cards.
Statistics were evaluated by an ANOVA of the model fit of a linear mixed model. For the Comparison and Feature Change interaction, reaction time was the dependent variable, Comparison and Feature change were modeled as interaction, visual similarity was added as a fixed factor. Participants were modeled as random slope to account for intersubject variability. The Comparison and Feature Change interaction, plus visual similarity were included as random slope as well, resulting in the following model: Reaction Times ∼ Comparison*Feature Change + Visual Similarity + (Comparison*Feature Change + Visual Similarity | Subject). For the Position and Feature Change interaction, a similar model was used by replacing the factor Comparison with Position: Reaction Times ∼ Position*Feature Change + Visual Similarity + (Position*Feature Change + Visual Similarity | Subject). An ANOVA was used on the model fit of these models to get statistical significance (p-values, F-values and degrees of freedom, using Satterthwaite approximations, are reported). Besides that, means and SDs are reported for all factors in all analyses. Effect sizes are calculated using the r2glmm package in R (Edwards et al., 2008).
All general analyses and figures were produced with Python, within the Jupyter Lab environment, including the Pandas package (The pandas development team, 2023). Statistics and the evaluation of the linear mixed model were performed in R, including the lmer package (Kuznetsova et al., 2017).
Results
Learning Task
All subjects included in the analysis also completed the learning task and were able to find the correct event sequence for all twelve stories. On average, participants needed 209.89 seconds (SD = 101.43 s) and 2.08 attempts (SD = 1.41) to find the solution for each story.
Oddball Identification Task
Performance
Performance of the participants was evaluated by calculating d-prime (Figure 2). Overall, an independent sample t-test (two-tailed) indicated that d-prime scores across all subjects (M = 6.10e-17, SD = 2.82e-16) were significantly greater than zero (t (59) = 10.12, p < .001). The effect size was very large, with Cohen’s d = 1.87. This result indicates that overall participants performed the task well. Participants that were on average scoring below zero were excluded from further analysis, leaving 63 participants for the subsequent analysis pipeline. D-Prime Scores Across all Participants, Averaged Across Stories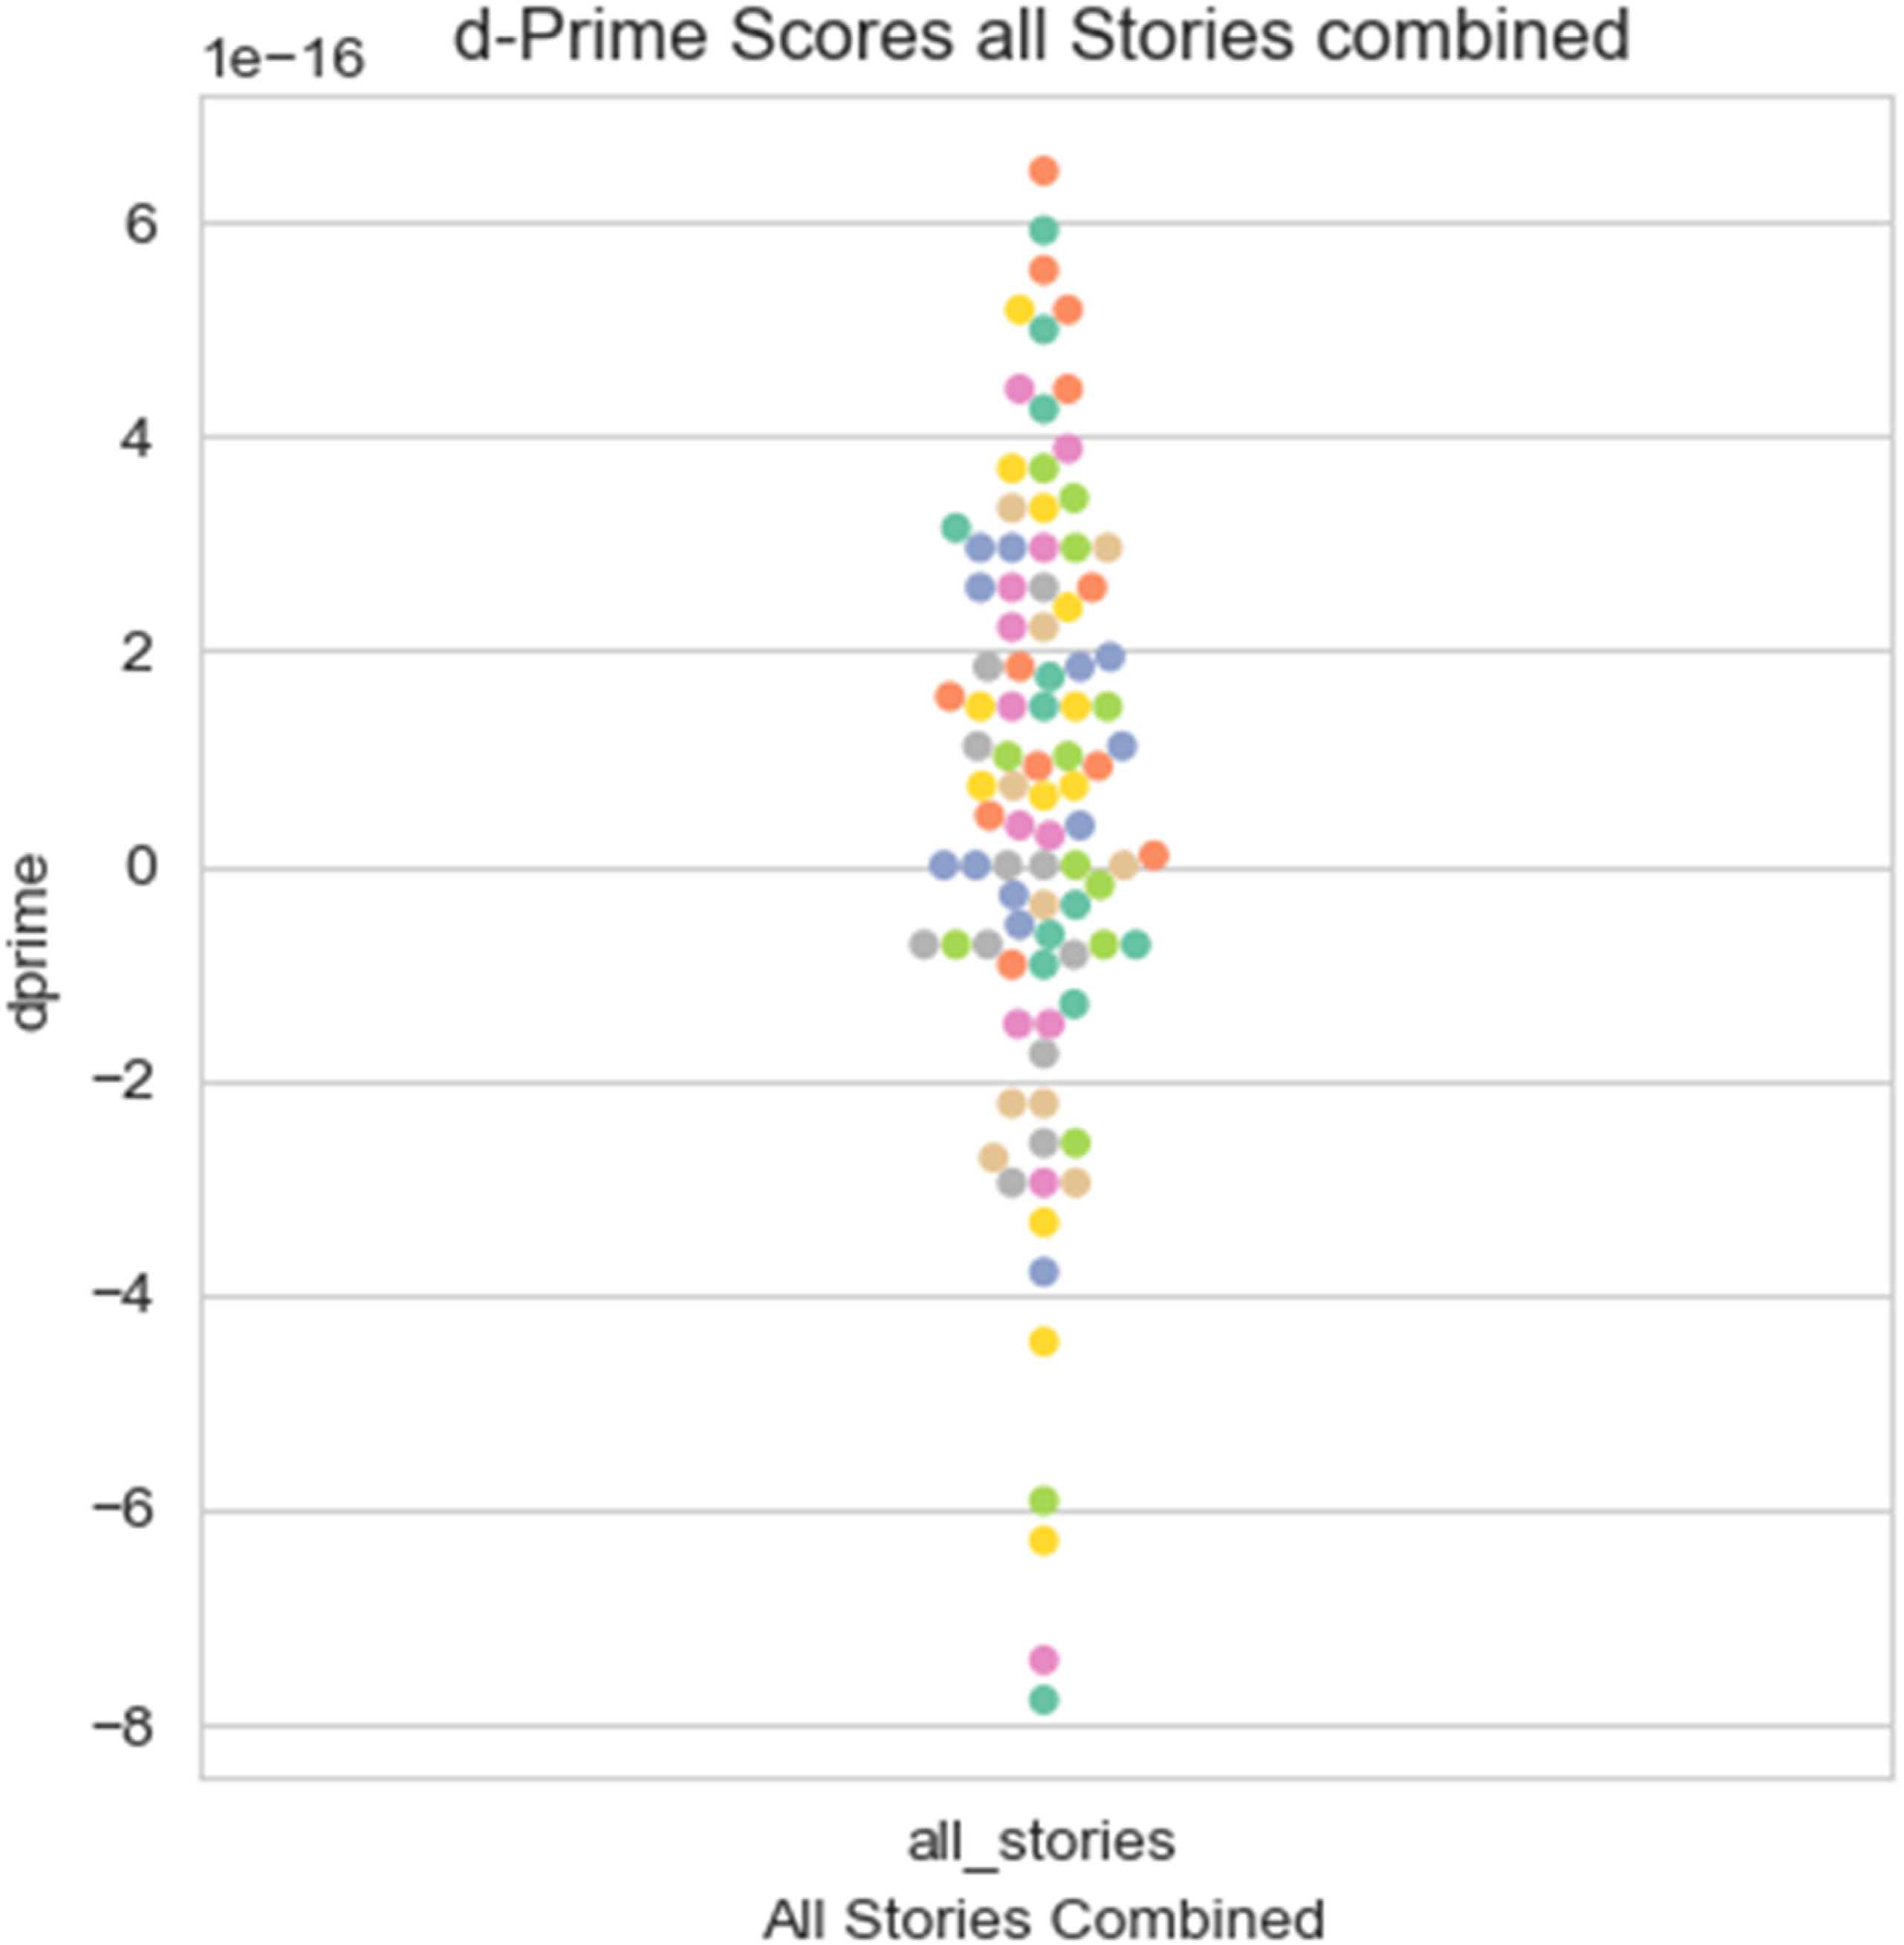
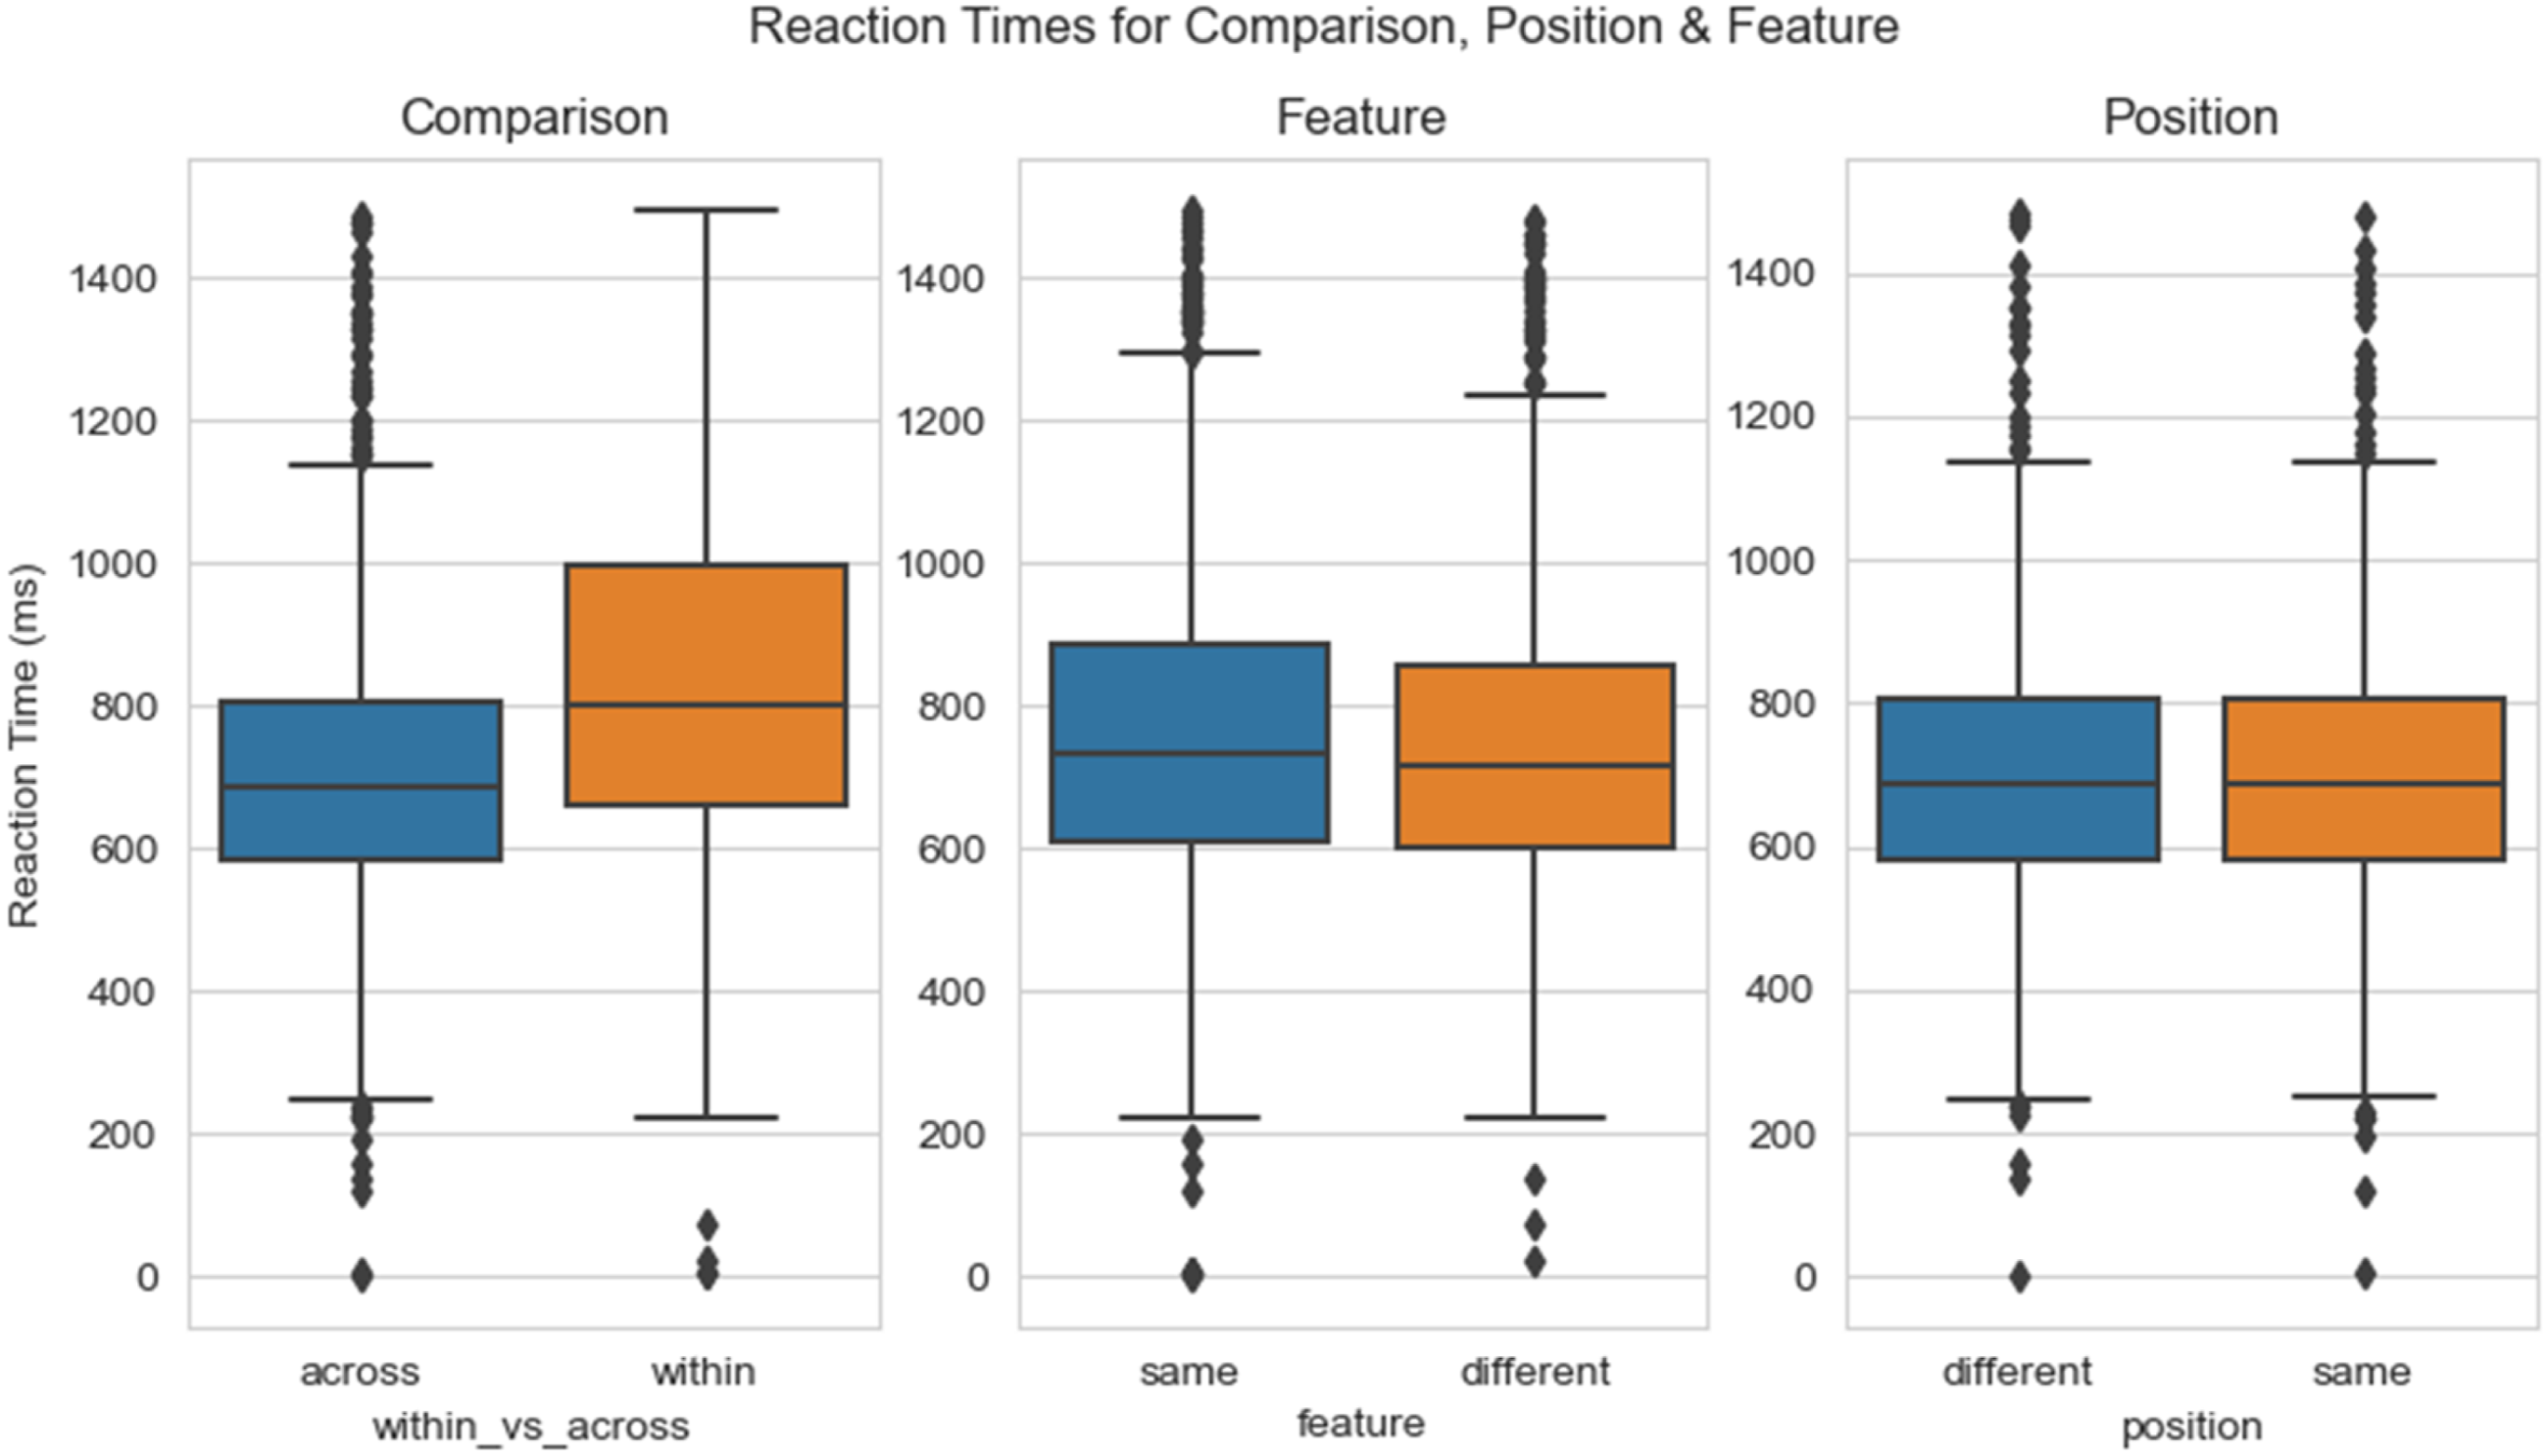
On average, participants show 8.85 oddball hits (SD = 2.78) out of 12 possible hits, 4.39 false positives (SD = 5.47) out of 20 possible false positives, and 3.16 misses (SD = 2.68) (Figure 3). With regard to the factors of interest, participants reacted fastest for oddballs coming from across a different story (M = 702.94 ms, SD = 194.19 ms), than from within the same story (M = 832.18 ms, SD = 250.98 ms). Participants were also overall responding faster to oddballs with a different degree of Feature Change (M = 748.81 ms, SD = 221.58 ms) than for the same Feature Change (M = 761.46 ms, SD = 234.31 ms). Position seemed to overall not differ in reaction times between oddballs with a different position (M = 705.01 ms, SD = 195.04 ms) and oddballs with the same position (M = 700.88 ms, SD = 193.47 ms) (Figure 4). The exact contribution of these factors to reaction times was however evaluated in light of an interaction with a linear mixed model. Hits, Misses and False Positives as Average Across Stories Reaction Times Over Main Conditions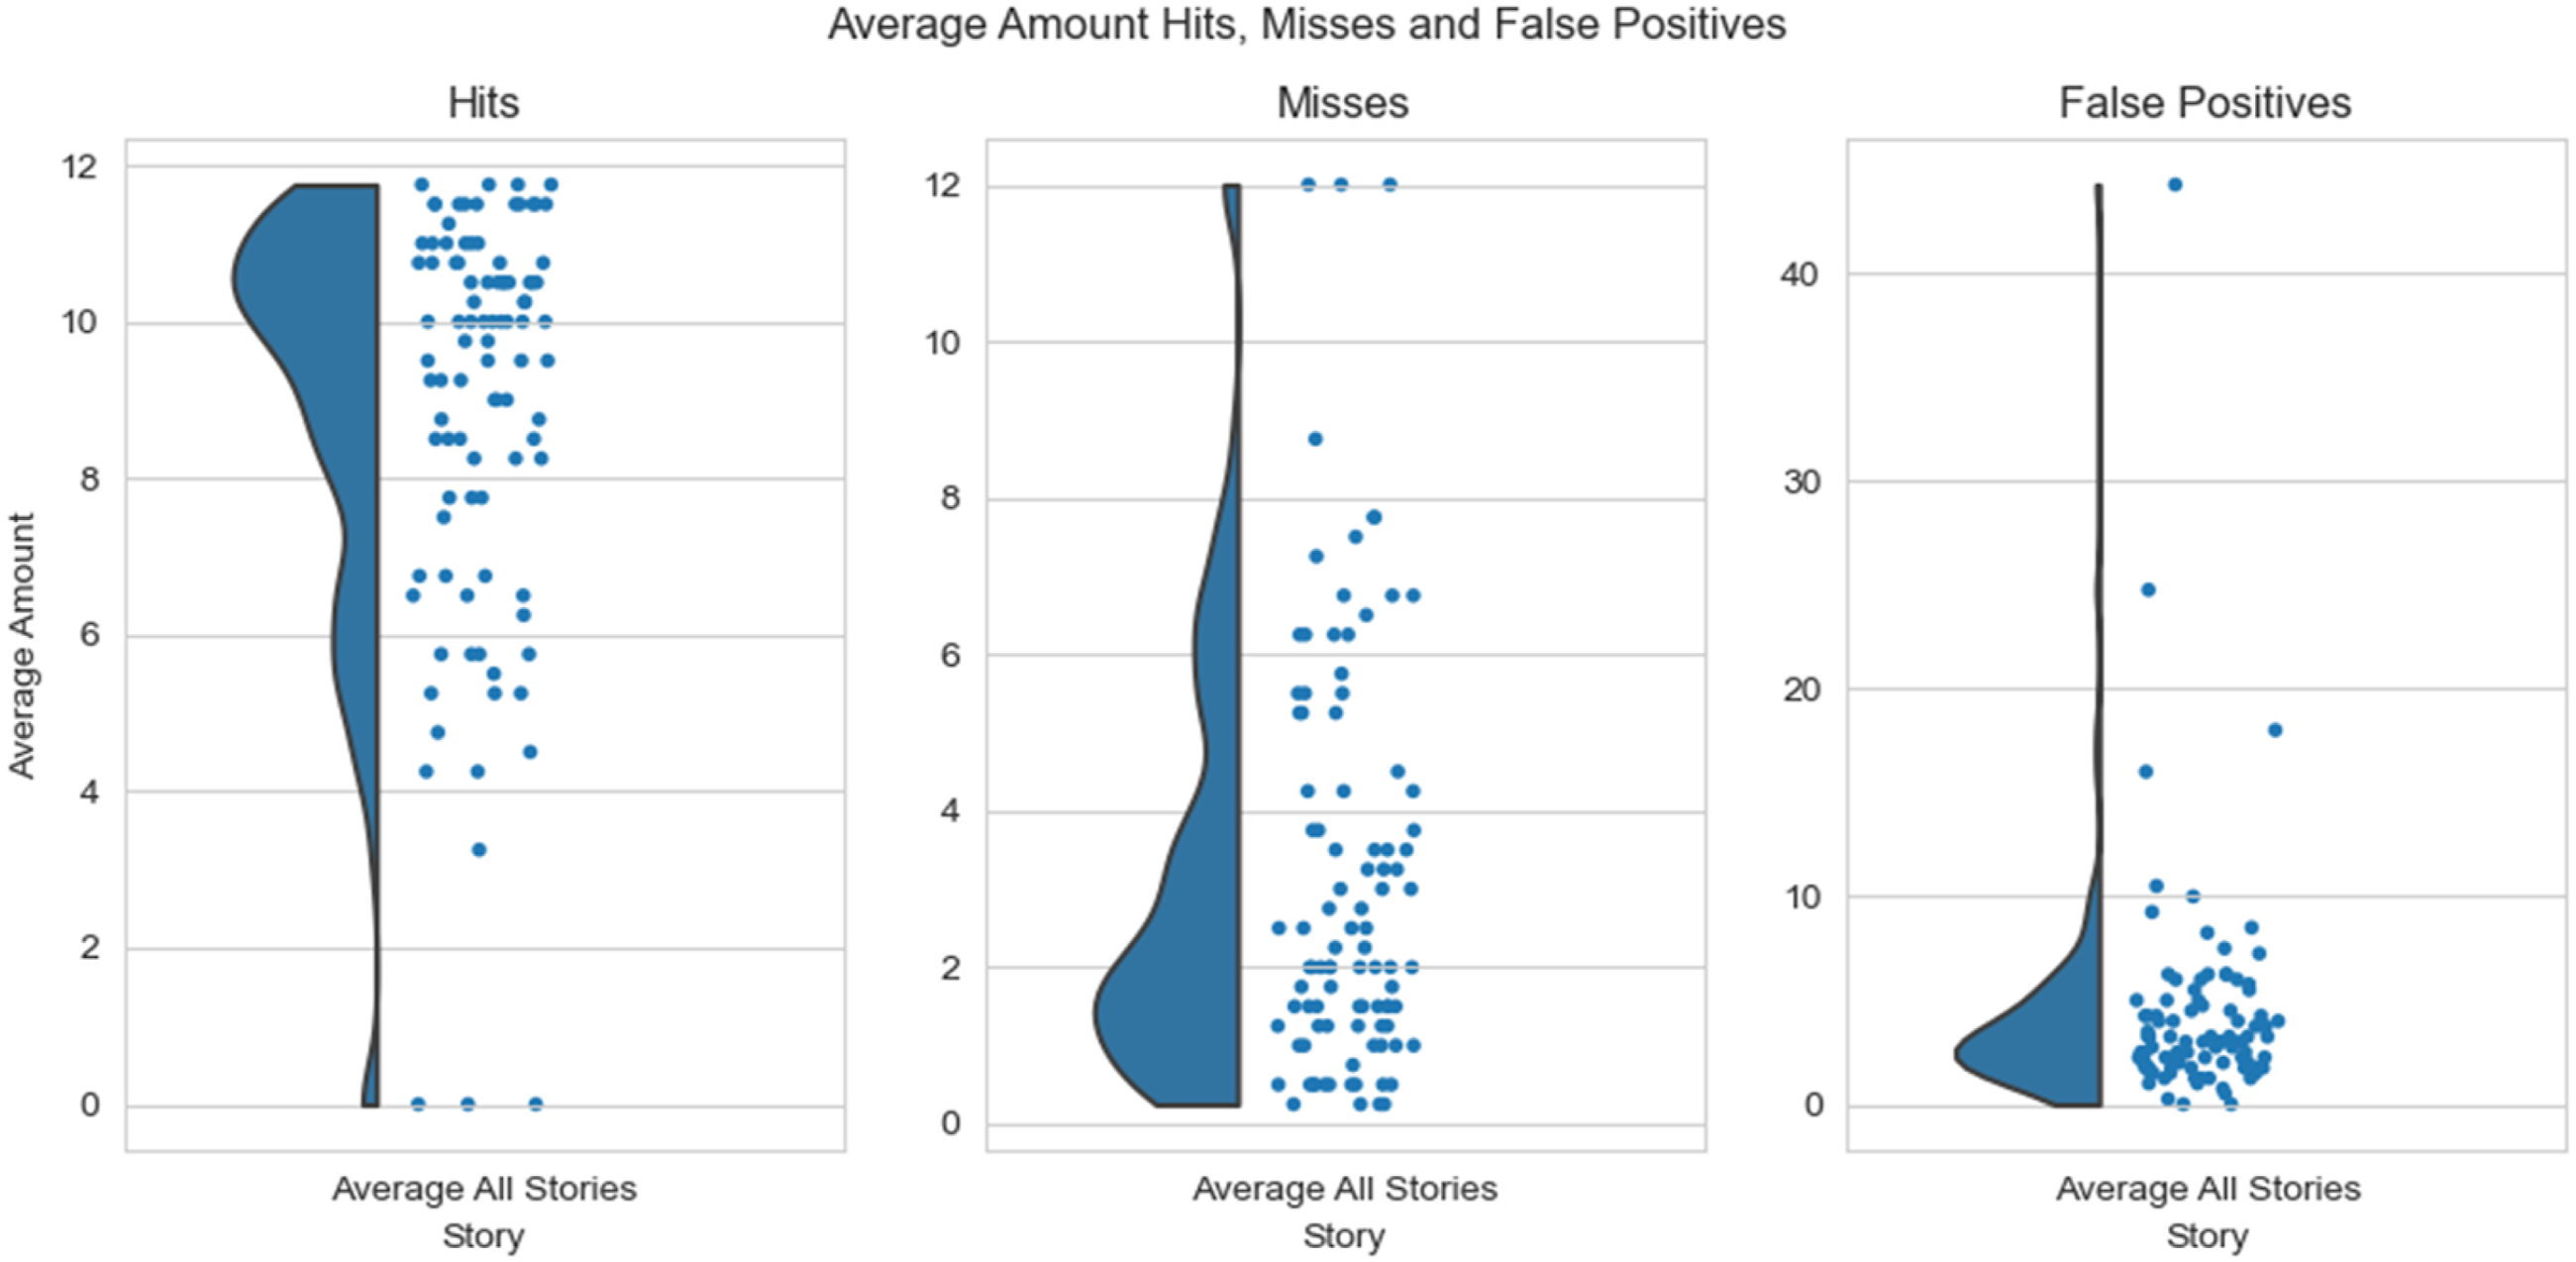
Interaction Comparison and Feature Change
We were interested, whether the participant’s response speeding is influenced by an interaction between the factors story Comparison (within or across) and degree of Feature Change (same or different). Overall, participants’ response speeding was fastest for identifying oddballs that come from across another story, but had the same degree of feature change (M = 703.73 ms, SD = 133.81 ms). Participants reacted the slowest to oddballs that come from within the same story and had the same degree of feature change (M = 874.78 ms, SD = 135.63 ms). The other two conditional combinations of Comparison (across) with Feature Change (within) (M = 708.56 ms, SD = 116.99 ms), and Comparison (within) with Feature Change (different) (M = 838.94 ms, SD = 165.89 ms) were in between these extremes (Figure 5). The statistical analysis of the model fit for the interaction of Comparison and Feature Change showed a significant interaction (F (1,55.1) = 15.56, p = .0002, part R2 = 0.02), a significant main effect of comparison (F (1,53.8) = 196.6, p < .001, part R2 = 0.19) and a significant main effect of Feature Change (F (1,120.9) = 5.24, p = .024, part R2 = 0.01). The main effect of Visual Similarity was not significant, but the statistics indicate a trend (F (1,52.4) = 3.87, p = .055, part R2 = 0.003). These differences in reaction times reveal that participants were able to keep track of abstract narrative ingredients like the specificity of the story and event specific feature changes, which are in turn relevant to build a holistic narrative. Interaction Comparison and Feature Change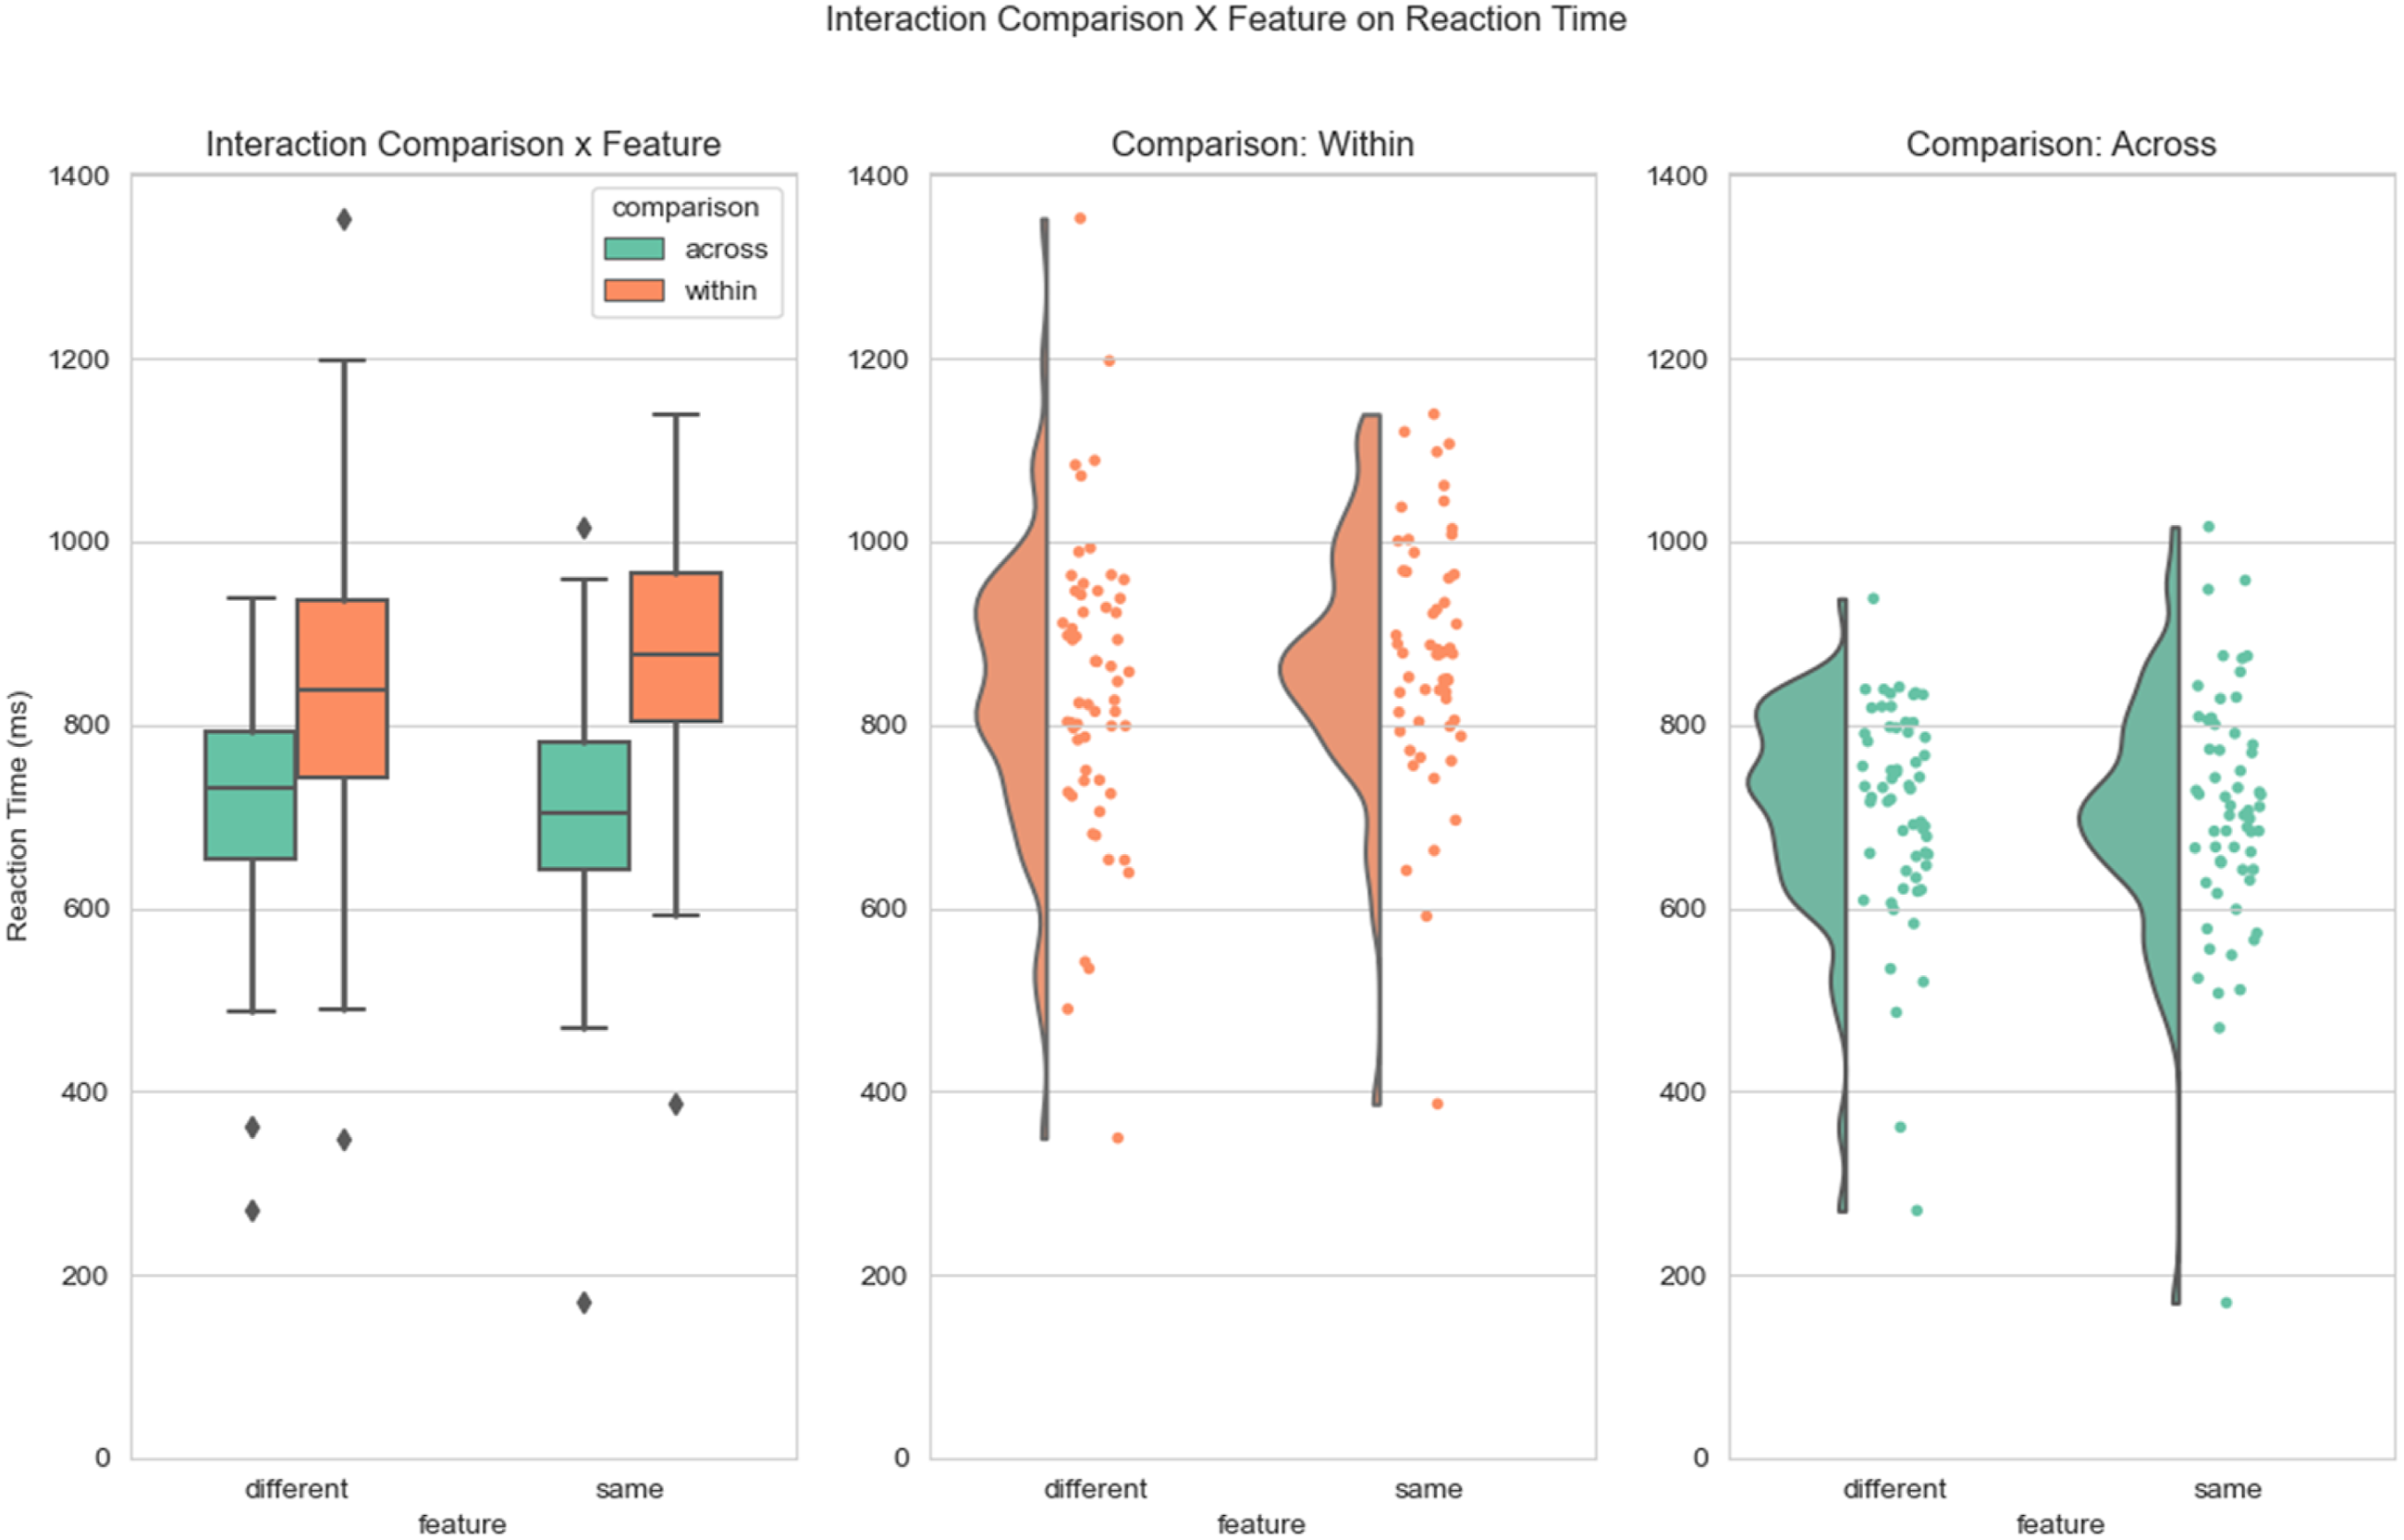
Interaction Position and Feature Change
We were also interested in the interaction between the Position of an oddball within a narrative and the degrees of Feature Change. For that, we selected only oddball trials that come from across a different story to be able to either have the same or a different oddball position. On average, participants were fastest to respond to an oddball from the same position and the same degree of feature change as the original event card (M = 676.24 ms, SD = 138.52 ms). Participants were on average slowest to react to an oddball coming from a different event position with the same degree of feature change (M = 728.18 ms, SD = 148.11 ms) (Figure 6). Other conditional combinations were within these extremes, including Position (different) with Feature Change (different) (M = 698.5 ms, SD = 133.54 ms), and Position (same) with Feature Change (different) (M = 720.18 ms, SD = 125.37 ms). The interaction between Position and Feature Change was significant (F (1,488) = 19.53, p < .001, part R2 = 0.02). No significant main effect of either Position (F (1,225) = 1.91, p = 0.169, part R2 = 0.002) or Feature Change (F (1,82.6) = 0.93, p = .339, part R2 = 0.001) was found. There was no significant main effect of Visual Similarity, yet the statistics can be interpreted as a trend (F (1,60.3) = 3.37, p = .071, part R2 = 0.003). Interaction Position and Feature Change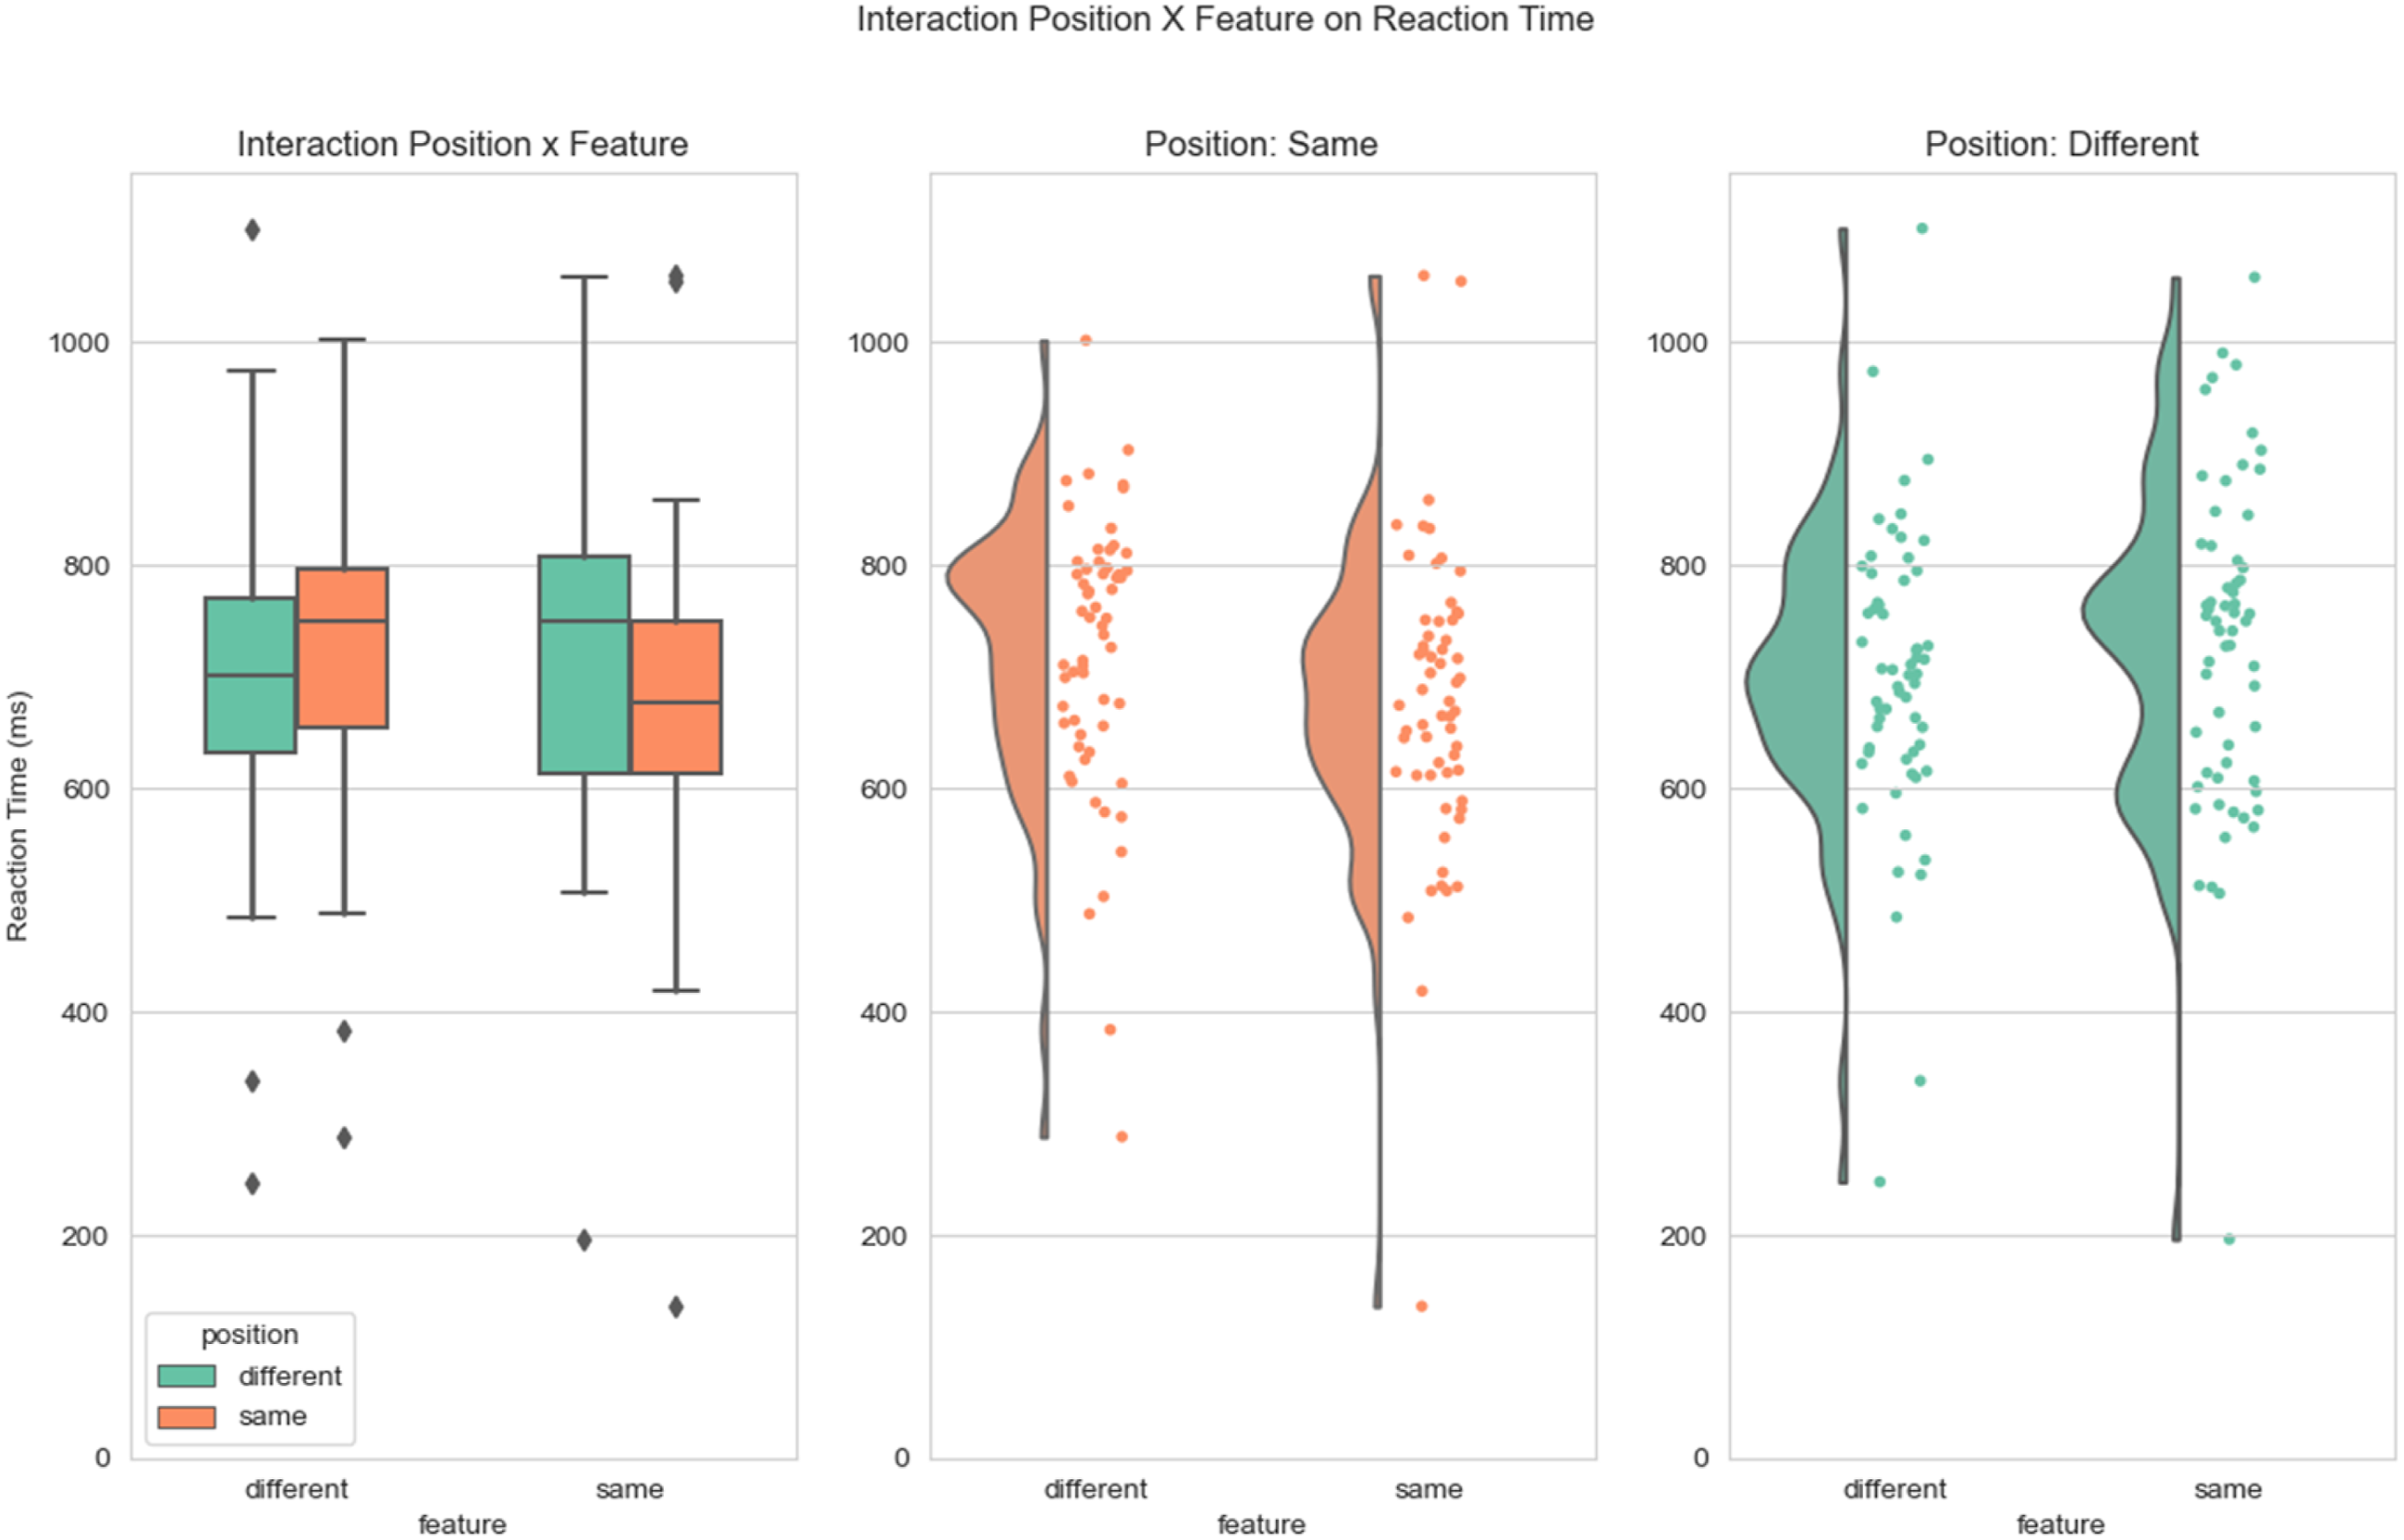
Parametric Distance of Position and Feature Change
The factors Position and Feature Change were initially operationalized as conditional factors (same and different). We also explored the possibility that a more parametric operationalization would reveal more subtle differences in our manipulation. We therefore repeated the analysis as described above, but this time we modelled Position and Feature Change as parametric variables. For a parametric operationalization of these two v ariables, we calculated the distance (i.e., the difference) in Position between the oddball event card and the original event card, resulting in four different positional distances: 0, 1, 2 and 3. We did the same for the degree of Feature Change, which resulted in two distance scores: 0 and 2. (Figure 7). Parametric Distance of Position and Feature Change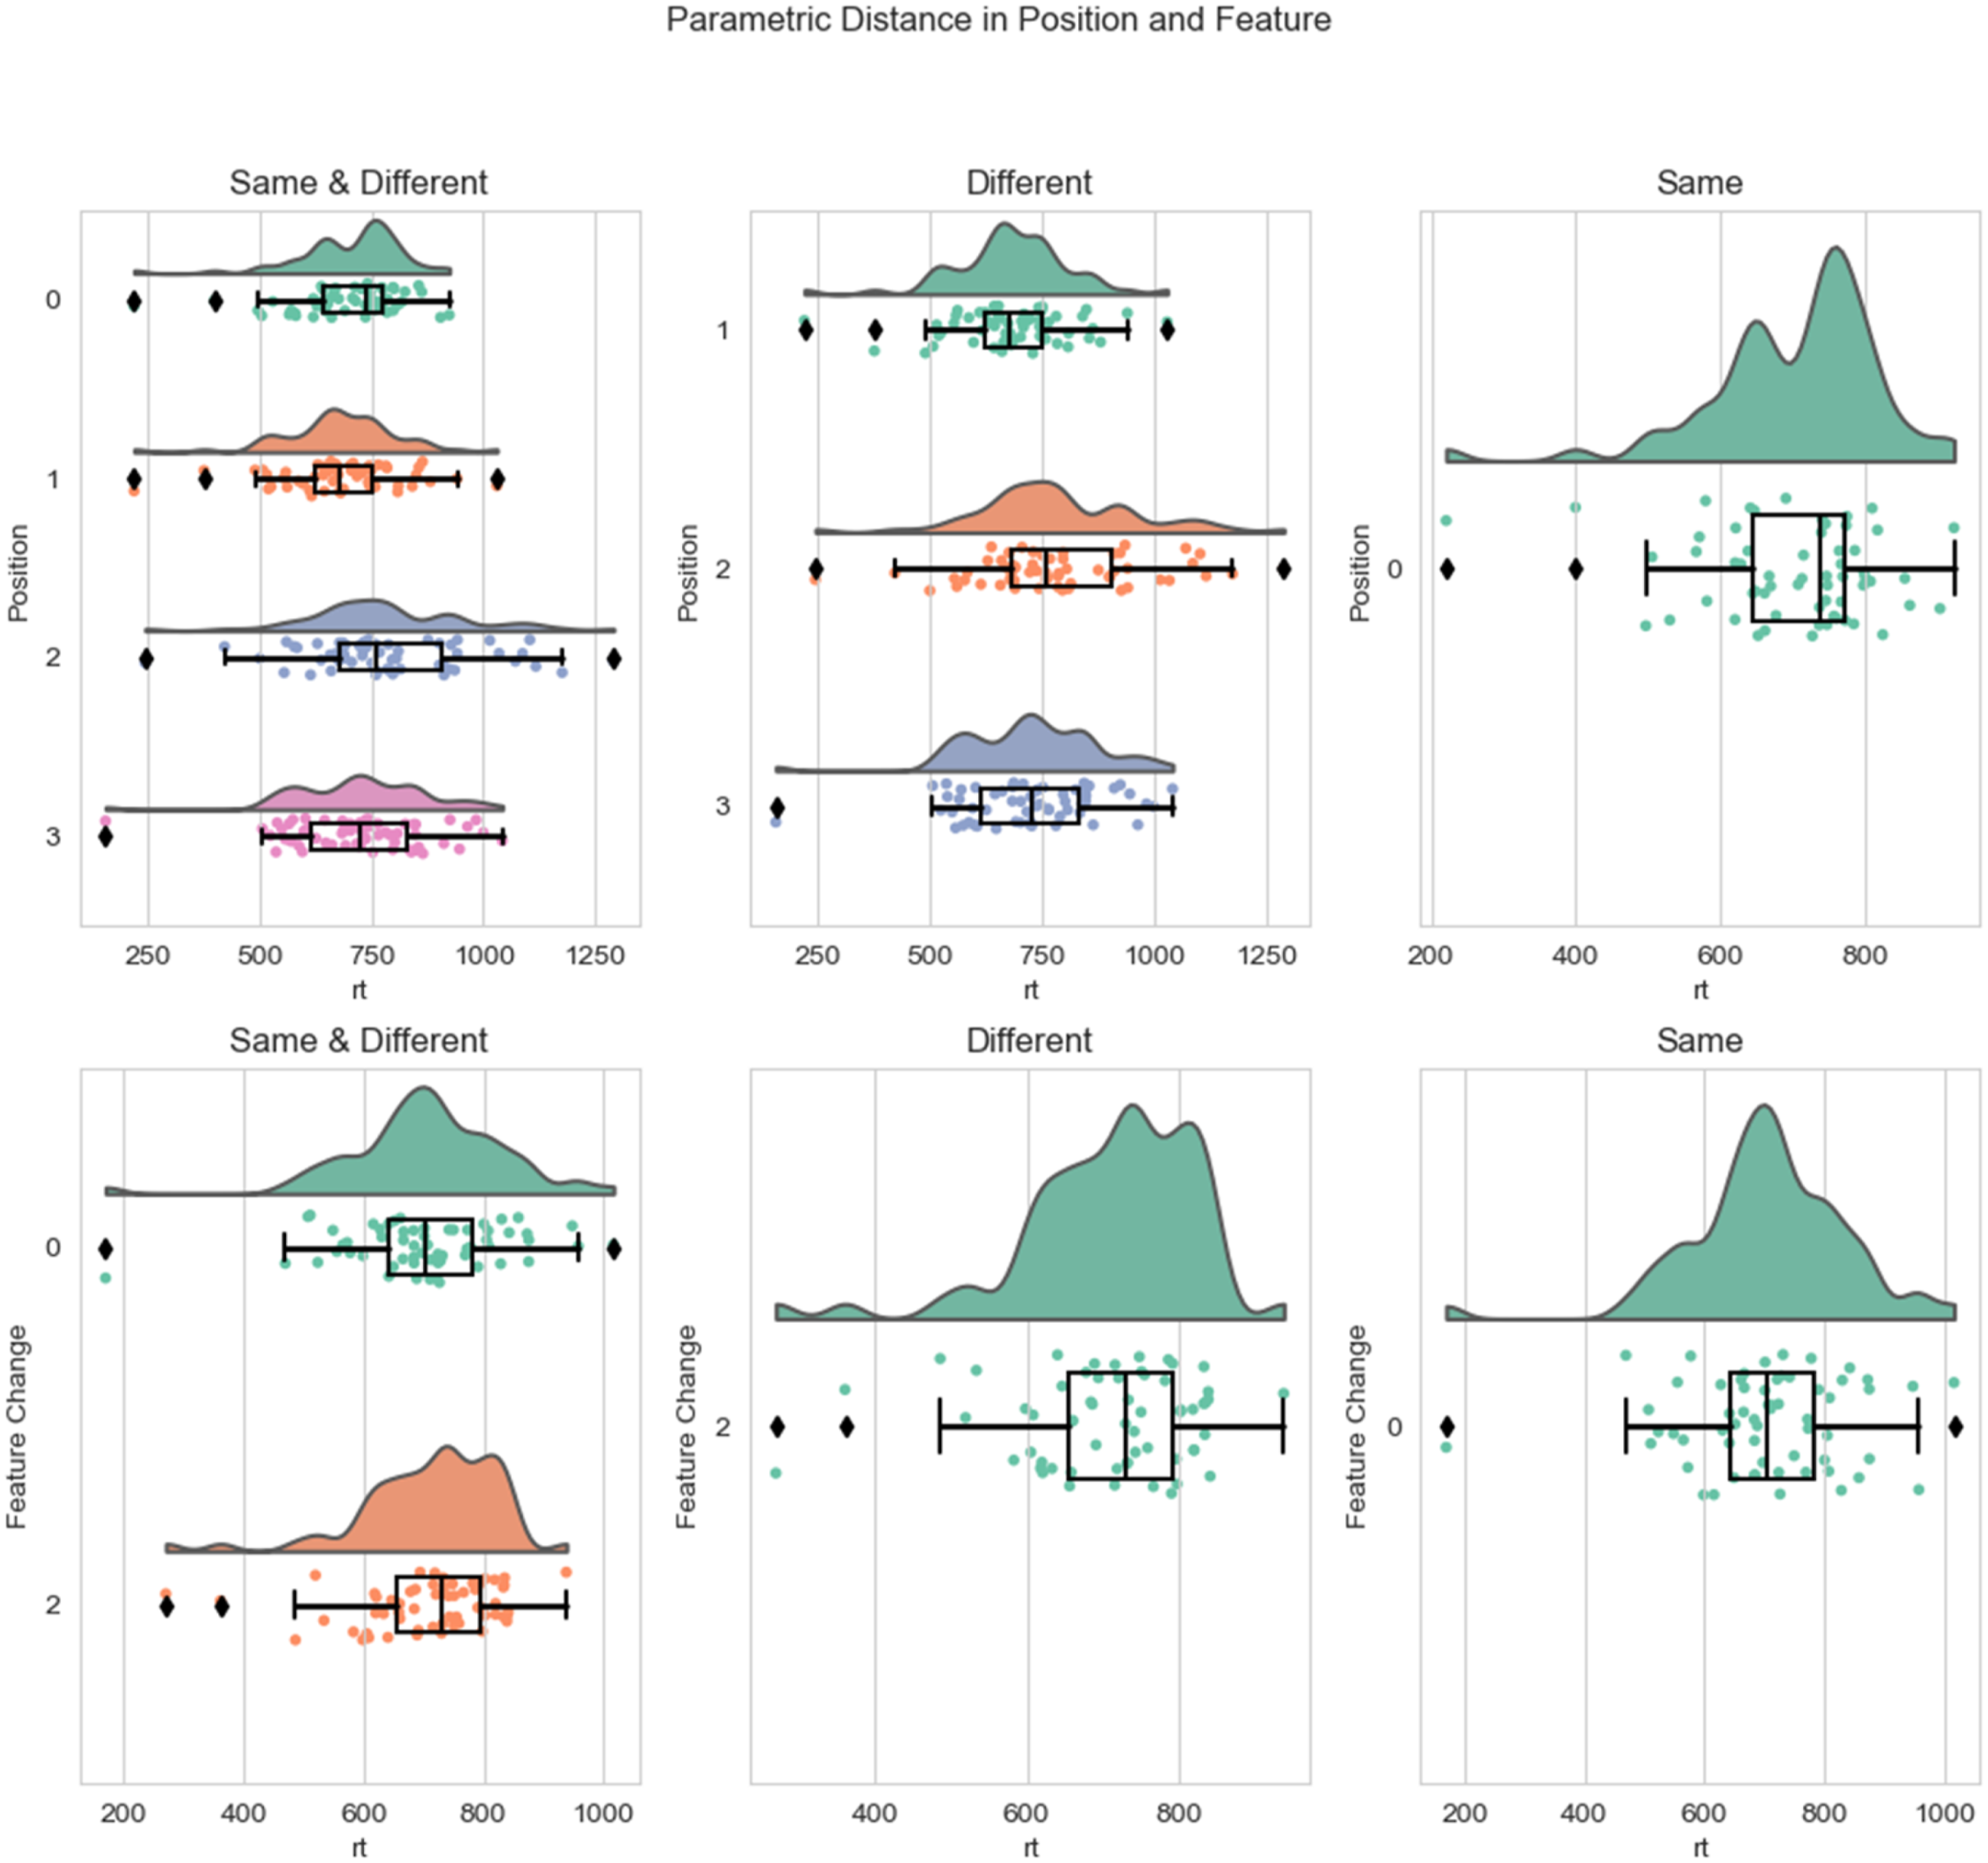
On average, participants reacted fastest to oddballs with a distance in Position of 1 (M = 680.75 ms, SD = 131.06 ms), followed by a distance of 0 (M = 701.57 ms, SD = 119.17 ms), then 3 (M = 724.85 ms, SD = 150.27 ms) and finally 2 (M = 784.46 ms, SD = 185.41 ms). With regard to distances in Feature Change, participants reacted fastest to oddballs with a distance of 0 (M = 703.73 ms, SD = 133.81 ms) as compared to a distance of 2 (M = 708.56 ms, SD = 116.99 ms). A significant interaction was found between a parametric operationalization of Position and Feature Change (F (1,436) = 8.62, p = .004, part R2 = 0.01). The main effect of Position was significant (F (1,108.7) = 20.34, p < .001, part R2 = 0.02), as well as the main effect of Feature Change (F (1,132) = 7.99, p = .005, part R2 = 0.01). Also, a significant main effect of Visual Similarity was found (F (1,57.1) = 5.76, p = .02, part R2 = 0.005).
Correlation of Visual Similarity with Comparison and Feature Change
To exclude the possibility that the card visuals are confounding our main factors of interest, we also investigated the correlation between Visual Similarity and different levels of Comparison and Feature Change. This approach revealed only one significant correlation between Visual Similarity and a factor combination of Comparison (across story) and Feature Change (different) (r = −0.28, p = 0.028). This result indicates that the higher the visual similarity between an oddball, which comes from a different story and has a different degree of feature change, and the original event card, the slower the reaction time of the participants. All other combinations of Comparison and Feature Change yielded no significant correlation with Visual Similarity: Comparison (across) and Feature Change (same) (r = −0.15, p = .024), Comparison (within) and Feature Change (different) (r = 0.11, p = .401), Comparison (within) and Feature Change (same) (r = 0.04, p = .105) (Figure 8). Correlation Comparison and Feature Change With Visual Similarity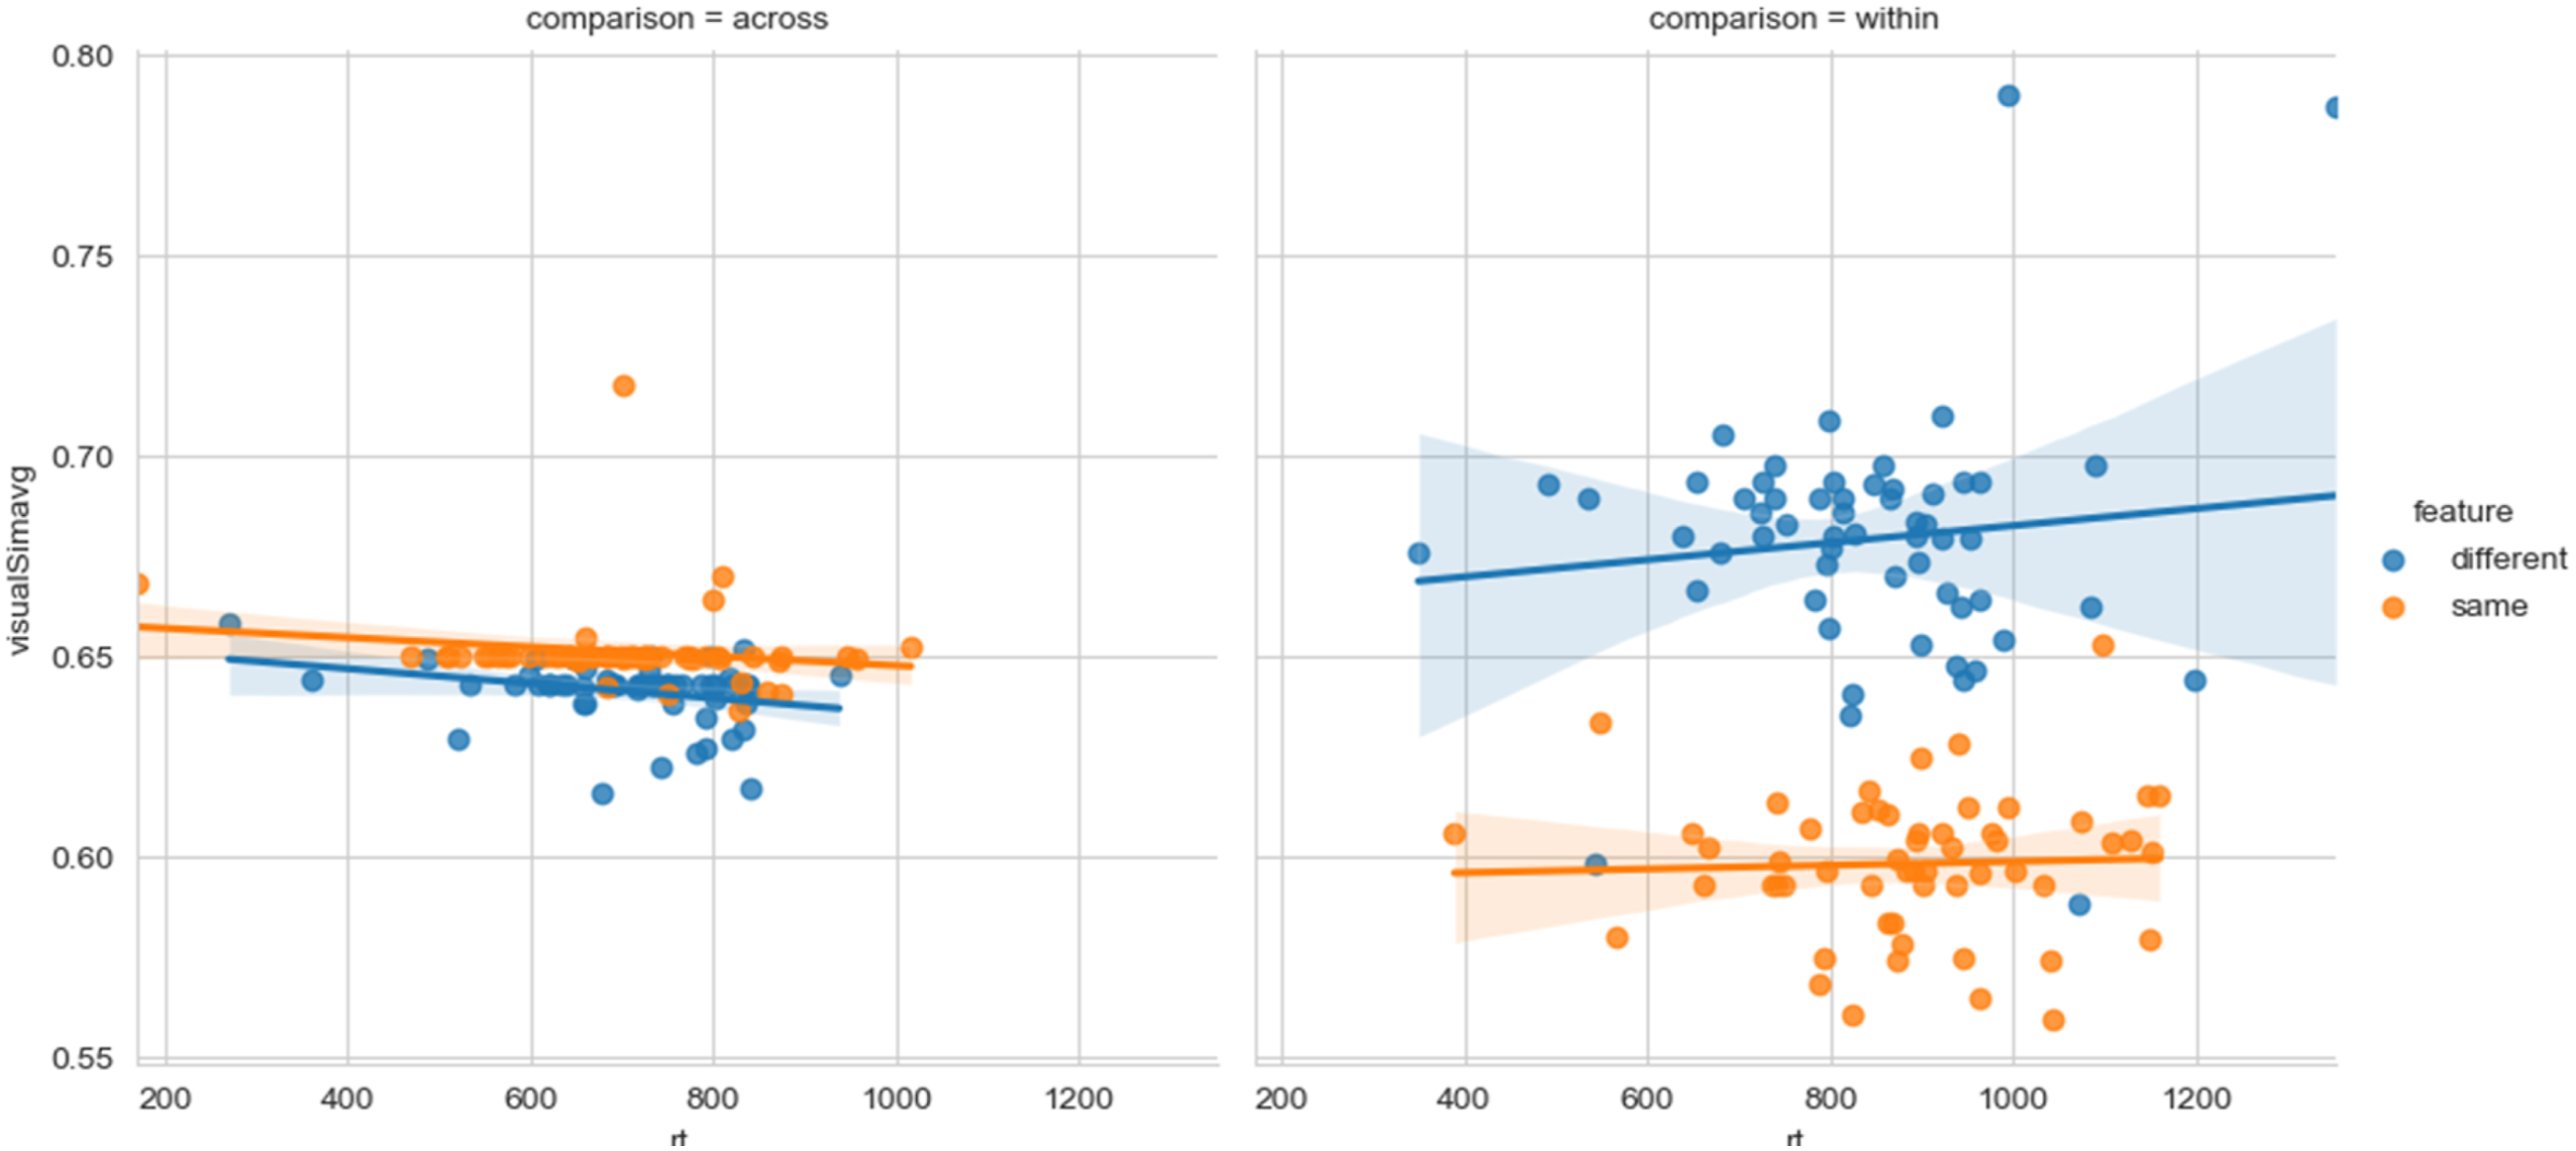
Correlation of Visual Similarity with Position and Feature Change
For different combinations of the factors Position (same and different) and Feature Change (same and different), only one significant correlation with Visual Similarity was found. For oddballs that come from a different position and have a different degree of feature change, a negative correlation was found with Visual Similarity (r = −0.33, p = 0.009). Participants became slower with increasing visual similarity for oddball from this particular combination of factors. No significant correlation could be identified for other combinations of the factors Position and Feature Change with Visual Similarity: Position (different) and Feature Change (same) (r = −0.03, p = 0.831), Position (same) and Feature Change (different) (r = −0.14, p = 0.284), Position (same) and Feature Change (same) (r = −0.21, p = 0.105) (Figure 9). Correlation Position and Feature Change With Visual Similarity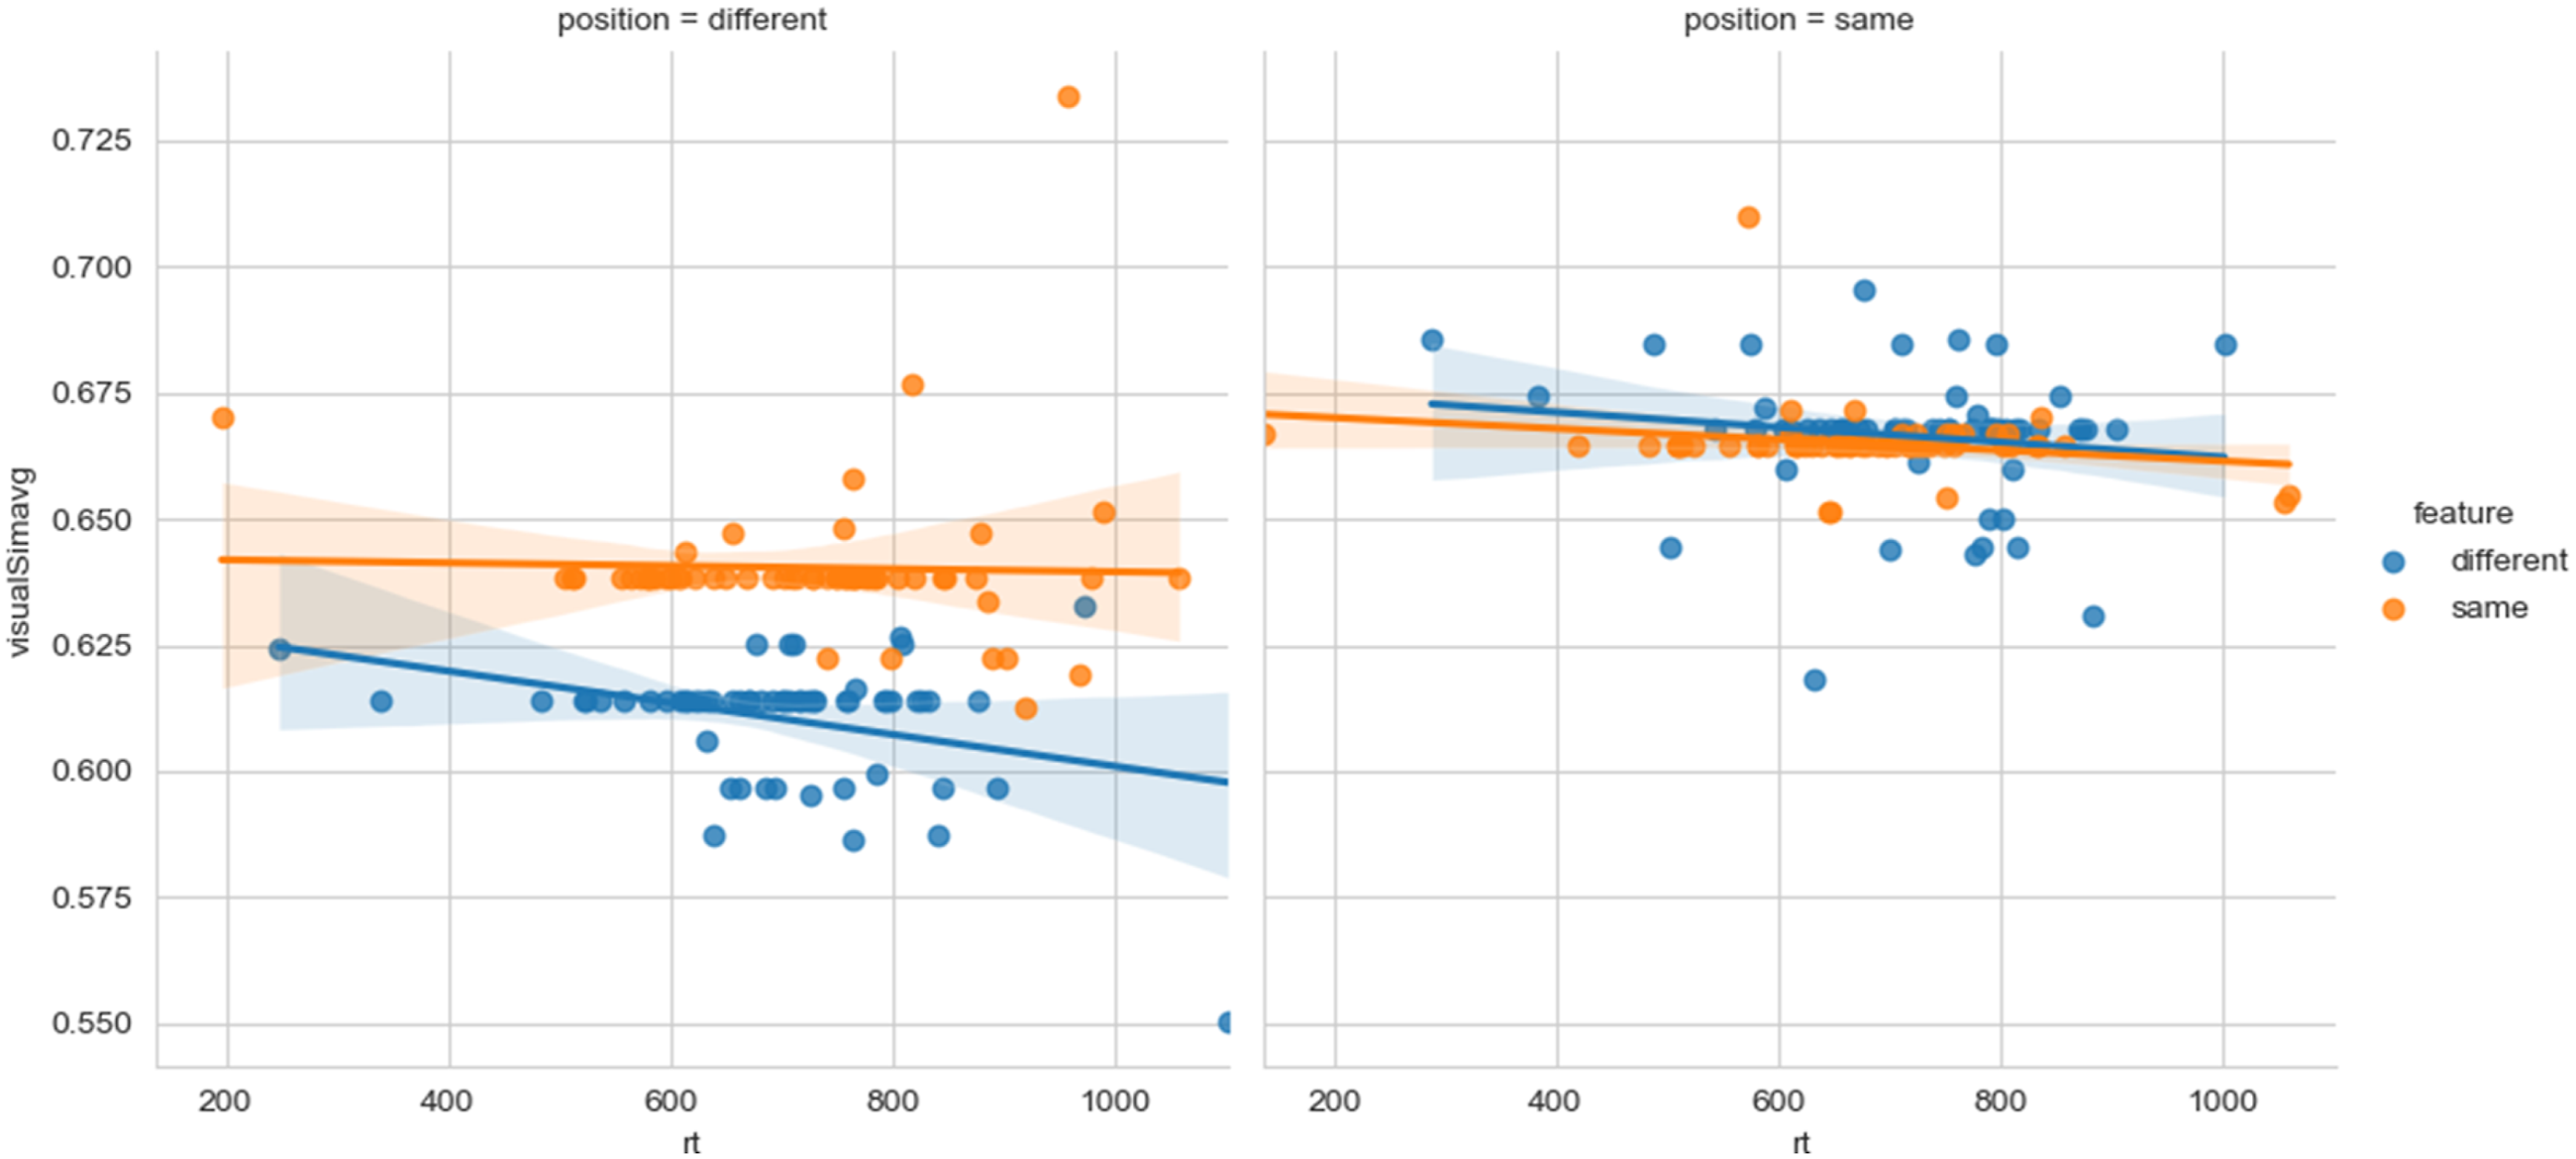
Taken together, the correlation data highlights that Visual Similarity only has a minor influence on reaction times. Only for conditional combinations in which the oddball event card differed the most from its original event card, visual similarity is likely to have an influence on reaction times. In this particular case, higher visual similarities could interfere with the otherwise vastly different setup of the oddball event card. Because of this specificity of visual similarity for a limited and particular combination of relevant factors, we conclude that visual similarity is not an influential factor on overall response speeding (see Figure 10 for a gross comparison between conditions). Gross Comparison of Condition Specific Correlation With Visual Similarity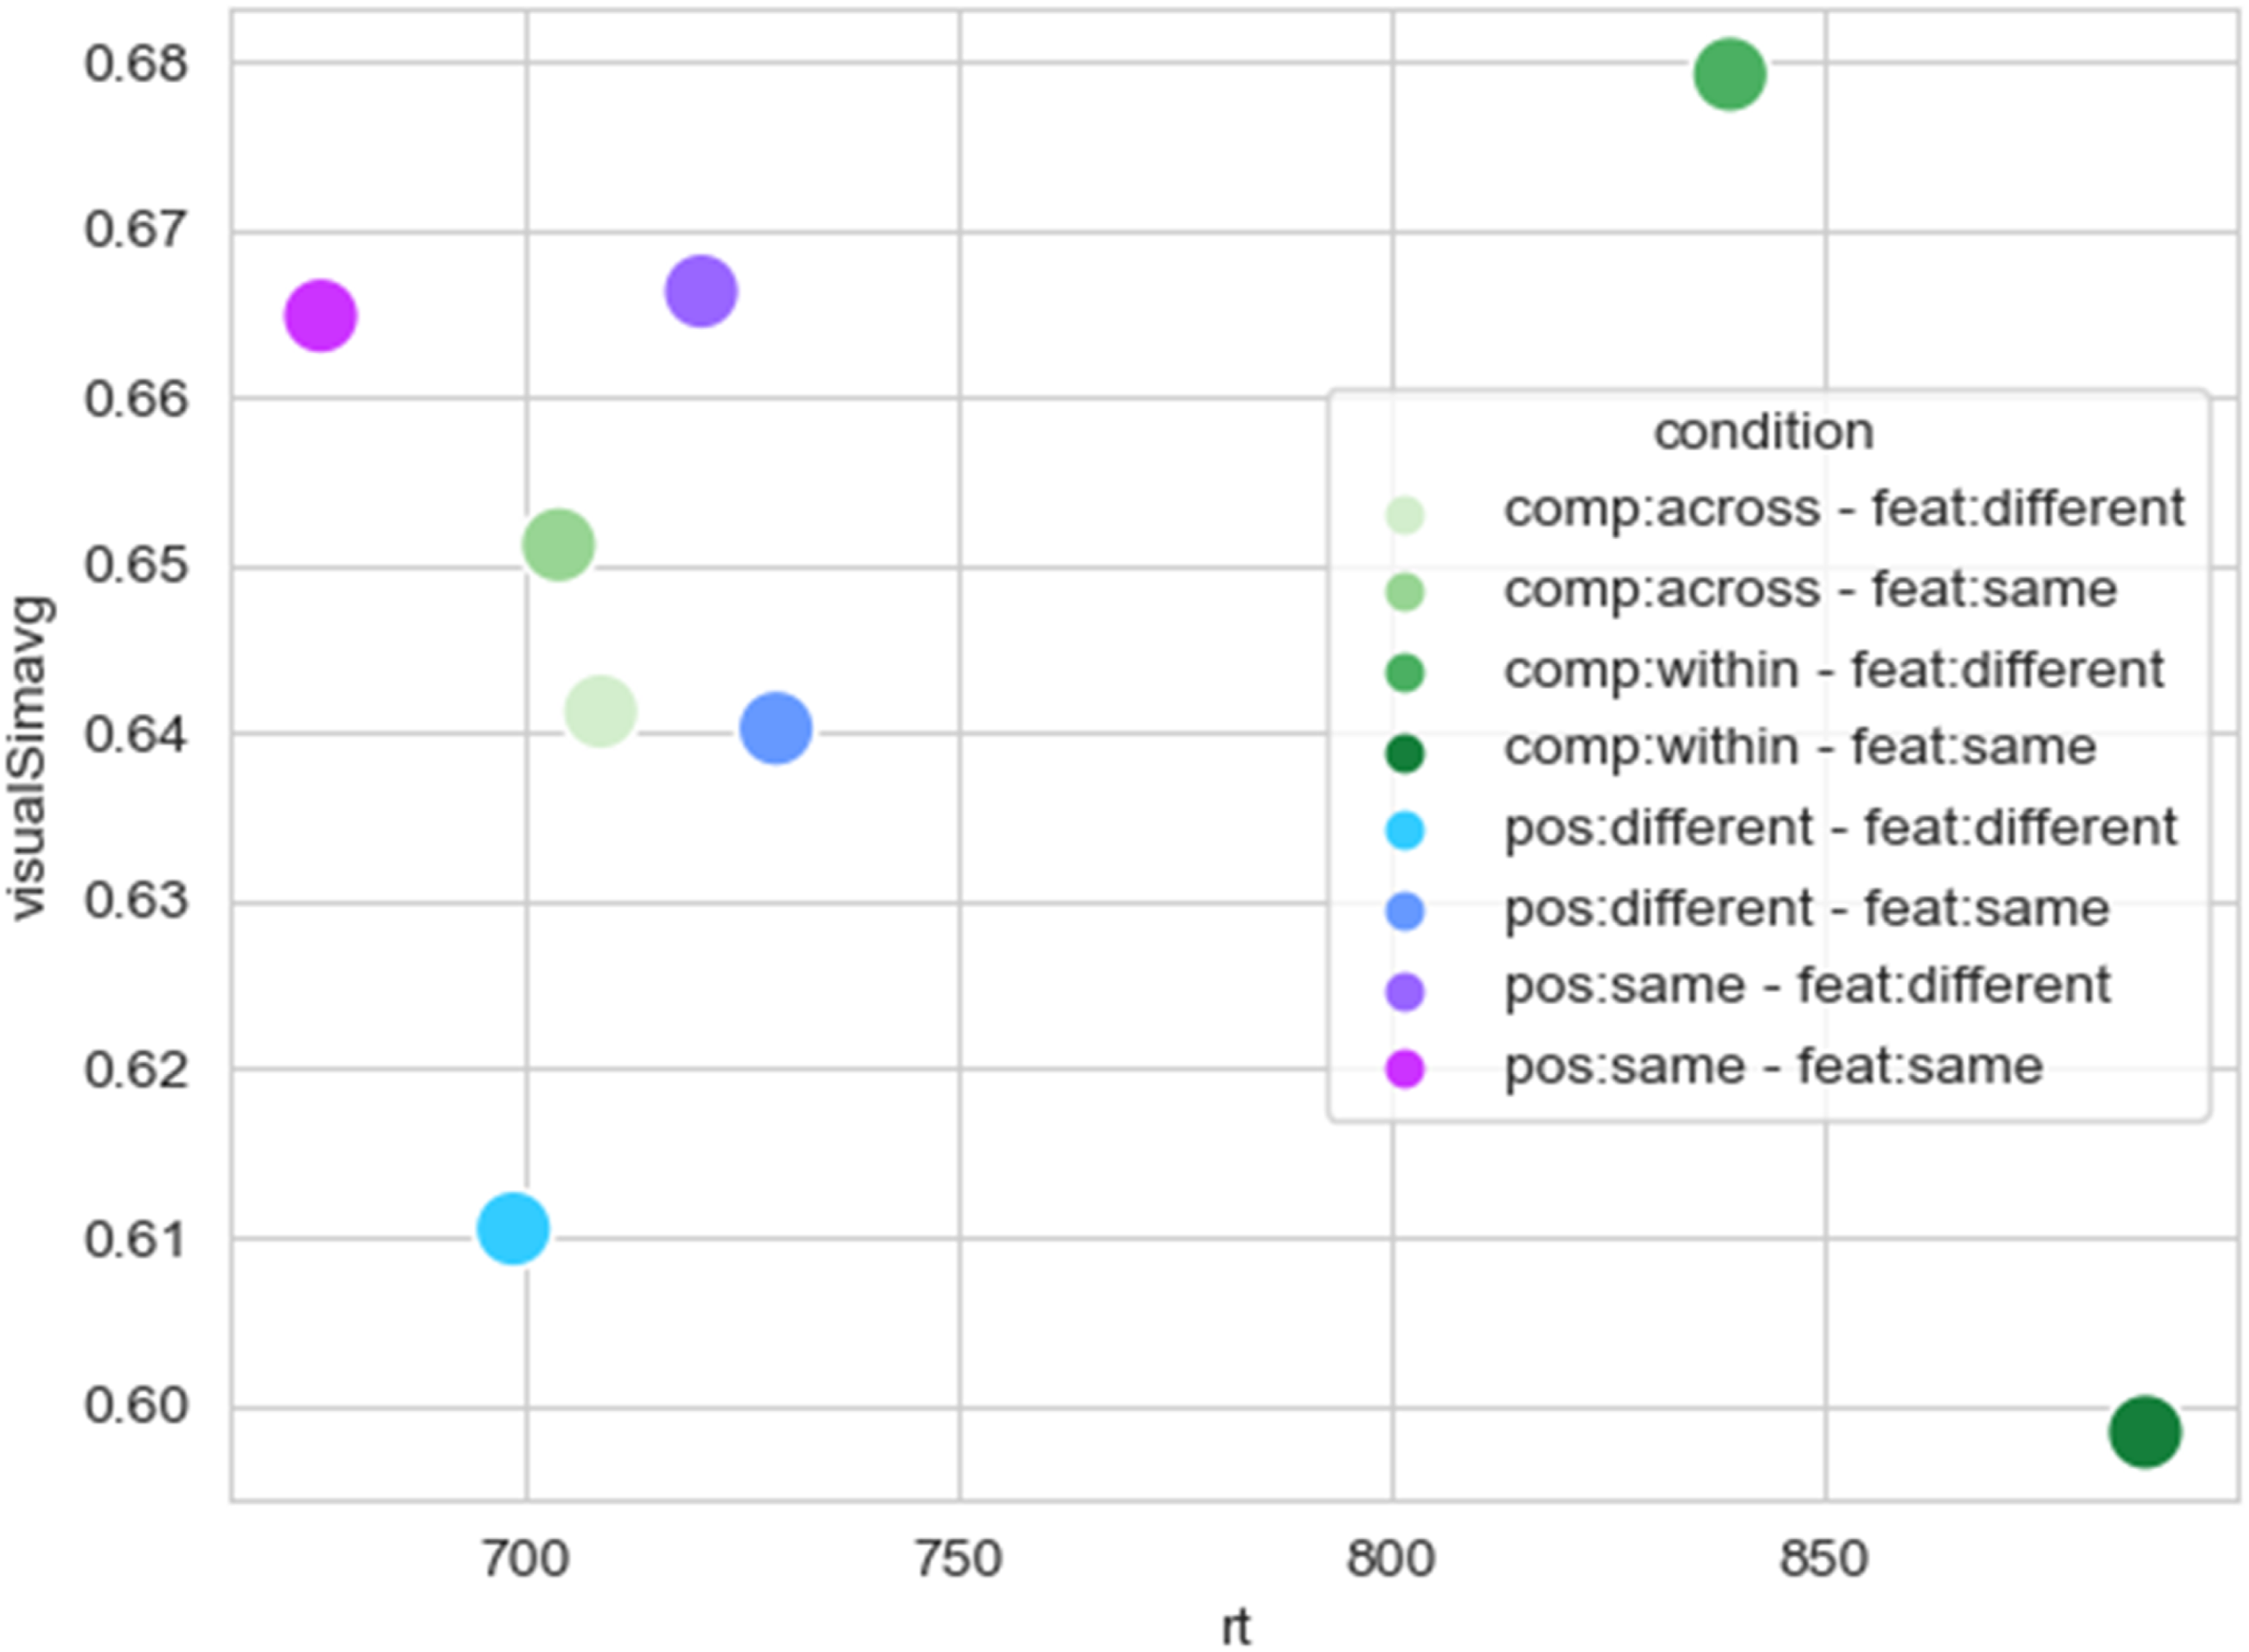
Discussion
We used an experiment with event cards that contained systematically manipulated abstract event feature dimensions. Participants received these event cards in random order and were asked to actively create coherent stories from these event cards, followed by an oddball task to test their memory for these stories. We investigated the influence of the abstract factors “degree of feature change” and “position within the story” on response speeding during the oddball task. We discovered that participants’ response to oddballs was indeed influenced by an abstract factor degree of feature change, participants were faster for oddballs with a different degree of feature change. The degree of feature change reaction time interacted with whether the oddball was from within the same story or from another story. Participants responded fastest to oddballs from another story but with the same degree of feature change. Participants were slowest in identifying oddballs from within the same story and with the same degree of feature change. When zooming in on oddballs from other stories only, we found an interaction between position within the event structure and degree of feature change. In more detail, participants were fastest for oddballs with the same position in the event structure and the same degree of feature change. These results suggest that people make use of an abstraction for keeping track of an event feature space and narrative specific representations like position. Furthermore, the feature space seems more dominant as a factor than position of the event. Low level features (like visual similarity) only have a minor impact.
Information from across events needs to be integrated in order to form a coherent narrative (Cohn-Sheehy et al., 2021; Ezzyat & Davachi, 2014; Leshinskaya et al., 2023; Morton et al., 2017; Richmond & Zacks, 2017). Our research reveals that this integration across events is highly influenced by abstract event features, since events with the same degree of feature change are treated as more similar to each other than events with a different degree of feature change (even when all these events come from different stories altogether). This is in line with the view that an abstraction of event specific information is necessary during narrative processing (Lupyan & Bergen, 2015). In order to update a situation model, humans might use abstraction of event features as well as event specific information in order to determine whether the current situation model needs to be updated or not.
Interestingly, participants were particularly fast in identifying odd events when the odd event had the same degree of feature change as well as the same position in the story compared to the correct event. Following our initial prediction, we would have expected participants to be slower in identifying odd events that were so similar to the correct event (due to the degree of overlap between the correct event and the to be identified odd event). We expect that this surprising aspect might originate from being influenced by pattern separation processes; research has shown that our brain creates highly different representations for information that is in fact highly similar, which enables us to distinguish highly similar experiences in memory (Yassa & Stark, 2011). Possibly, odd events that are both the same in degree of feature change but also the same in position in the story are so highly similar to the original (correct) event that pattern separation was necessary to enable the participant to correctly determine whether the event was correct or an oddball. We speculate that pattern separation might possibly be necessary in order to relate event specific information more easily to its corresponding abstract representation.
Thus, our results suggest that we indeed make use of abstract event features. However, their involvement seems to depend on similarity and pattern separation. In line with Lupyan and Bergen (2015), we provide evidence that abstraction initiated by language helps as a scaffold to generalize. However, the strategy for abstraction seems to depend on the context. We would suggest that this process is related to schema formation, patterns across events that are formed slowly over time (schemas defined as our schematic prior knowledge of how events generally unfold, Bower et al., 1979). Our results suggest that these abstractions can be created dynamically, depending on the context. However, based on the current research it is difficult to be certain whether these abstractions are truly dynamic or whether event abstractions have cognitive “slots” (“slots” for characters, objects, etc.). It would be interesting to investigate whether these abstractions are truly dynamic and can be created on the fly (rather than abstractions being instantiated with standard event building blocks). Another open question remains what specifically the ingredients for a situation model are that have the largest influence. Does for example having a change in location have the biggest impact or is it a change in character? Our parametric results show that there might not be a systematic difference once we zoom into individual features, however, research more targeted towards investigated specific features individually would be necessary to answer that remaining question. Another interesting avenue for future research is to study how event specific information exactly can be linked to its abstraction. Is there some hierarchical processing in place, and if so, how does this support it? Additionally, future research is necessary to determine the precise generalizability of the findings, especially across different types of stimuli. Lastly, as evident from the results, participants did not always determine the correct story order at their first attempt, which makes it likely that participants at least for some stories would have both the initially conceived story as well as the ultimate correct one in mind at the same time.
In conclusion, we argue that people are able to use an abstraction of event features as an important contribution for the instantiation of a situation model. People use these abstractions to dynamically form their event feature space. This opens up research opportunities to examine how different types of abstractions support situation model construction and how they interact with memory, learning, and predictive processing.
Footnotes
Acknowledgements
We thank Roshan Cools for valuable advice on the manuscript and Ruben van den Bosch for valuable advice on the data analyses.
Funding
The authors disclosed receipt of the following financial support for the research, authorship, and/or publication of this article: This work was supported by an NWO Gravitation grant (024.001.006).
Declaration of conflicting interests
The authors declared no potential conflicts of interest with respect to the research, authorship, and/or publication of this article.
Data Availability Statement
Author Biographies
Appendix
For Each Story (Column 1), 5 Rows That Represent the 5 Key Feature Dimensions With a One if That Feature Dimension Changed for That Particular Story and Event and a Zero if It did Not Change. loc = location, char = character, char_ch = character Change, obj = object, obj_ch = object change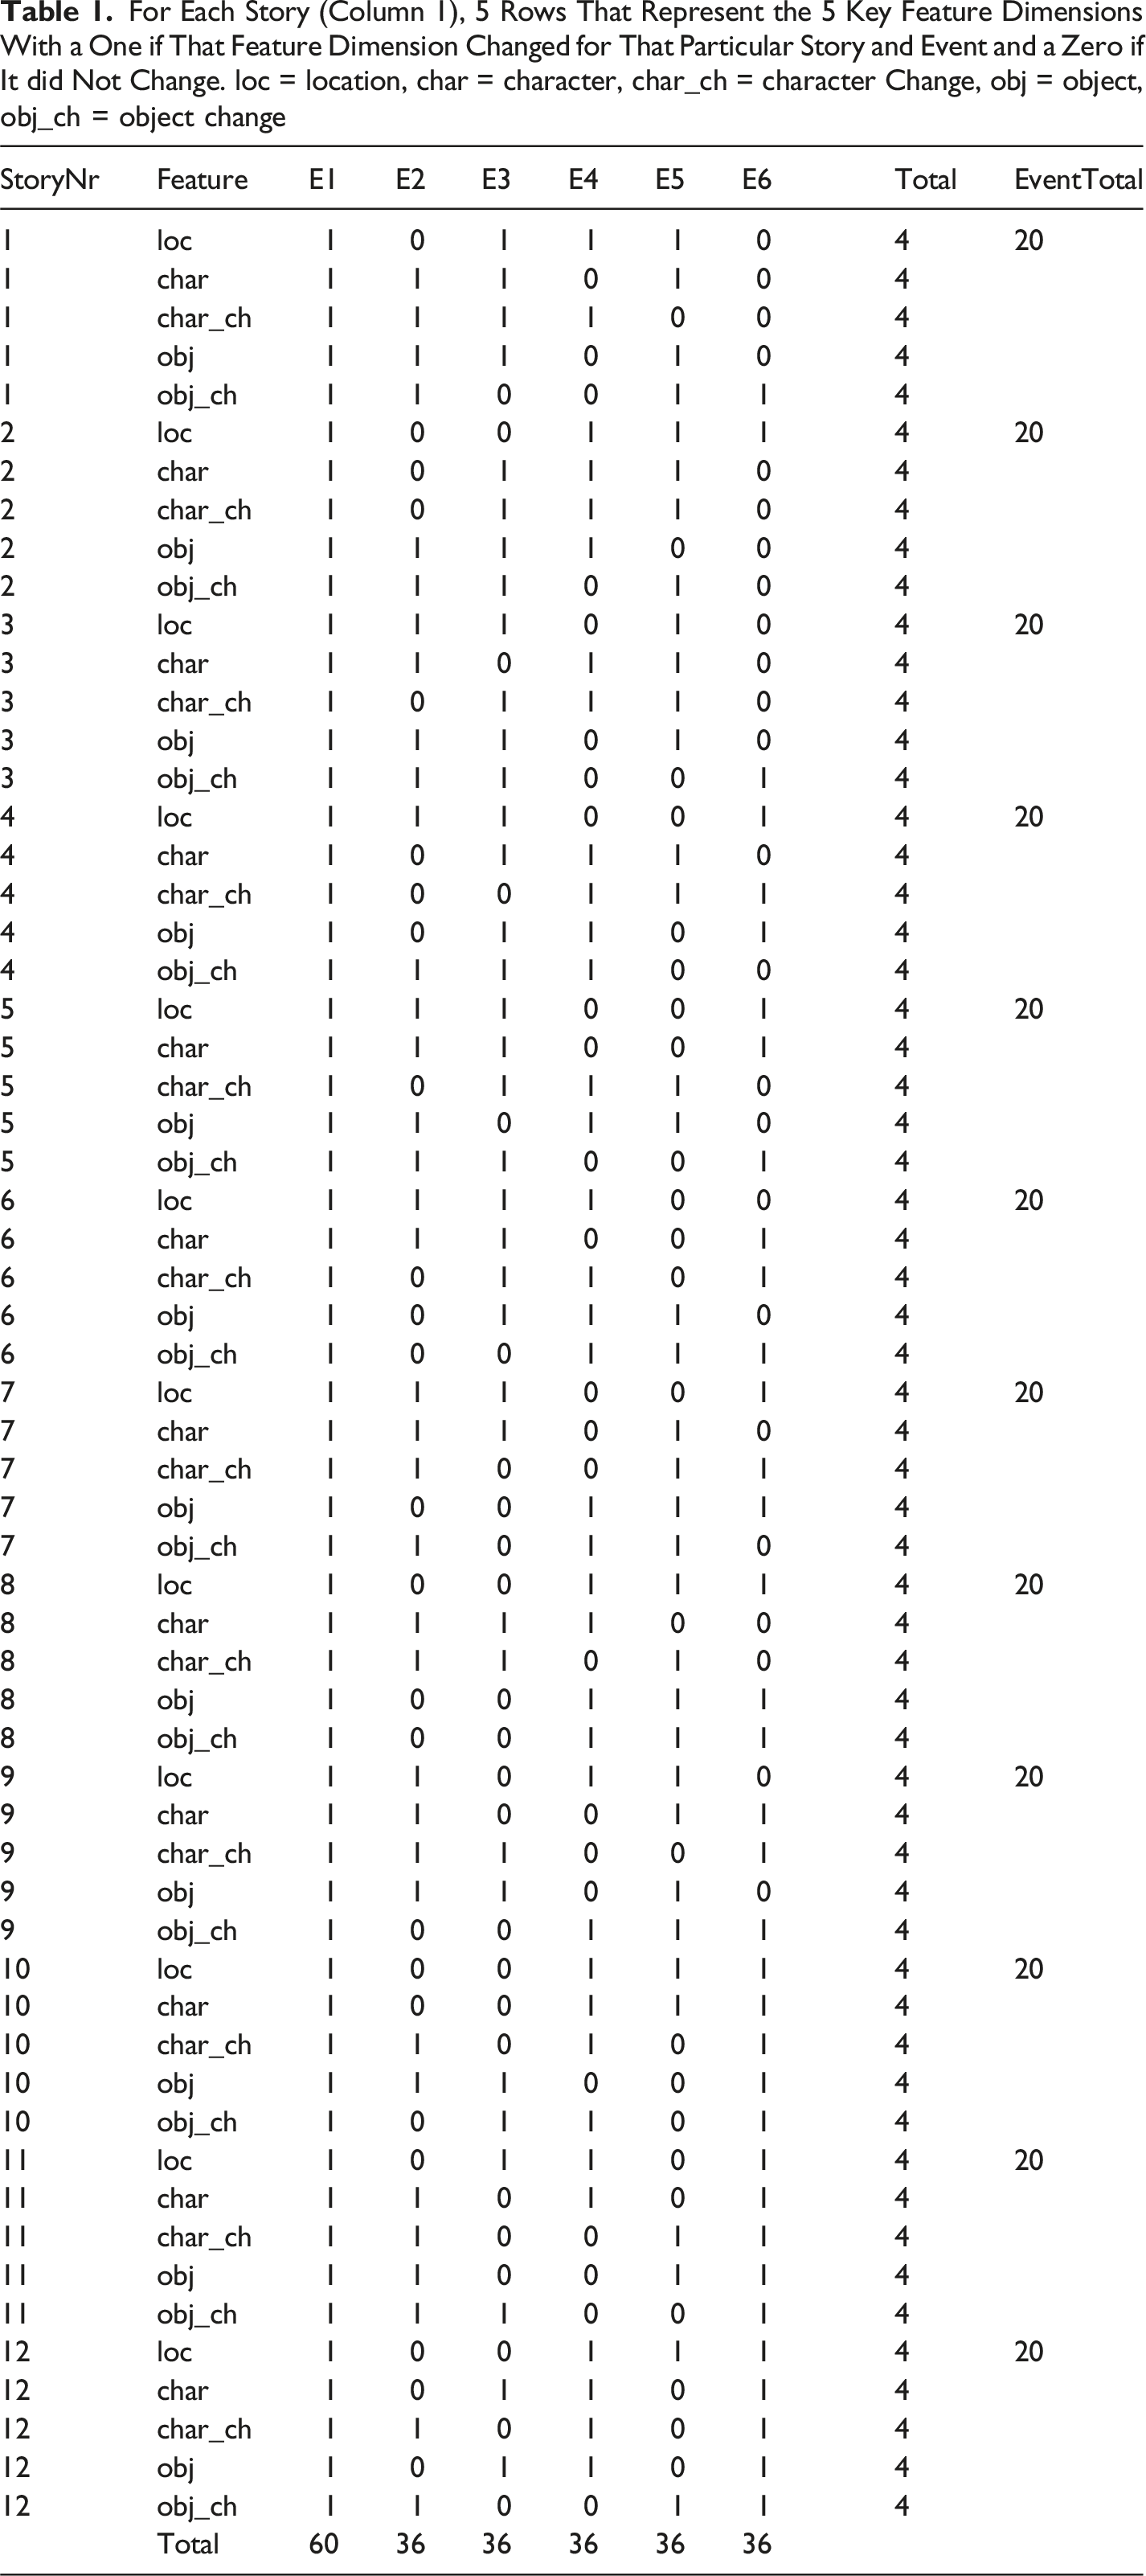
StoryNr
Feature
E1
E2
E3
E4
E5
E6
Total
EventTotal
1
loc
1
0
1
1
1
0
4
20
1
char
1
1
1
0
1
0
4
1
char_ch
1
1
1
1
0
0
4
1
obj
1
1
1
0
1
0
4
1
obj_ch
1
1
0
0
1
1
4
2
loc
1
0
0
1
1
1
4
20
2
char
1
0
1
1
1
0
4
2
char_ch
1
0
1
1
1
0
4
2
obj
1
1
1
1
0
0
4
2
obj_ch
1
1
1
0
1
0
4
3
loc
1
1
1
0
1
0
4
20
3
char
1
1
0
1
1
0
4
3
char_ch
1
0
1
1
1
0
4
3
obj
1
1
1
0
1
0
4
3
obj_ch
1
1
1
0
0
1
4
4
loc
1
1
1
0
0
1
4
20
4
char
1
0
1
1
1
0
4
4
char_ch
1
0
0
1
1
1
4
4
obj
1
0
1
1
0
1
4
4
obj_ch
1
1
1
1
0
0
4
5
loc
1
1
1
0
0
1
4
20
5
char
1
1
1
0
0
1
4
5
char_ch
1
0
1
1
1
0
4
5
obj
1
1
0
1
1
0
4
5
obj_ch
1
1
1
0
0
1
4
6
loc
1
1
1
1
0
0
4
20
6
char
1
1
1
0
0
1
4
6
char_ch
1
0
1
1
0
1
4
6
obj
1
0
1
1
1
0
4
6
obj_ch
1
0
0
1
1
1
4
7
loc
1
1
1
0
0
1
4
20
7
char
1
1
1
0
1
0
4
7
char_ch
1
1
0
0
1
1
4
7
obj
1
0
0
1
1
1
4
7
obj_ch
1
1
0
1
1
0
4
8
loc
1
0
0
1
1
1
4
20
8
char
1
1
1
1
0
0
4
8
char_ch
1
1
1
0
1
0
4
8
obj
1
0
0
1
1
1
4
8
obj_ch
1
0
0
1
1
1
4
9
loc
1
1
0
1
1
0
4
20
9
char
1
1
0
0
1
1
4
9
char_ch
1
1
1
0
0
1
4
9
obj
1
1
1
0
1
0
4
9
obj_ch
1
0
0
1
1
1
4
10
loc
1
0
0
1
1
1
4
20
10
char
1
0
0
1
1
1
4
10
char_ch
1
1
0
1
0
1
4
10
obj
1
1
1
0
0
1
4
10
obj_ch
1
0
1
1
0
1
4
11
loc
1
0
1
1
0
1
4
20
11
char
1
1
0
1
0
1
4
11
char_ch
1
1
0
0
1
1
4
11
obj
1
1
0
0
1
1
4
11
obj_ch
1
1
1
0
0
1
4
12
loc
1
0
0
1
1
1
4
20
12
char
1
0
1
1
0
1
4
12
char_ch
1
1
0
1
0
1
4
12
obj
1
0
1
1
0
1
4
12
obj_ch
1
1
0
0
1
1
4
Total
60
36
36
36
36
36