
Abstract
Prosocial behaviors, performed voluntarily by thinking of others, are crucial in maintaining relationships. Although prosocial behaviors are exhibited in every period of life, the frequency or form of these behaviors varies across life stages. Also, peer relationships have an increasing impact on behavior in adolescence and then young adulthood. Purpose of this study was to develop a scale to measure the prosocial behaviors of university students in peer relationships. The scale was applied to a total of 484 university students, 392 of whom were female and 91 of whom were male. The results of the exploratory factor analysis revealed that the scale consisted of 19 items and one factor. In the second stage of the study, confirmatory factor analysis was performed with the data collected from 494 university students, 390 female and 104 male, and the one-factor structure of the scale was confirmed (χ2/df = 3.05 (χ2 = 463.842, df = 152), RMSEA = .064 95% [.058–.071], SRMR = .032, CFI = .950, TLI = .943). Cronbach’s Alpha (.920) and McDonald’s Omega (.921) were calculated to test the reliability of the scale. These results suggest that Prosocial Behavior in Peer Relationships Scale provides valid and reliable measurements for assessing university students’ prosocial behaviors in peer relationships.
Introduction
Prosocial behaviors, performed voluntarily by thinking of others, are crucial in maintaining relationships. According to Rosenhan (1978, p. 103), Auguste Comte was the first to use the concept of prosocial behavior and defined this concept as “interest shown to others.” Prosocial behaviors are voluntary behaviors that assist an individual or group without expecting any external reward or benefit (Eisenberg & Mussen, 1997). Moreover, prosocial behaviors, which can be expressed as positive interpersonal relationships, include behaviors such as empathy, cooperation, sharing, altruism, helping, and consoling, which are for the happiness and benefit of others and are called “positive social behaviors“ (Uzmen & Mağden, 2013).
Although prosocial behaviors are exhibited in every period of life, the frequency or form of these behaviors varies across life stages. In adolescence, a significant change occurs in the context of prosocial behavior. As adolescents spend more and more time with peers and less time with parents (Larson & Richards, 1991), positive social interactions between peers become more important. Accordingly, peer relationships have an increasing impact on behavior in adolescence and then young adulthood (Brown, 2004; Gardner & Steinberg, 2005), and peers can influence each other’s risk-taking or antisocial and prosocial behavior (Allen & Antonishak, 2008; Brown et al., 2008; Van Hoorn et al., 2016). Moreover, risky behaviors have been demonstrated to decrease when protective peer behaviors, like participating in constructive or prosocial activities, are adopted (Mason et al., 2019). Therefore, as the importance of the peer circle increases, the importance of prosocial behaviors in friendship relationships may also increase. However, as Caprara et al. (2005) indicated, less information is available about the psychological implications of prosocial behavior for one’s adjustment and well-being in later life than in childhood.
Although prosocial behaviors, which are essential for social life and friendship relationships, are the subject of many studies, there are still debates on the content of the concept and how to measure it. The concept was studied in its various dimensions in the studies on the measurement of prosocial behaviors. Although the earlier studies (Inderbitzen & Foster, 1992; Midlarsky & Hannah, 1985; Mussen & Eisenberg, 1977) considered prosocial behavior as a single dimension or only the dimensions of sharing and helping, different sub-dimensions were included in the literature in later studies. While Caprara and Pastorelli (1993) discussed prosocial behavior with the dimensions of altruism, trust, and cooperation, Jackson and Tisak (2001) discussed prosocial behavior in three sub-dimensions as ‘helping, sharing, and comforting' in their study. Carlo and Randall (2002) stated that there were six prosocial behavior dimensions based on situational and personal motivators. However, the most common questionnaire, The Adult Prosocialness Behavior Scale (APBS, Caprara et al., 2005), is a one-dimensional measure to pinpoint actions and feelings in any of the four domains: caring, sharing, assisting, and empathetically recognizing the needs and wants of others. However, it is also observed that a two- or three-dimensional structure is proposed for different cultural adaptations of the APBS (e.g., Biagioli et al., 2016; Carrizales et al., 2019). Also, Badenes-Ribera et al. (2023) stated in their reliability generalization study of APBS that the study language and the target population together explained 48.7% of the overall variation in Cronbach’s alpha coefficients. Therefore, the dimensions and structure of prosocial behaviors in adults may vary according to culture, and there is a need for culturally specific measurements.
In addition, when we looked at the methods of measuring prosocial behavior, we saw different scales that measure global and context-specific prosocial behavior. It was stated that measuring Global Prosocial Behaviors was limited because an individual’s motivation to help varies from situation to situation and person to person. However, measuring context-specific prosocial behaviors and being able to make specific measurements of prosocial behavior were advantageous in addressing these situations (Carlo & Randall, 2002). Therefore, measuring context- and relationship-specific prosocial behavior in addition to a general prosocial behavior measurement will provide more detailed and reliable information about students’ behaviors.
Since studies on prosocial behavior focus mostly on childhood, there is a lack of clarity in the literature on its dimensions, and context-specific measurements are becoming more prominent, there is a need for scale development studies on this subject. Since the university is a place where young people with many different backgrounds and characteristics come together, it can play an important role in the socialization process of students. According to Wiedman's (1989) Socialization Model of University Students, interpersonal interactions and peer groups can play a role in the socialization of university students, and at the end of this socialization process, students’ career decisions, preferred lifestyle and values can be determined (Weidman et al., 2014). Therefore, peer relationships have a special place in the socialization process of university students and it is important to address prosocial behaviors that will pave the way for the strengthening of these relationships, especially in the context of peer relationships.
Standard measurement tools developed to measure context-specific prosocial behaviors are limited. It is seen that researchers have tried different methods to measure such prosocial behaviors. For instance, in the study of Laninga-Wijnen et al. (2018), peer nominations on four items were used to explain peers’ perceptions of prosocial behavior. Choukas-Bradley et al. (2015) used hypothetical scenarios to assess peer-related prosocial behaviors. When the literature was examined, no study was found that included measuring the prosocial behavior levels of university students in the context of peer relations. Considering that prosocial behaviors are influenced by cultural and social norms (Feygina & Henry, 2015), developing a scale that measures prosocial behaviors in peer relationships specific to the developmental period of university students can contribute to the field. In this study, a scale development study was conducted to measure the prosocial behaviors of university students in peer relationships.
Method
Transparency and Openness
This study’s design and its analysis were not pre registered. Data, analysis code, and research materials are not available. Mokken package in RStudio 4.2.2 was used for Mokken Homogeneity Model (MHM), PerFit package in RStudio 4.2.2 was used for detecting aberrant item scores, the SPSS 26.0 program was used for EFA, and the MPLUS program (Muthén & Muthén, 2019) was used for DFA.
Participants
In this study, which aimed to develop the PBPRS, data were collected and analyzed from two different study groups. While the data obtained from the first study group were analyzed with EFA, the data obtained from the second research group were examined for validity with CFA and criterion validity.
Study Group 1
To examine the scale’s construct validity by exploratory factor analysis (EFA), data were collected from 612 university students. The data were cleaned for both univariate and multivariate outliers. Univariate outliers were identified by calculating standard z-scores, with values exceeding the ±4 z-score threshold being excluded. Multivariate outliers were assessed using Mahalanobis distance, with a significance level of p < .001. Following the removal of outliers, the final dataset comprised 544 individuals. Afterward, individuals with aberrant responses were excluded from the data set by considering the lzploy person fit statistic and a data set of 484 individuals was reached. Of the 484 students in the data set, 392 (81%) were female and 91 (18.8%) were male, one of whom indicated their gender as the other. Most of the students (93.4%) were between 18 and 24. When the distribution by grade level is analyzed, it is seen that six (1.2%) of the students were preparatory, 71 (14.7%) were first-year students, 103 (21.3%) were sophomores, 240 (49.6%) were juniors, and 64 (13.2%) were seniors.
Study Group 2
Confirmatory factor analysis (CFA) and criterion validity of the scale were performed with the data collected from this study group. In this context, data were collected from 636 university students, but multivariate outliers were controlled by Mahalonobis distance, standard z scores controlled univariate outliers, and outliers were removed (n = 544). Afterward, individuals with aberrant responses were excluded from the data set by taking the lzploy person fit statistic into consideration, and the final data set consisting of 494 individuals was reached. 390 (78.9%) of the participants were female, and 104 (21.1%) were male. Most of the students (92.1%) were between 18 and 24. Finally, 12 (2.4%) of the students were preparatory, 90 (18.2%) were first-year students, 100 (20.2%) were sophomores, 151 (30.6%) were juniors, and 141 (28.5%) were seniors.
Data tools
Prosocial Behavior in Peer Relationships Scale (PBPRS): While writing the items for the pilot form, a literature review was used, and interviews were conducted with 13 university students. The written items were submitted to expert opinions, and the researchers formed the 34-item pilot form after two different panels. The validity and reliability studies on this scale are detailed in the findings section. Examples of the items in the scale are “I share my friends’ happiness when they achieve success”, “I spare time for my friends when they need it” or “I try to prevent my friends’ self-destructive behaviours”.
Adults’ Prosocialness Scale (APS): Developed by Caprara et al. (2005) and adapted by Bağcı and Öztürk Samur (2016), the original APS consists of four sub-dimensions and 16 items. However, according to the results of the EFA and CFA conducted during the adaptation study, it was observed that the Turkish version of the APS had a unidimensional structure (Bağcı & Öztürk Samur, 2016). The APS was used for similar scale validity. In this study, Cronbach’s alpha coefficient of the scale was .946, and McDonald’s ω was 0.949.
Process
Ethics committee permission was obtained from [details omitted for double-anonymized peer review]. Scale development studies are empirical studies with scientific processes that should be followed, and the procedures carried out in this study by the principles of scale development (Crocker & Algina, 1986; Cohen & Swerdlik, 2009; DeVellis, 2017) are explained below. 1. In the first stage, the instruments measuring prosocial behavior in Türkiye were examined. Only a scale adapted to Turkish culture by Bağcı and Öztürk Samur (2016) was found. When the items of the related scale were examined, it was decided to develop a scale since it was deemed inadequate to measure prosocial behavior specific to peer relationships since it included general statements about prosocial behavior. 2. In the second stage, after deciding to develop the scale, the construct to be measured is defined, and the process of writing items that are indicators of the construct starts. In this context, the literature review results, and expert opinions were utilized. The construct of Prosocial Behavior in Peer Relationships was defined based on existing literature and theories related to prosocial behavior, including helping, sharing, and supporting others, which play a key role in fostering social cohesion in peer relationships. To ensure that the scale captured culturally and developmentally appropriate forms of prosocial behavior, we conducted semi-structured interviews with 13 university students, focusing on their everyday experiences of helping, supporting, and cooperating with peers. Five of the participants were male and eight were female. Three of the participants were sophomores, five were juniors and five were seniors. The interviews lasted an average of 12 minutes, and the voice recordings taken during the interviews were converted into transcripts. These interviews were transcribed verbatim and analyzed using thematic coding by two independent researchers (Braun & Clarke, 2006), ensuring initial reliability through investigator triangulation (Patton, 1999). A third researcher joined for a panel discussion to synthesize codes and identify recurring behavioral themes specific to university students’ peer contexts. According to the results of the detailed literature review and interviews, 41 draft items were then generated based on these themes.
Although some items (e.g., “I share my friends’ happiness when they achieve success”) may appear general, they emerged directly from participant descriptions of culturally salient behaviors that reflect Turkish norms of collectivism, emotional support, and academic solidarity. This approach aligns with the view that prosocial behaviors are shaped by cultural and social norms (Feygina & Henry, 2015) and ensures that the resulting scale items are not only grounded in theory but also authentically reflect the developmental and cultural realities of university student life in Türkiye. 3. The items were then sent to four field experts to determine the content validity of the items. The experts were asked to express their opinions for each item as “Appropriate,” “The item needs some correction,” “The item needs much correction,” and “The item is not appropriate.” The Davis technique was used to evaluate the expert opinions. In the Davis technique, the number of experts who rated the items as “appropriate” and “the item needs some correction” is divided by the total number of experts, and the content validity index for each item is calculated with the value being required to be above 0.80 (Davis, 1992). 4. The written items were examined in detail by the researchers and measurement and evaluation experts in meetings organized in two different sessions. A total of seven items that were similar in terms of overlapping content, difficult to understand, items that were considered not necessary, and items with a content validity index below 0.80 were removed from the draft scale, and a trial form of the scale was created with a total of 34 items. 5. After the instructions and items of the scale were finalized, the draft items were applied to 14 students as part of a pilot study, and it was seen that there were no incomprehensible points in the items. 6. A trial application of the draft scale was initiated through “Google Forms.” The google forms link is barcoded and printed on small sheets of paper. Faculty members were contacted in advance, a common day and time was determined for the application, classes were entered, and after explaining the purpose of the study, the barcodes were distributed to the students who volunteered. Students were expected to answer the scale in the classroom and then the barcodes were collected and taken back. Faculty members who did not find it appropriate to conduct the application during class time announced the link of the survey in the class WhatsApp groups. The data obtained from the trial application was subjected to various psychometric analysis processes. Thus, evidence for the construct validity of the draft scale and results regarding the reliability of the scores obtained from the scale were obtained. The procedures performed at this stage are explained in detail in the findings section.
Data Analysis
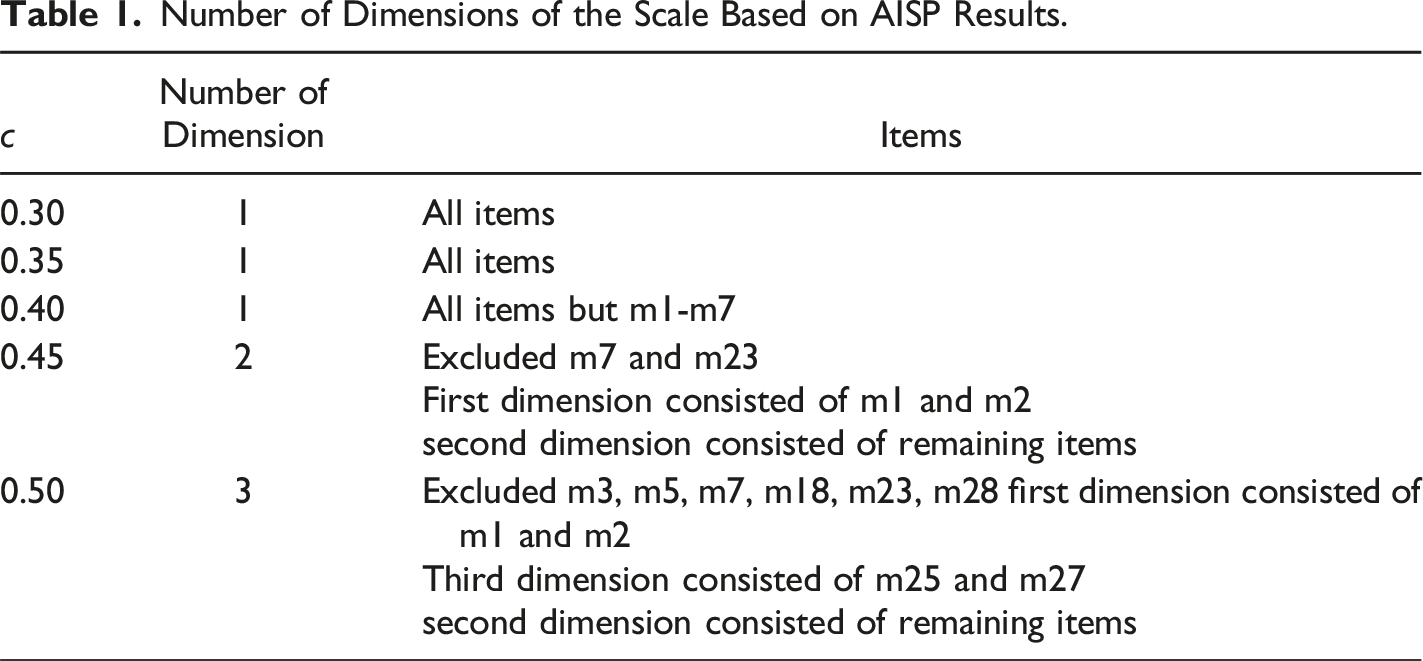
Within the scope of the validity study of the Prosocial Behavior Scale, EFA was applied to reveal the scale’s factor structure. In addition, it was stated that construct validity evidence based on a single method has question marks, which is not sufficient (Gudergan et al., 2004). In this context, the data obtained from the first study group were investigated with the Automatic Item Selection Procedure (AISP) in the context of the MHM, one of the nonparametric item response theory models, and then EFA was carried out. The structure of AIPDS, whose factor structure was revealed through EFA and MHM, was tested with CFA with a separate data set. At the same time, similar scale validity was examined using the Prosocial Scale for Adults (Bağcı & Öztürk Samur, 2016) with the data collected from the second study group. The assumptions of factor analyses were tested for the first and second data sets, and then analyses were performed. Univariate extreme values in the data set were controlled with standard z scores, and multivariate extreme values were controlled with Mahalonobis distance. Univariate extreme values in the data set were controlled with standard z scores, and multivariate extreme values were controlled with Mahalonobis distance. At the end of the checks, data determined to have extreme values was removed from the data set.
MHM assumptions were tested to scale the data collected from the first study group according to MHM. The most critical assumption of MHM is the monotonicity assumption. For this assumption, the crit value is analyzed. The reference intervals for the interpretation of the obtained crit values are defined as crit <40 appropriate, 40 ≤ crit <80 suspicious, and crit >80 serious incompatibilities (Crişan et al., 2019). The indicator of whether the data set is scaled according to the MHM is the H coefficients. The evaluation criteria Mokken (1971) defines are used to evaluate the H coefficients. These coefficients are expected to be at least 0.30.
An important factor that affects the validity of test scores and reduces validity evidence by distorting the data set is aberrant item scores (Meijer & Nering, 1997). Individuals with aberrant item scores are determined by parametric and nonparametric person-fit statistics. In this study, individuals with aberrant item scores were determined by parametric lzpoly statistic. This statistic is assumed to be normally distributed and values less than −1.645 are marked as aberrant (Meijer, 2003). In this study, individuals’ lzpoly values were determined and those with a value below −1.645 were marked as individuals with aberrant item scores. Then, AISP was executed for the dataset cleaned from aberrant item scores.
Within the context of MHM, AISP is used to determine how different sets of items are structured (Emons et al., 2012). AISP provides one-dimensional scales. Thus, an estimate can be made about the dimensional structure of the scale before factor analysis (Sijtsma & Molenaar, 2002; Şengül Avşar, 2022). AISP makes predictions based on a specified threshold value of c. This value is expected to be increased by .10 to be at least .30. There is no ideal c point, but it is recommended to examine item sets at cut-off values ranging from .30 to .55 (Emons et al., 2012).
The maximum likelihood (ML) method was used among the estimation methods. Also, the cutoff value for factor loadings was determined to be 0.50 for EFA and CFA (Hair et al., 2009). For CFA, model data fit was examined with chi-square (χ2), Comparative Fit Index (CFI), Tucker Lewis Fit Index (TLI), Root Mean Square Errors of Approximation (RMSEA), and Standardized Root Mean Square Residual (SRMSR) (Brown, 2015).
Since the chi-square test statistic is based on the assumption of multivariate normality and is sensitive to sample size (Kline, 2005), it is recommended to use the χ2 /df ratio instead of chi-square, and values less than 3 indicate fit (Kelloway, 1998; Schermelleh-Engel et al., 2003). For SRMR, values between 0.10 and 0.05 indicate acceptable fit, and values less than 0.05 indicate good fit; for RMSEA, while values between 0.080 and 0.05 indicate acceptable fit, values less than 0.05 indicate good fit (Jöreskog & Sörbom, 1993), for CFI and TLI, values greater than 0.90 indicate acceptable fit. Values below 0.95 indicate an acceptable fit (Hu & Bentler, 1999).
Composite reliability (CR), Cronbach’s alpha, and McDonald’s Omega reliability coefficients were computed to ascertain the reliability of the data set obtained from the study groups. Cronbach’s Alpha and McDonald’s Omega reliability coefficients were estimated with the psych R package (Revelle, 2019), and CR was calculated with Excel. These reliability coefficients being at least .80 is considered an indication that the scores obtained from the scale are reliable (Hayes & Krippendorff, 2007).
In this study, measurement invariance across genders was also examined. Measurement invariance is an analogical prerequisite for making meaningful group comparisons (Vandenberg & Lance, 2000). Widaman and Reise (1997) defined four stages to test measurement invariance: configural, metric, scalar, and strict. Configural invariance means that the observed measurements represent the same constructs in each group. Metric invariance tests whether individuals attribute the same meaning to the latent structure examined; in other words, if metric invariance is achieved, it means that each item contributes to the latent structure similarly across groups (Putnick & Bornstein, 2016). Scalar invariance tests whether the factor loadings of the structure and the intercepts are equal in groups. (Van de Schoot et al., 2012). Strict invariance tests the equality of error terms across groups in addition to scalar invariance. Measurement invariance was performed with the R statistical package lavaan (Rosseel, 2012).
Findings
During the development process of PBPRS, MHM, EFA, and CFA were used for construct validity. At the same time, criterion and convergent validity were analyzed to provide evidence for the validity of the PBPRS. The reliability study calculated Omega and Cronbach alpha using the data collected from both study groups. MS, Guttman Lambda-2, and LCRC coefficients were calculated using the data collected from the first study group. The findings related to validity and reliability studies are presented below.
Construct Validity of the Scale with the Mokken Homogeneity Model
When scaling the data according to the MHM, the monotonicity assumption was examined first. For this purpose, crit values were considered, and it was determined that item number 33 was not fit for MHM scaling. This item was removed, MHM assumptions were rechecked, and the data set was determined to meet the MHM assumptions. The H coefficients indicate whether the data set is scaled according to the MHM. In the evaluation of the H coefficients, the criteria defined by Mokken (1971) were used, and it was seen that all items were scaled according to the MHM (H = .37 to H = .61).
After the MHM analysis, individuals with an aberrant response were identified. It is recommended that individuals with aberrant responses be removed from the data set, especially in scale development studies, to investigate validity (Şengül Avşar, 2023). For this, the lzploy person fit statistic was considered, which is stronger than the individual fit statistics because it is parametric. In order to use this statistic, the data must fit with the Graded Response Model (GRM), one of the parametric item response theory models. For this, GRM estimations were made using the RStudio mirt package. When GRM model fit statistics were examined, M2 (2147.22, p = .00), RMSEA = 0.078, SRMR = 0.061, TLI = 0.959, CFI = 0.962) were obtained. Toland (2014) stated that model-data fit is achieved in M2 values that are not statistically significant, but this statistic tends to be significant even in very small incompatibilities, so RMSEA values should be examined. Accordingly, it can be said that the model-data fit is achieved. After the fit to the GRM was observed, the individuals with aberrant responses were removed from the data set by taking into account the lzploy statistic from the individual fit statistics, and the data set consisting of 484 individuals was reached.
Number of Dimensions of the Scale Based on AISP Results.
Exploratory Factor Analysis
We conducted EFA on the items scaled according to the MHM. EFA results are commonly taken into consideration in factor determination in scale development. Three preliminary EFA assessments were conducted in accordance with the guidelines outlined by Mvududu & Sink (2013). These assessments included Bartlett’s test of sphericity, the Kaiser-Meyer-Olkin measure of sampling adequacy, and the examination of the inter-item correlation matrix. Kaiser-Meyer-Oklin’s (KMO) and Barlett’s sphericity test results were used to evaluate whether the sample size was suitable for factor analysis. The KMO value was found to be .966 and Kaiser & Rice (1974) defined values above .90 as being excellent, and the results of Bartlett’s test of sphericity (B [528] = 9439.454, p < .001) revealed that the data were factorable. It was found that there were high inter-item correlations (r > .80) between items (20 and 34; 30 and 29; 26 and 25), which resulted in three items being removed for item redundancy after reviewing by experts. After removing items, the average inter-item correlation was within an acceptable range (Clark & Watson, 1995). Firstly, the principal axis factor method was performed with 30 items using Quartimax, one of the orthogonal rotation methods, without limiting the number of dimensions. Quartimax was chosen based on its ability to provide easier interpretation of results and produce a more parsimonious solution, ensuring clarity and simplicity in the factor structure, as suggested by Hair et al. (2009). An important consideration in factor rotation is determining which rotation method will provide valid and meaningful results for the researchers. We established the following combined guidelines for item retention: (a) factor loading (<.55 (good); Comrey & Lee, 1992), (b) removing cross-loading values of .2 or greater on more than one factor (Tabachnick & Fidell, 2007), (c) number of items per factor with at least three items, and (d) communality values of less than .40 (Watson, 2017).
At first, EFA pinpointed a solution with five factors, which accounted for 51% of the variance and had an eigenvalue meeting or exceeding 1 based on the Kaiser rule. We conducted parallel analysis (Horn, 1965) with EFA to determine the initial factor structure and dimensions with the R package (O’Connor, 2024). The results endorsed a single-factor solution with original eigenvalues (13.480) exceeding the parallel analysis 95th percentile (1.560) and mean eigenvalues (1.495). In addition, as seen in Figure 1, there was a distinct break between factors 1 and 2 at the scree plot, indicating a single factor supporting parallel analysis and AISP. Scree plot.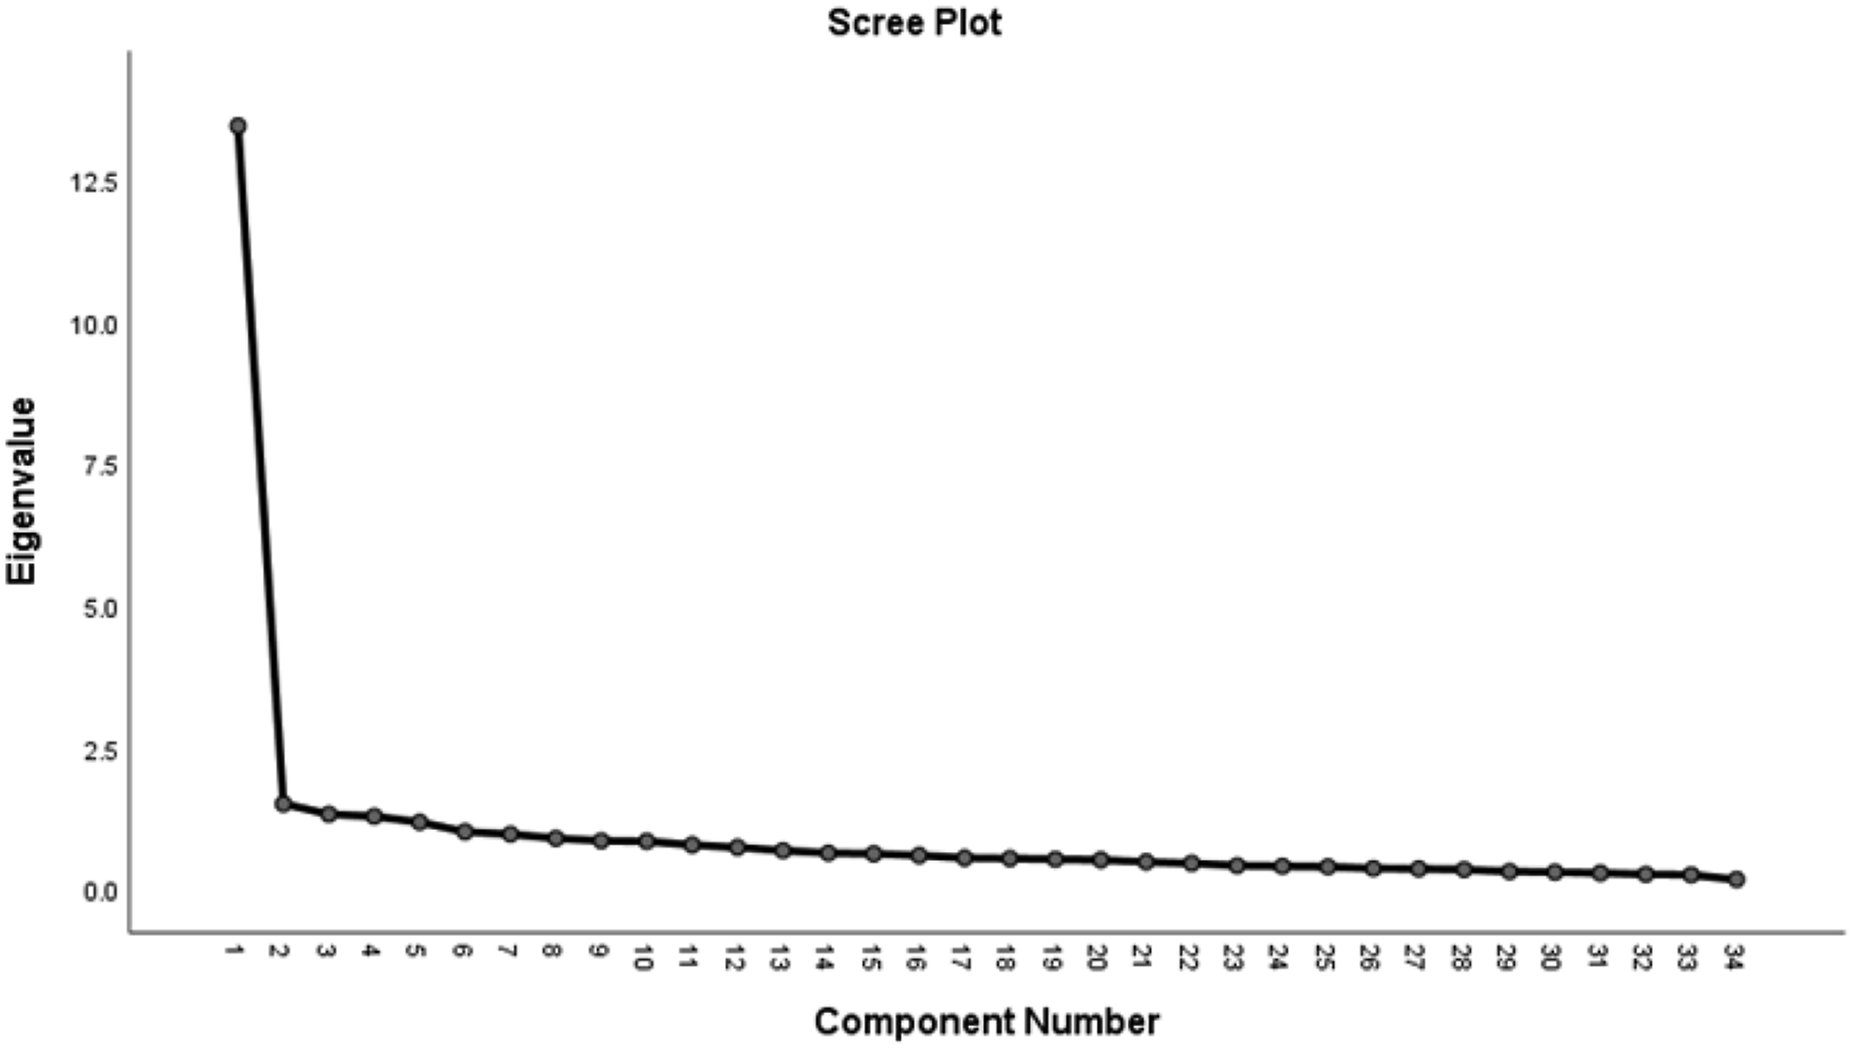
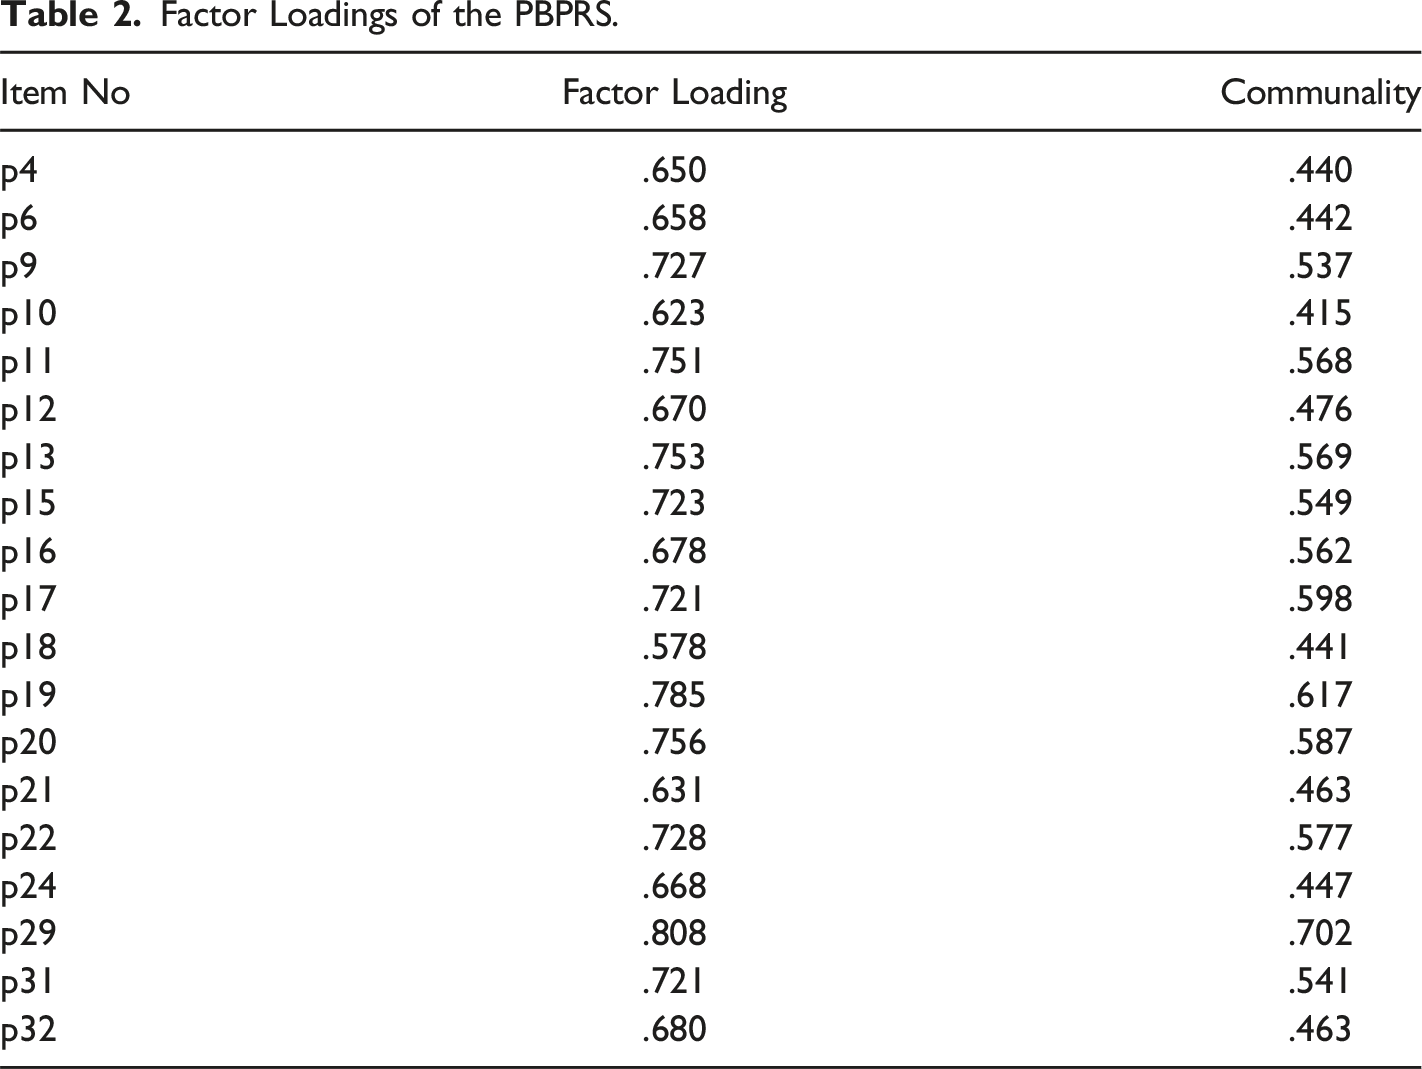
Factor Loadings of the PBPRS.
Within the scope of the Mokken analyses, it was determined that a single-factor structure was reached by discarding one item according to AISP. EFA results are commonly taken into consideration in factor determination in scale development studies. However, evaluating the AISP and EFA results together is recommended.
The scale, determined to have a unidimensional structure according to the EFA results, was rescaled according to the MHM. Thus, the factor structure obtained according to EFA was replicated with nonparametric item response theory. As a result of the scaling, a unidimensional measurement tool was reached with 19 items that met the assumptions required for Mokken scaling according to AISP. The results obtained are given in the Appendix.
Confirmatory Factor Analysis
Standardized Factor Loads (λi) of the Items of PBPRS and Explained Variance (R2) Values.
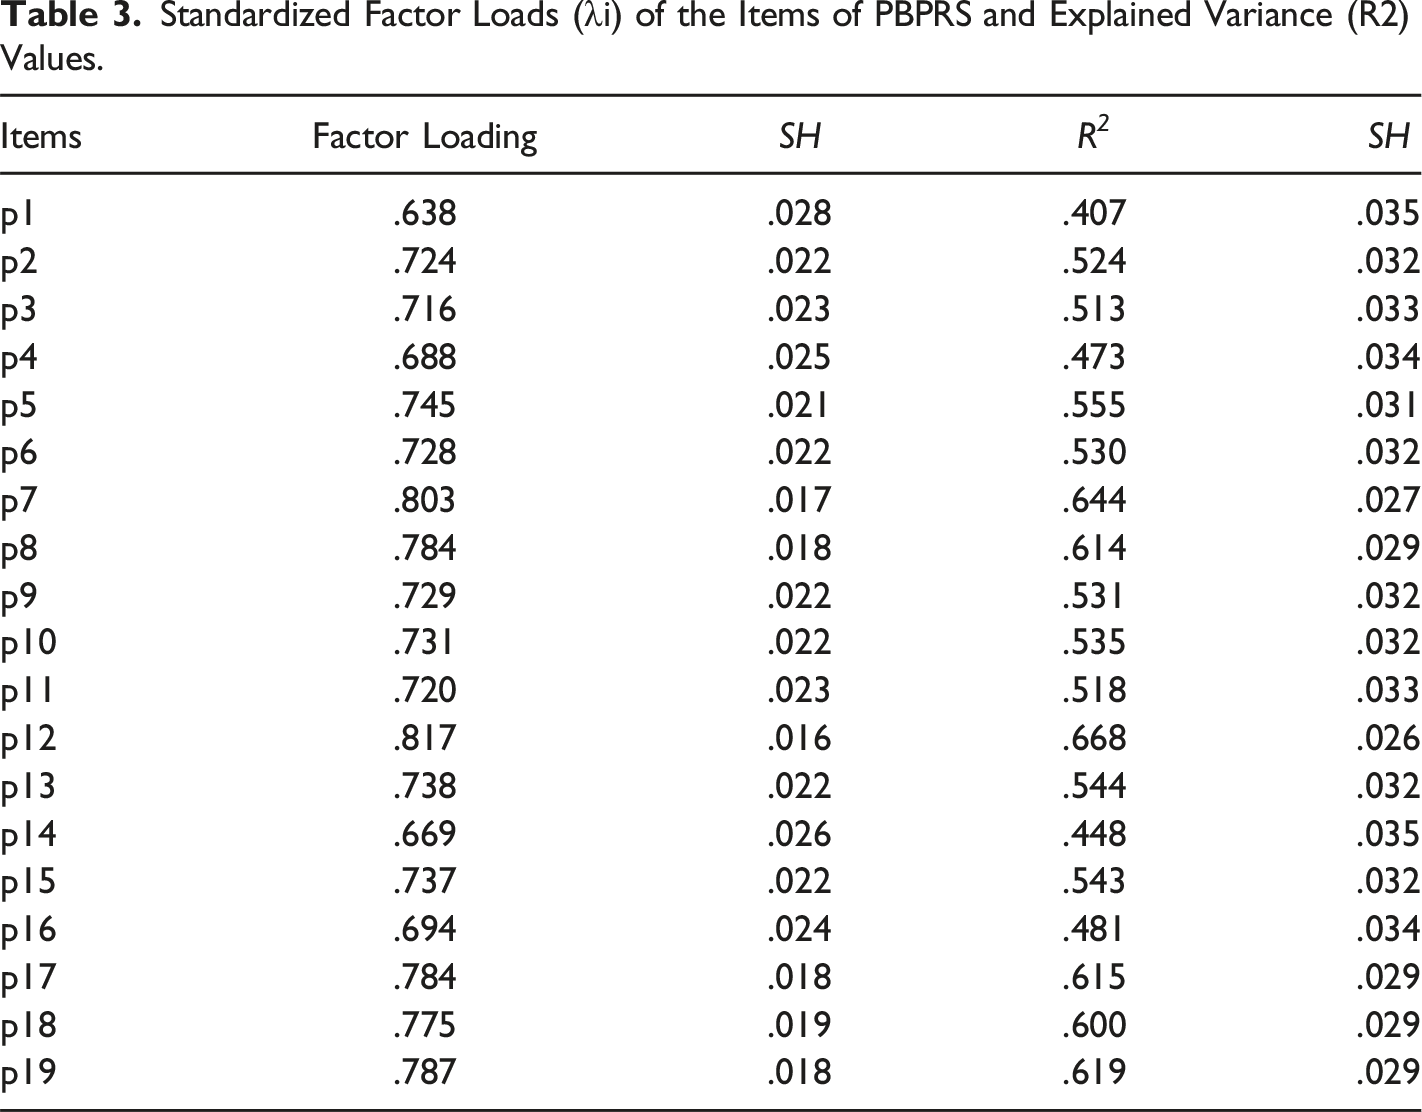
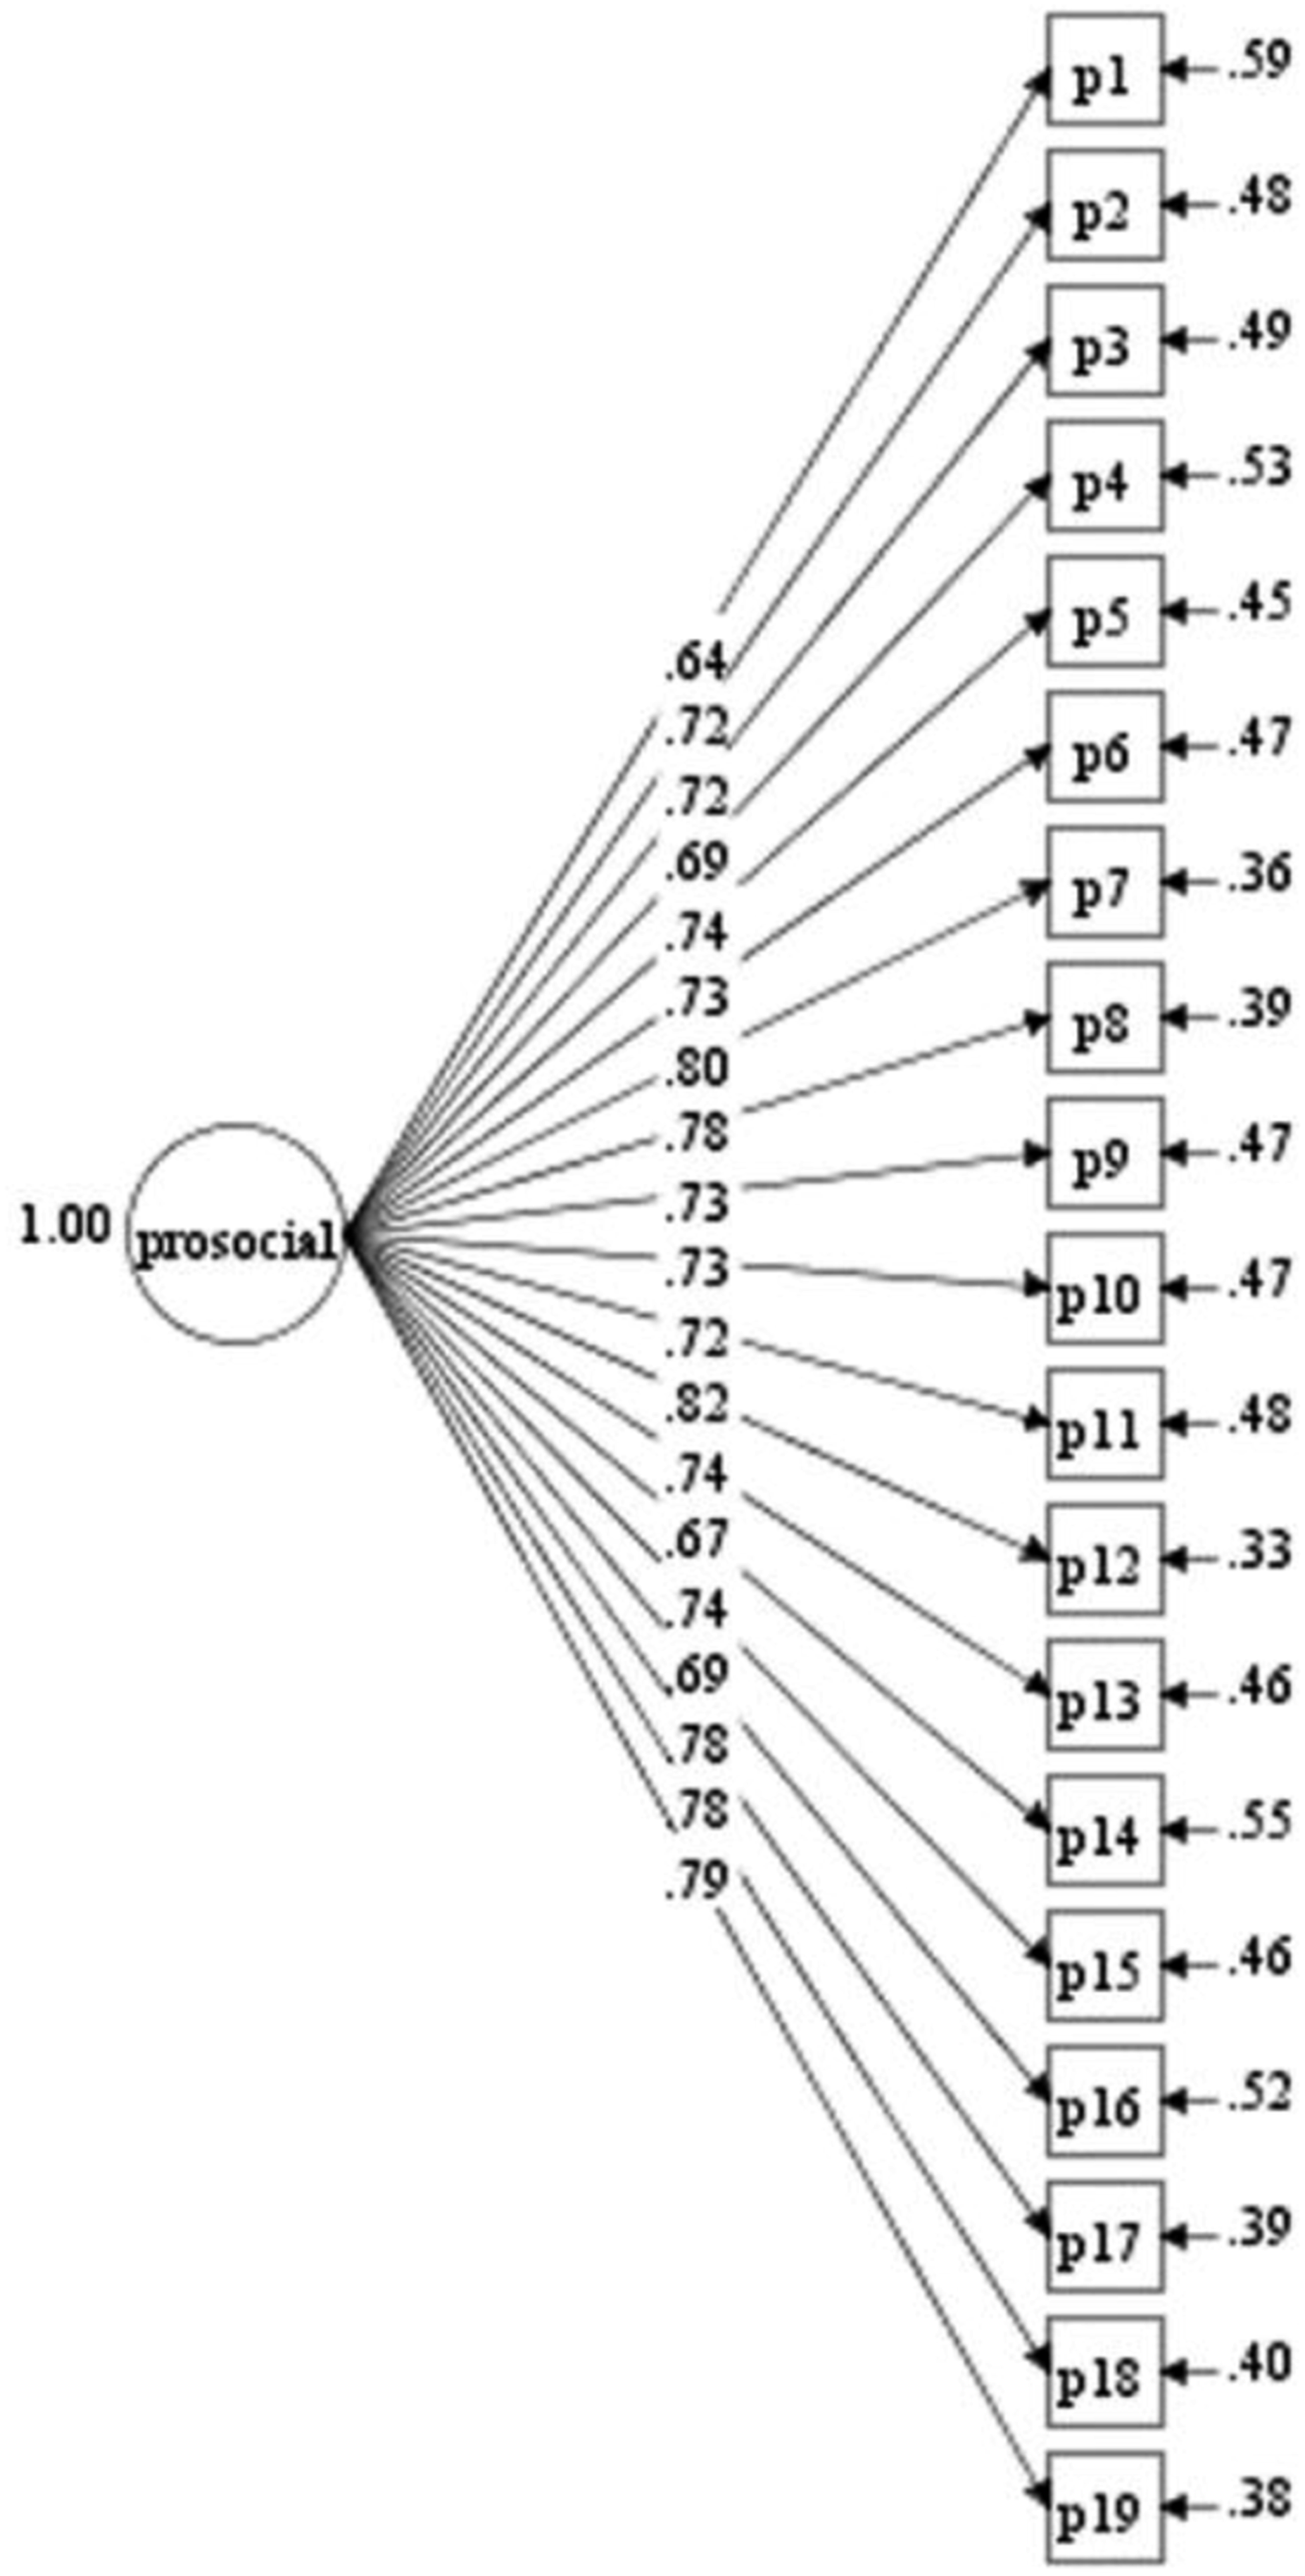
Diagram of standardized factor loadings of the PBPRS.
Table 3 shows that the item loadings in the single-factor prosocial behavior scale are between .638 and .817, and the variance values explained by the items are between .407 and .668. It is seen that the factor loadings of the items are higher than the specified factor loading of 0.55 (Comrey & Lee, 1992).
For the final single factor 19-item PBPRS, Cronbach’s Alpha and McDonald’s Omega were calculated as internal consistency. Estimates of internal consistency reliability for the scale were found to be .920 and .921, respectively. The item-rest correlation values were between .493 and .763. Internal consistency reliability estimates were acceptable (Nunnally & Bernstein, 1994).
Convergent and Criterion Validity of PBPRS
Fornell & Larcker (1981) stated that average variance explained (AVE) is used to evaluate the degree of variance shared between the latent variables of the model. In this study, the AVE value was higher than .5 (.546), and the composite reliability value (.958) was higher than .70. Overall, we conclude that the PBPRS exhibits convergent validity.
Within the scope of criterion validity, the Adults’ Prosocialness Scale (Bağcı & Öztürk Samur, 2016) was used. In order to test the construct validity of the APS in the obtained data, firstly, a CFA was performed, and it was concluded that the obtained goodness of fit values (CFI = .93, TLI = .92, RMSEA = .08, SRMR = .03) were at acceptable goodness of fit values. For criterion validity, the relationship between the Adults' Prosocialness Scale (APS) and the PBPRS was examined by Pearson correlation analysis. It was found that there was a statistically significant positive relationship between the APS and the PBPRS (r = .75; p < .01).
Measurement Invariance
Fit Statistics for Multi-Group CFA.
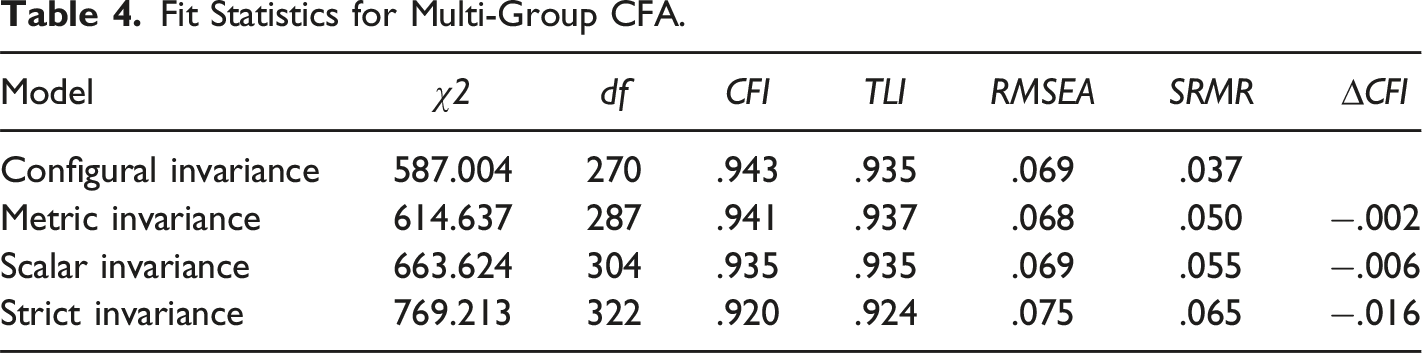
First, the assumption of configural invariance was satisfied, as evidenced by the model fit indices (χ2 [270] = 587.004, p < .001, CFI = .943, TLI = .935, RMSEA = .069, SRMR = .037). The model fits for metric, scalar, and strict invariance (see Table 4), and invariant models were acceptable fit. The ∆CFI value (−0.01 ≤ ΔCFI ≤0.01) between models showed that measurement invariance was achieved across increasingly constrained metric (ΔCFI = −.002) and scalar ( ΔCFI = .006) configurations. Metric invariance indicates factor loadings; scalar invariance shows that the item slope coefficients are invariant across genders. Consequently, factorial solid invariance was established.
Discussion
Studies and research on prosocial behaviors have been increasing in recent years. The field of mental health is also closely interested in this subject. The present study developed the Prosocial Behavior in Peer Relationships Scale (PBPRS) to explain and measure university students’ prosocial behaviors in peer relationships.
Construct validity analyses regarding the validity of the scale revealed that the scale consisted of a single dimension and 19 items. This result differs from the studies suggesting that prosocial behavior has a multidimensional structure (e.g., Caprara & Pastorelli, 1993; Carlo & Randall, 2002; Jackson & Tisak, 2001). Although there is no similar study in the domestic literature, it is possible to find studies in global literature which emphasize the importance of prosocial behavior within the context of peer relationships (McDonald et al., 2023). Kanacri et al. (2021) emphasized that the multidimensional structure of prosocial behaviors emerged due to researchers’ desire to evaluate them in a wide range; measuring context-specific prosocial behavior may be helpful in better understanding the psychological mechanisms and motivation behind the behavior. In this context, measuring prosocial behaviors in the context of peer relationships of individuals in young adulthood is crucial. Therefore, it is unsurprising that a multidimensional structure is found in scales measuring prosocial behaviors as a general feature. However, a unidimensional structure is reached when measuring prosocial behavior in context-specific and more specific relationships. In this study, which focused only on prosocial behavior in peer relationships, the scale was found to be unidimensional according to Mokken and EFA analyses, and the unidimensional structure was proven to work with CFA. In addition, it is seen that the Adult Prosocialness Scale, which was originally three-dimensional but adapted to Türkiye by Bağcı and Öztürk Samur (2016), has a unidimensional structure. This may be because groups over 18 in Türkiye view prosocial behaviors as a single dimension and tend to do so when answering the questions. Adults in Türkiye may not culturally perceive the differences between the dimensions of prosocial behavior, such as helping, sharing, and empathy.
The factor loading value of the scale items is expected to be .45 or higher, but this value can be reduced to .30 for fewer items (Büyüköztürk, 2014). However, Tabachnick and Fidell (2007) suggest that factor loadings should be at least .32. It is seen that the item factor loadings of the scale calculated with the data collected from the first study group vary between .578 to .808., and the item factor loadings calculated with the data collected from the second study group vary between .638 and .817 and are at an acceptable level. The factor loading for an item measures how much the item contributes to the factor; therefore, high factor loading scores indicate that the dimensions of the factors are better explained by the items (Yong & Pearce, 2013). Moreover, it can be said that the items on the scale are sufficient to explain prosocial behaviors in peer relationships.
We also examined the fit to the theoretically informed CFA as evidence of psychometric quality. Using the χ2 /df ratio instead of χ2 when examining fit indices in CFA analysis is recommended. A value less than three indicates a good fit and a value between three and five indicates an acceptable fit (Schermelleh-Engel et al., 2003). It is seen that the χ2/df value of PBPRS is 3.05, which is an acceptable fit. At the same time, CFI and TLI values higher than .90 indicate good fit, SRMR values lower than .06 indicate excellent fit, and RMSEA values lower than .05 indicate excellent fit (Hu & Bentler, 1999). The scale’s values are RMSEA = .064, SRMR = .034, CFI= .924, and TLI = .918 and have good to excellent fits. Therefore, it is seen that the fit values of the unidimensional model proposed for the measurement of prosocial behaviors in peer relationships are compatible with the coefficients suggested in the literature.
A reliability coefficient of .70 or higher calculated for a psychological test is considered sufficient for the reliability of test scores (Nunnally & Bernstein, 1994). The composite reliability, Cronbach’s Alpha, and McDonald’s Omega coefficients of the scale were found to be .957, .920, and .921, respectively. The reliability coefficients of the scale are at a sufficient level. When the literature is examined, it is seen that there are discussions that Cronbach Alpha calculation may be misleading in scales prepared for the measurement of psychological variables (Dunn et al., 2014; McNeish, 2018). However, it is predicted that the calculation of Cronbach Alpha is still very common in counseling and that using more appropriate reliability coefficients, such as McDonald’s Omega, will not be widespread in the near future (Kalkbrenner, 2023). Therefore, in this study, other reliability coefficients were calculated along with Cronbach Alpha, and the reliability of the scale’s measurements was demonstrated. Finally, within the scope of similar scale validity, it was observed that there was a positive and statistically significant high correlation (r = .75; p < .01) (Mukaka, 2012) between PBPRS and the Adult Prosocialness Scale. The high correlation between the scales can be interpreted as evidence that global prosocial behavior can be extended to context-specific prosocial behavior.
Ensuring structural invariance is crucial when modifying scales to assess psychological dimensions in order to maintain the validity of the scale (Byrne et al., 1989). Since measurement invariance was assured it can be interpreted that the PBPRS has similar factor numbers, factor loadings, and item constants among different gender subgroups. The points earned in the male and female groups may be compared because the PBPRS yielded comparable answers to the items in these groups. In this case, comparison studies can be conducted using the variations in PBPRS points earned by university students based on gender.
Limitations and Implications for Future Studies
In the study, data were collected through online methods. The online data collection method was used to support a fast data collection process, ensure that data collection from various universities in seven different regions of Türkiye was economical, and increase the applicability of the research. However, it is thought that the fact that the data were collected online may cause limitations in some cases in the development of the PBPRS. It is difficult to check whether those who filled out the online form are suitable for reaching the sample characteristics. For this reason, care was taken to announce the study link among university students. The fact that most of the students who participated in the study were female (81%) can be considered another limitation of the study, however it still demonstrates how university students engage and how they are spread out by demographics. In the literature it was suggested that compared to men, women are more likely to take part in voluntary surveys and other forms of social science research (e.g. Andreeva et al., 2015; Cheung et al., 2017; Nuzzo, 2021). Using strategies to encourage male participation and trying to reach male-dominated majors in particular may increase the sample diversity in future studies with university students. Moreover, in future studies, the reproducibility of the study can be increased through methods such as collecting the data face-to-face, increasing the number of samples, and obtaining an equal number of data according to gender. The psychometric properties of the scale developed in the study have been presented with various validity and reliability evidence. However, additional reliability evidence can be presented with test-retest reliability.
Conclusion
In conclusion, the PBPRS, developed within the scope of this study and whose validity and reliability evidence was provided, is a one-dimensional and 19-item scale that can be used to measure prosocial behaviors among peer relationships of university students. The scale consists of a five-point Likert type, and the scale items are coded as ‘Never (1) to Always (5). An increase in the scores obtained from the scale means that the frequency of students' use of prosocial behaviors in peer relationships also increases. According to the findings, the scores obtained from the PBPRS are valid, reliable, and culturally appropriate. This scale has qualities that can help researchers in the data collection process and help college counselors understand their client’s needs regarding prosocial behaviors and peer relations.
Supplemental Material
Supplemental Material - Developing Prosocial Behavior in Peer Relationships Scale Among College Students
Supplemental Material for Developing Prosocial Behavior in Peer Relationships Scale Among College Students by Selen Demirtaş-Zorbaz, Çiğdem Akın Arıkan, Asiye Şengül Avşar, M. Enes Keskinkılıç, Hatice Şabanoğlu, İbrahim Gümüşboğa, Mert Ongun, and Esra Telli in Psychological Reports.
Footnotes
Declaration of conflicting interests
The author(s) declared no potential conflicts of interest with respect to the research, authorship, and/or publication of this article.
Funding
The author(s) disclosed receipt of the following financial support for the research, authorship, and/or publication of this article: This study was supported by Scientific and Technological Research Council of Türkiye (TUBITAK) under the Grant Number 221K503. The authors thank to TUBITAK for their supports.
ORCID iDs
Data Availability Statement
The data that support the findings of this study are available from TÜBİTAK but restrictions apply to the availability of these data, which were used under license for the current study, and so are not publicly available. Data are however available from the authors upon reasonable request and with permission of TÜBİTAK.
Supplemental Material
Supplemental material for this article is available online.
Appendix
Author Biographies
References
Supplementary Material
Please find the following supplemental material available below.
For Open Access articles published under a Creative Commons License, all supplemental material carries the same license as the article it is associated with.
For non-Open Access articles published, all supplemental material carries a non-exclusive license, and permission requests for re-use of supplemental material or any part of supplemental material shall be sent directly to the copyright owner as specified in the copyright notice associated with the article.