
Abstract
While components produced by melt metallurgy have long been subject to established rule sets for proof of strength, a comparable guideline has now been developed for press-and-sinter powder metallurgical components, taking into account their characteristic residual porosity. This paper presents a method that enables the generation of a synthetic S–N curve using hardness, density, and local stress parameters as input parameters. The development of this method required a comprehensive literature review, gathering data on fatigue strength parameters in relation to density, hardness, as well as specimen geometry and load information. The compiled data was utilized to deduce relationships and formulate an algorithm capable of estimating fatigue strength associated with a 50% failure probability. Moreover, the method can supply information regarding the S–N curve’s trajectory within the finite life region. Coupled with results on statistical scatter derived from the literature, comprehensive synthetic S–N curves for sintered steels can be constructed.
Introduction
Although the Forschungskuratorium Maschinenbau (FKM) guideline “Analytical Strength Assessment” 1 provides a well-established methodology for components made by melt metallurgy, a comparable approach for sintered steels has only recently been introduced. The new guideline “Analytical Strength Assessment of Components Made of Sintered Steels” 2 now enables a computational proof of strength for press-and-sinter components, despite their residual porosity. This paper aims to present and detail the computational procedure proposed in the guideline for assessing the fatigue strength of components made from sintered steels. It should be noted that some of the values and estimations used in the strength assessment may differ from determined properties in this paper, as they are conservatively adjusted to ensure safe component design.
The concept for the computational proof of strength under cyclic loading of porous sintered steel components must incorporate the following influencing factors:
density, size, geometry, and type of load on the specimen or component, static mean stresses, alloy effects, and heat treatments.
The variable density of sintered steels, in particular, presents a unique characteristic that distinguishes sintered steels from the materials made by melt metallurgy featured in common guidelines. Recent works3–6 have presented new approaches for selected steels, which are taken up and extended here to be generally used for a wide range of sintered steels.
A crucial component of the strength proof involves determining a synthetic or a design S–N curve, considering the factors mentioned above. Therefore, this paper aims to describe how a database of mechanical properties of sintered steels was constructed based on a literature survey, which was then used to develop approaches for determining synthetic S–N curves for sintered steels.
Materials and methods
The following will detail the approach for determining the relationships necessary for the creation of a synthetic S–N curve. First, the process of collecting and processing empirical data is described. Subsequently, the individual influencing variables mentioned earlier are considered to determine the fatigue limit for a probability of failure of
Structure of the database
The selection of materials, for which fatigue strength was to be extracted from the literature, was guided by the availability of data and the relevance of the material in the present market. For instance, there are many details on the fatigue strength of Fe–Cu–Ni steels without carbon from older works. This group of materials is hardly used today and was therefore omitted here. Conversely, there are steels demanded by the market for certain applications, but for which the data situation is so sparse that no correlations could be made visible. In such cases, inclusion was omitted. From these considerations, 11 material groups emerged:
Fe Fe–C Fe–Cu Fe–Cu–C Fe–1.75% Ni–1.5% Cu–0.5% Mo (–C) Fe–4% Ni–1.5% Cu–0.5% Mo (–C) 0.85% Mo (pre-alloyed)–AE–C; AE: Cu, Ni a. o. 1.5% Mo (pre-alloyed)–2% Cu (–C) 1.5% Mo (pre-alloyed)–4% Ni–2% Cu (–C) (1.5–1.8)% Cr (pre-alloyed) (–0.2% Mo (pre-alloyed))–C 3% Cr (pre-alloyed)–0.5% Mo (pre-alloyed)–C
The compiled data comes from a variety of publications (dissertations, conference contributions, final reports, publications in technical journals, or internal investigations by institutes), some of which were published several decades ago.3–168
The individual extracted data sets contain among others:
The fatigue endurance limit The alloy composition The density of the specimens Information on heat treatment Information on hardness The specimen shape and type of load used to determine fatigue strength
Whenever possible, the raw data from individual S–N tests (nominal stress
As in the FKM guideline
1
and DIN EN ISO 50100
169
the description of the S–N curve is based on the Basquin equation,

The raw data was evaluated using the method of weighted horizons and linear regression, as it is extremely flexible and includes many other evaluation methods as well as some other rarely used procedures. Another advantage is that the evaluation method in the experimental test does not require strict adherence to an order and does not demand a constant linear or logarithmic step change.
If the raw data was not available in the source, the value for
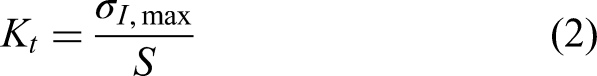
To obtain characteristic values for local stress parameter depending on specimen size, geometry, and load type, the shape factor
The type of load was differentiated between:
axial load 90°-bending 0°-bending rotational bending three-point bending torsion
Figure 1 shows an example of a test specimen frequently used in literature with a notch radius of
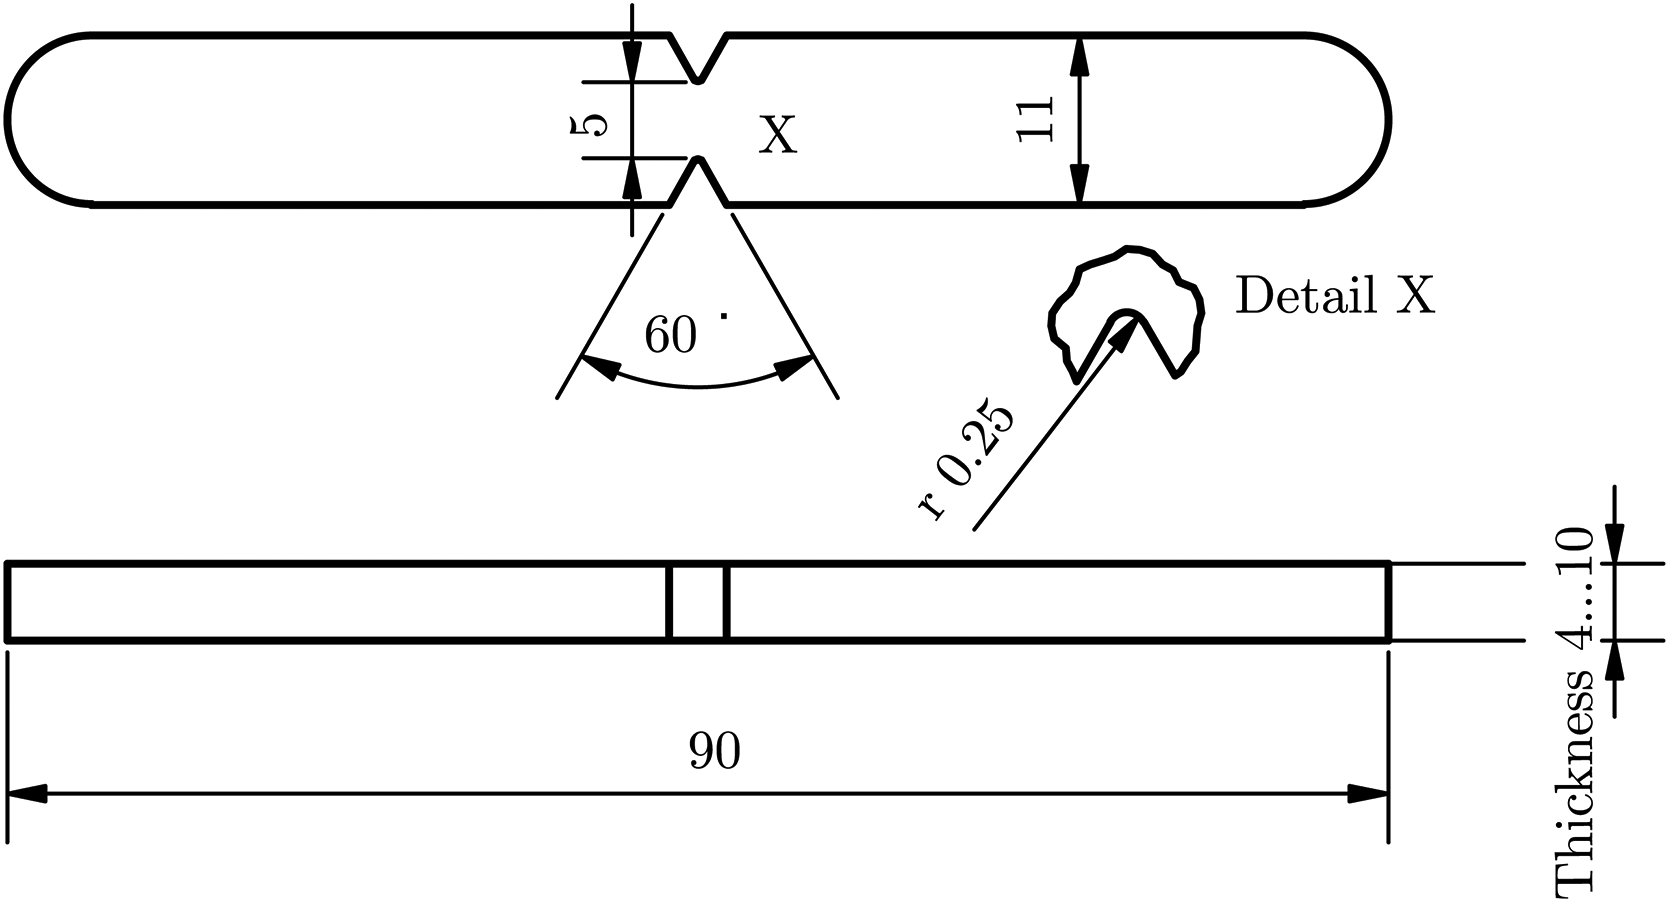
Example of a specimen geometry from the database with notch radius
Example for FEA results for specimen geometry shown in Figure 1.
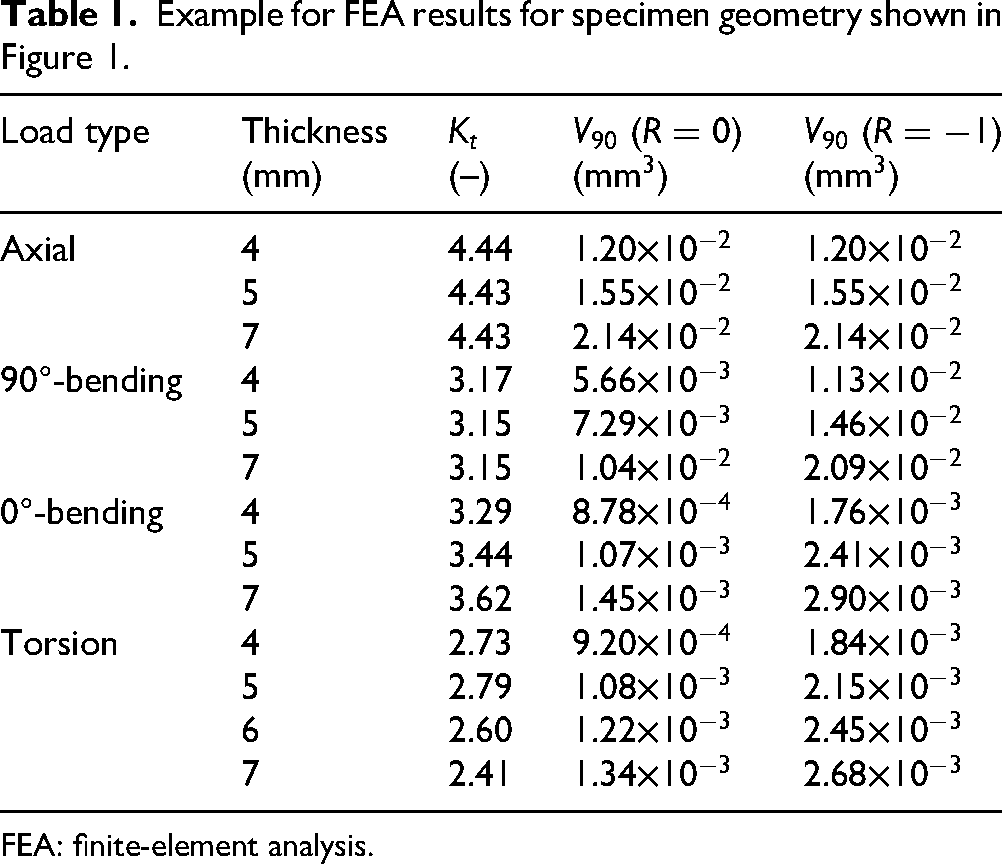
FEA: finite-element analysis.
Evaluation
Density and hardness
With conventional pore-free steels, there is a statistically well-documented proportionality between axial fatigue strengths or bending fatigue strengths and tensile strengths up to 1200 MPa.170–172 Therefore, the easily measurable tensile strength of this group of materials is well suited to estimate bending or axial fatigue strengths, as is applied in the FKM guideline
1
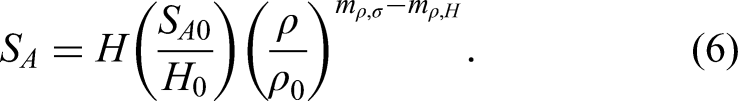
for the material groups represented there. This option is only possible with limitations for porous sintered steels: up to carbon contents of about 0.5–0.6%, bending and tensile fully reversed fatigue strengths also increase proportionally with tensile strength. However, with higher carbon contents, tensile strength decreases while hardness and fatigue strengths continue to increase.26,173–177 Therefore, it is more purposeful for sintered steels to use hardness in connection with density to estimate fatigue strength. To derive a correlation, all data sets were used in which the hardness and density are specified and whose highly stressed volume is approximately
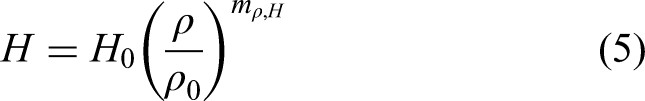
The Balshin equation can be used as an approach to describe the fatigue strength in relation to hardness. With it, density dependencies can be quantitatively described.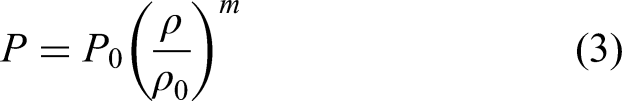
So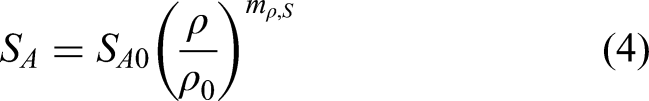
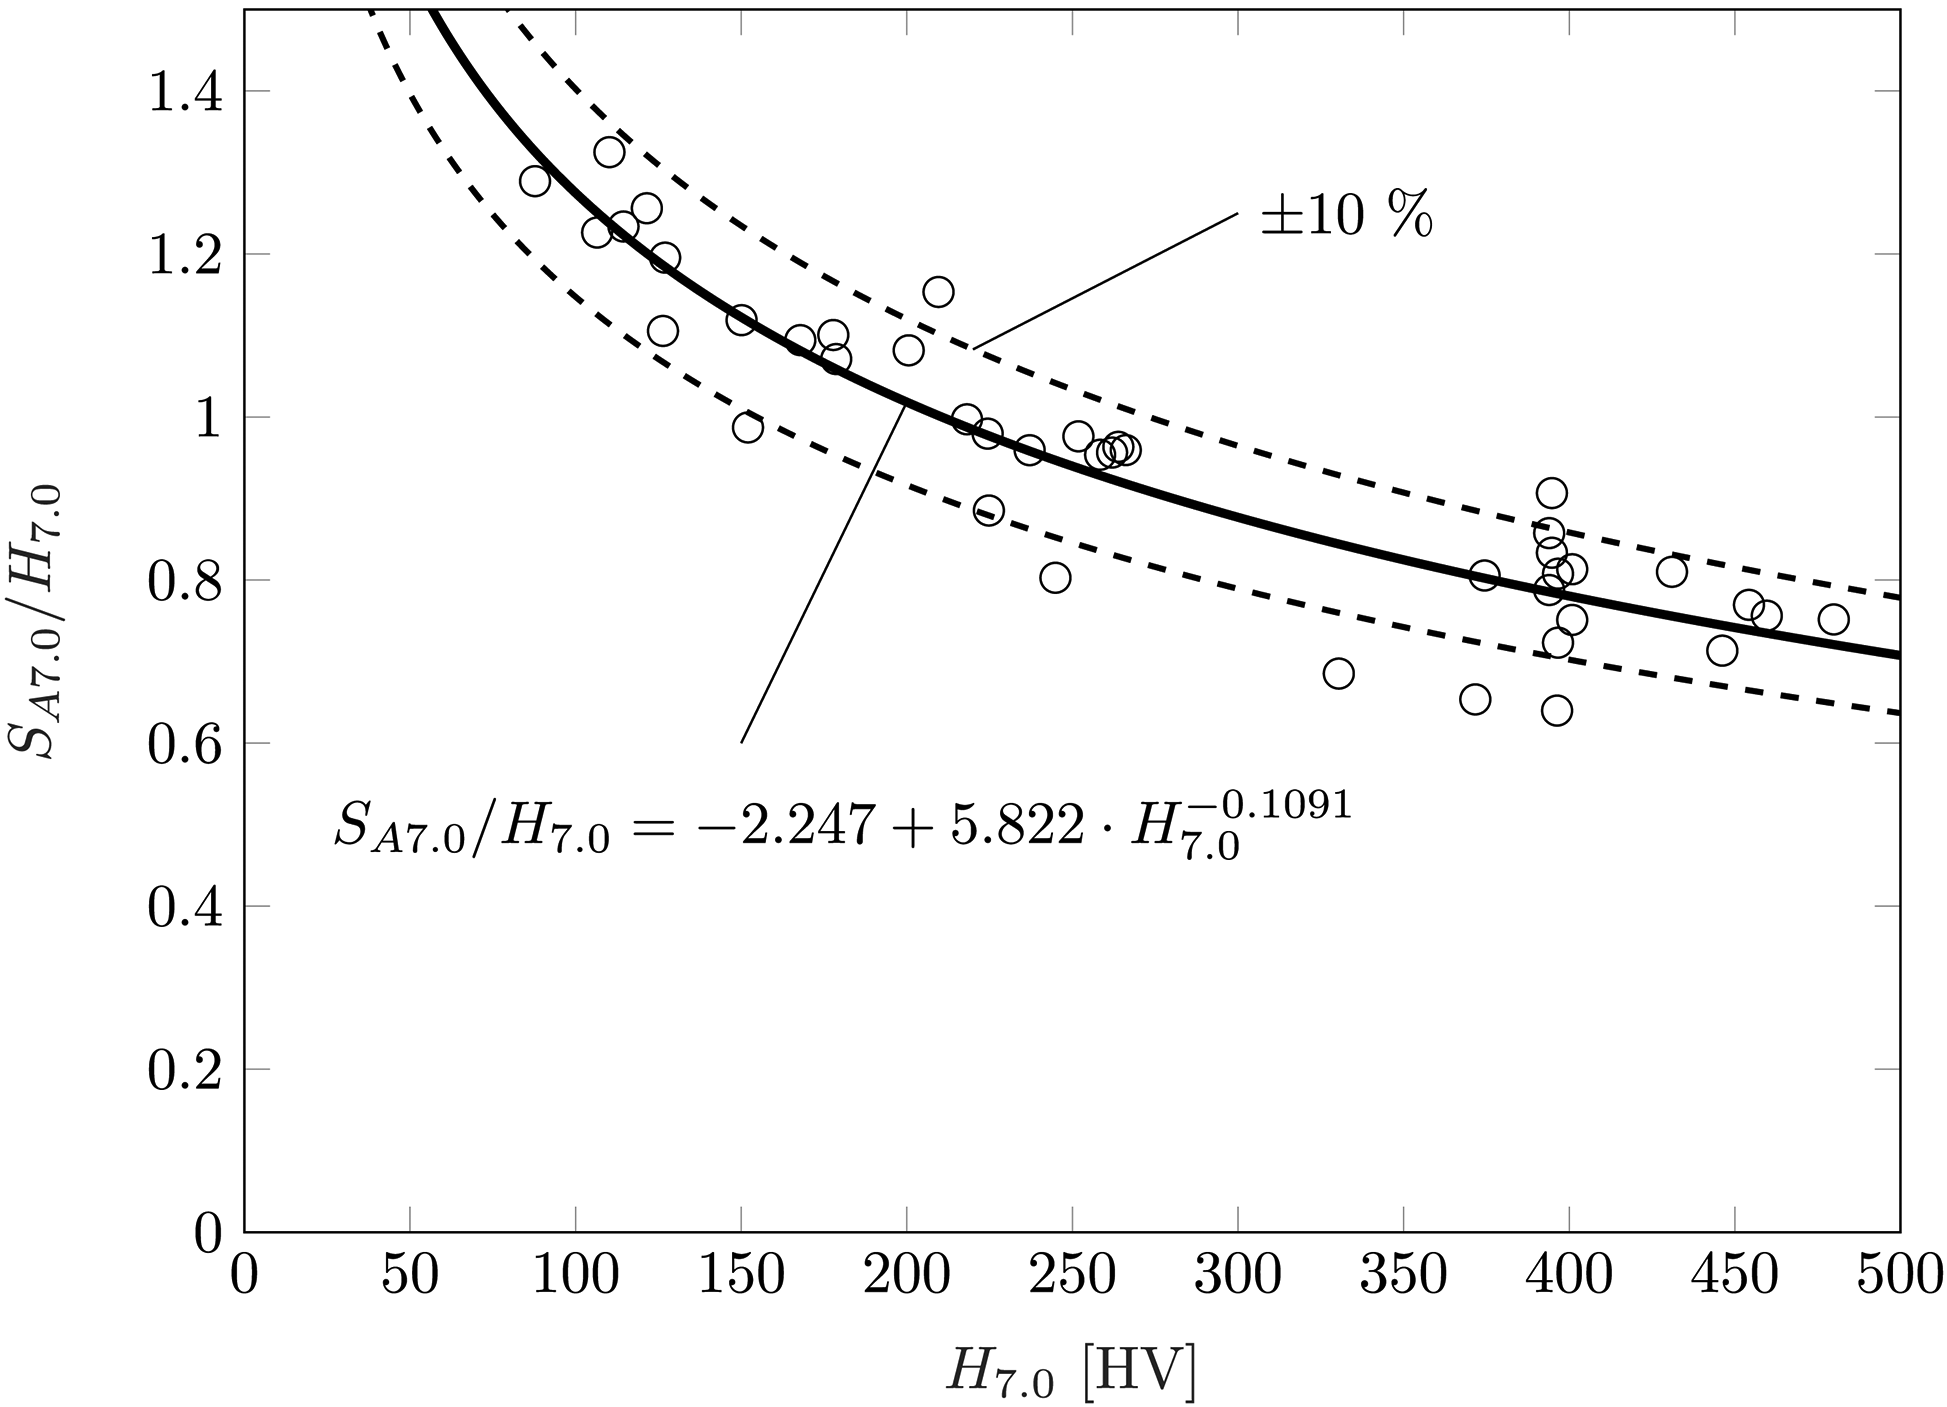
The data can be well described with a second-degree polynomial:
Estimation of the fatigue strength for arbitrary specimen geometries and load cases
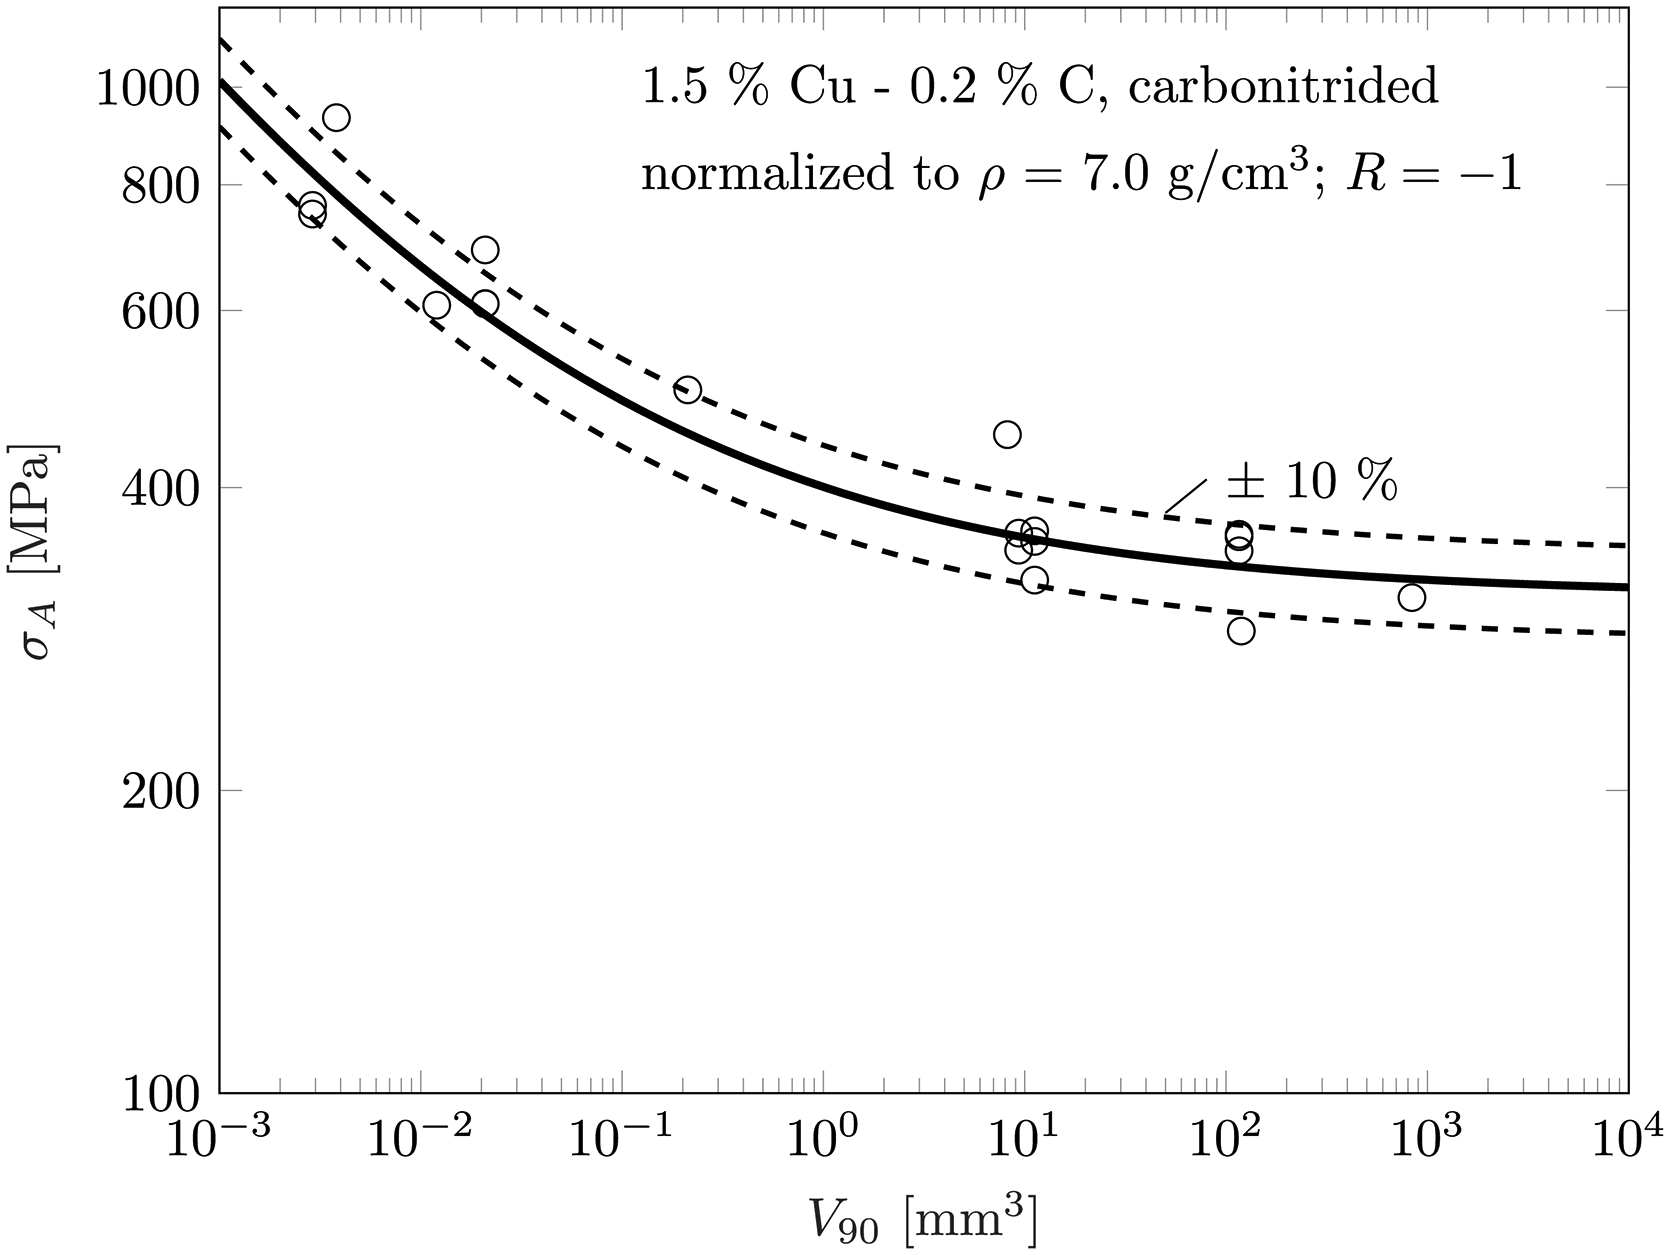
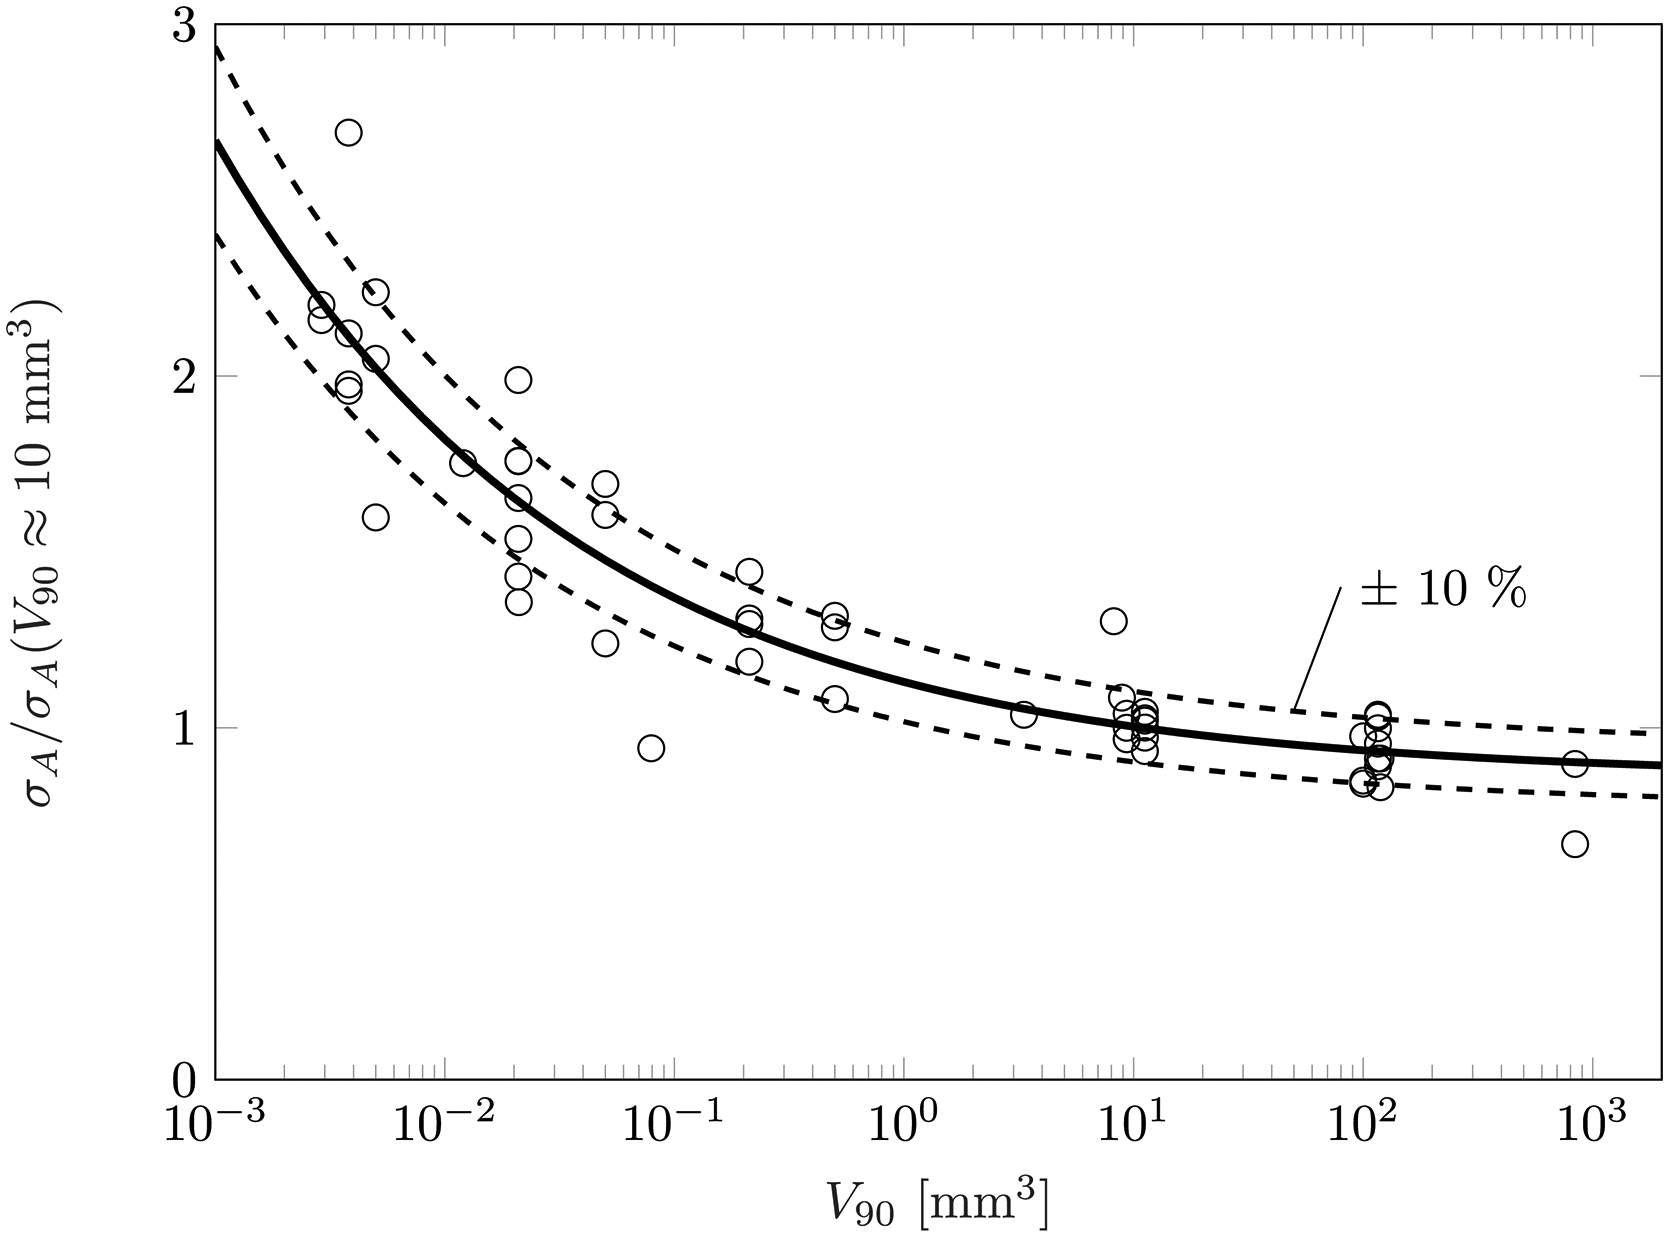
The size and notch effect for sintered steels can be well described with the concept of highly stressed volume, as demonstrated in the literature.4,5,133,152 The relationship between the tolerable stress amplitude and the highly stressed volume can be described using a Weibull approach.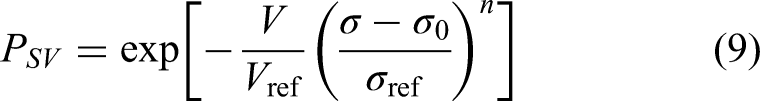
As an example, Figure 3 shows the fatigue limit as local stress amplitude 
Influence of mean stress: Haigh diagram
As shown by our own investigations in Beiss et al.,
167
the Haigh diagram for sintered steels can only be established on the basis of 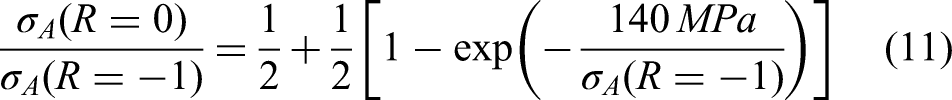
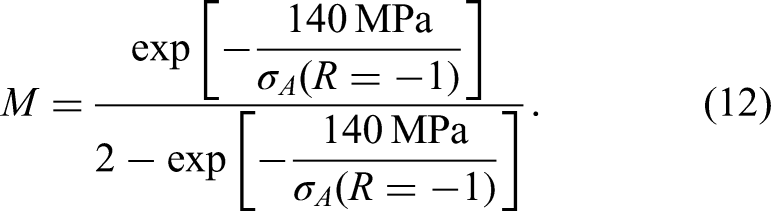
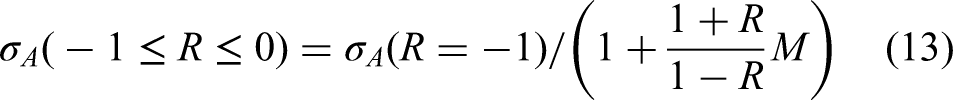
in the interval 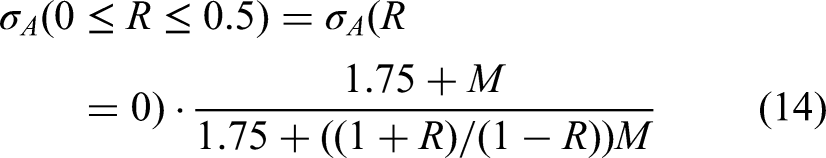
was proposed. For 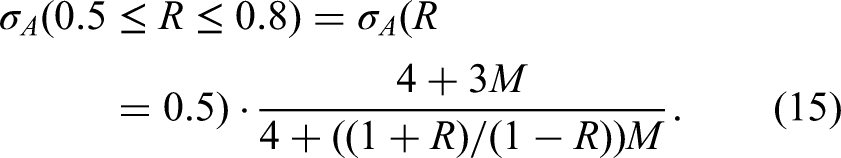
Finite life regime
As slope At least 10 fractured specimens with
No torsion testing Values of Steam treated and carbonitrided specimens are excluded Hardness is given in Vickers scale
After filter criteria were established 410 S–N curves remain with a total number of 12,966 specimens tested in finite life regime. The number of specimens used for determining the behavior in finite life regime in each S–N curve varies between 10 and 82, whereas the mean value is 27 specimens. The mean value for the slope can be calculated as
Results and discussion
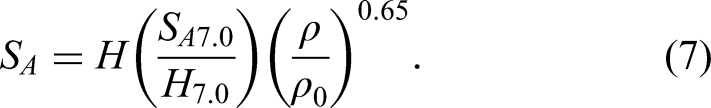
The functional relationships described above can be used serially to estimate the locally tolerable stress amplitude of arbitrarily shaped and loaded components for a probability of failure of 50%. First, the reference fatigue strength for an unnotched specimen with
Figure 5 presents the calculated values compared to the experimental values from the database. The data scatters a lot but most values lie within the
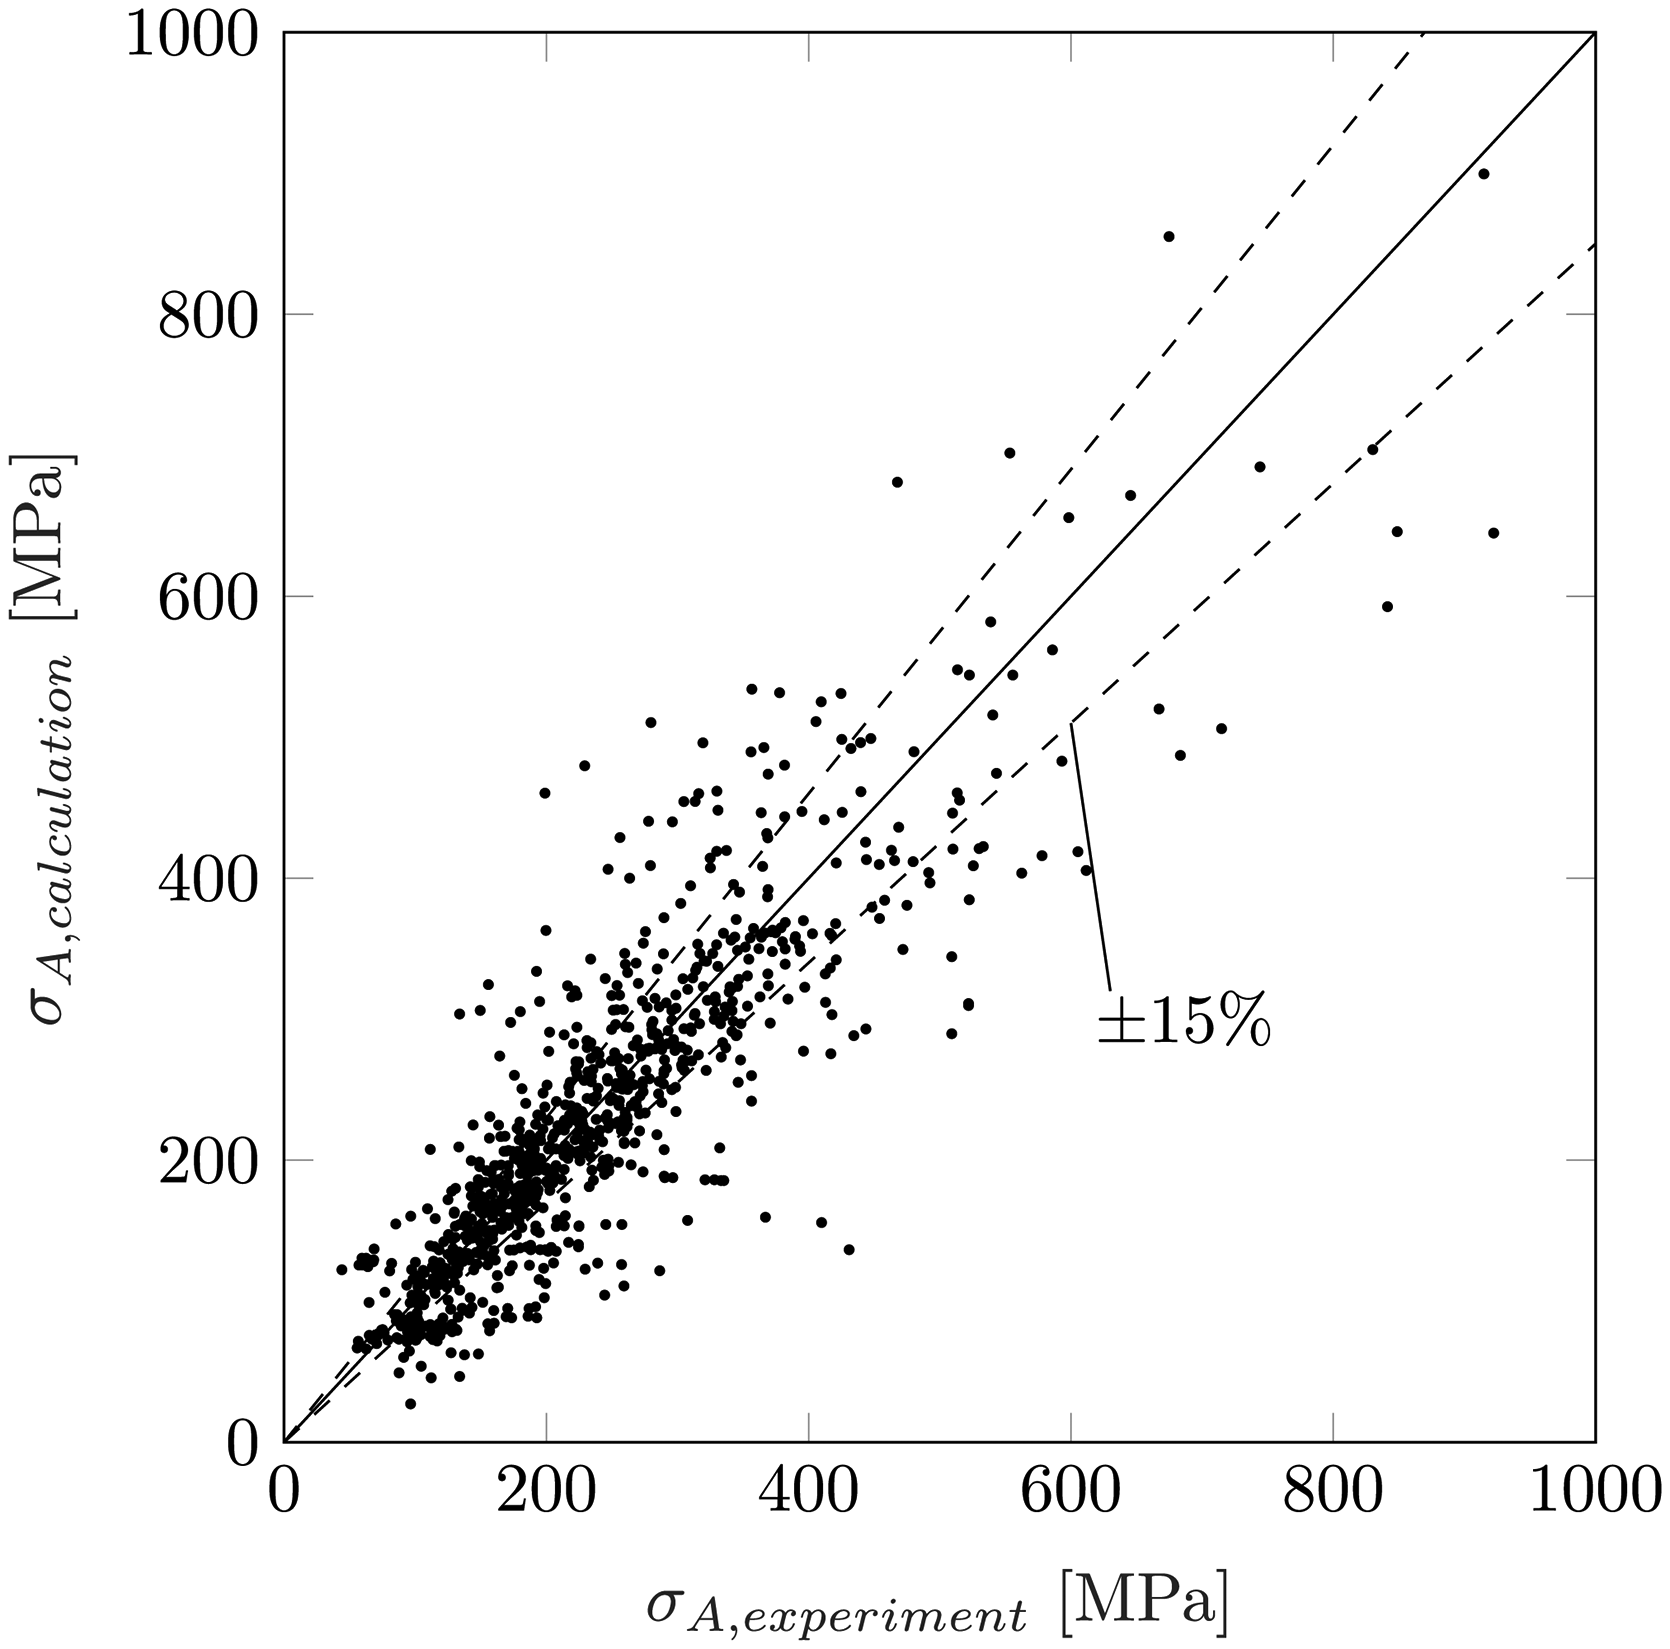
Comparison of calculated values with experimental data.
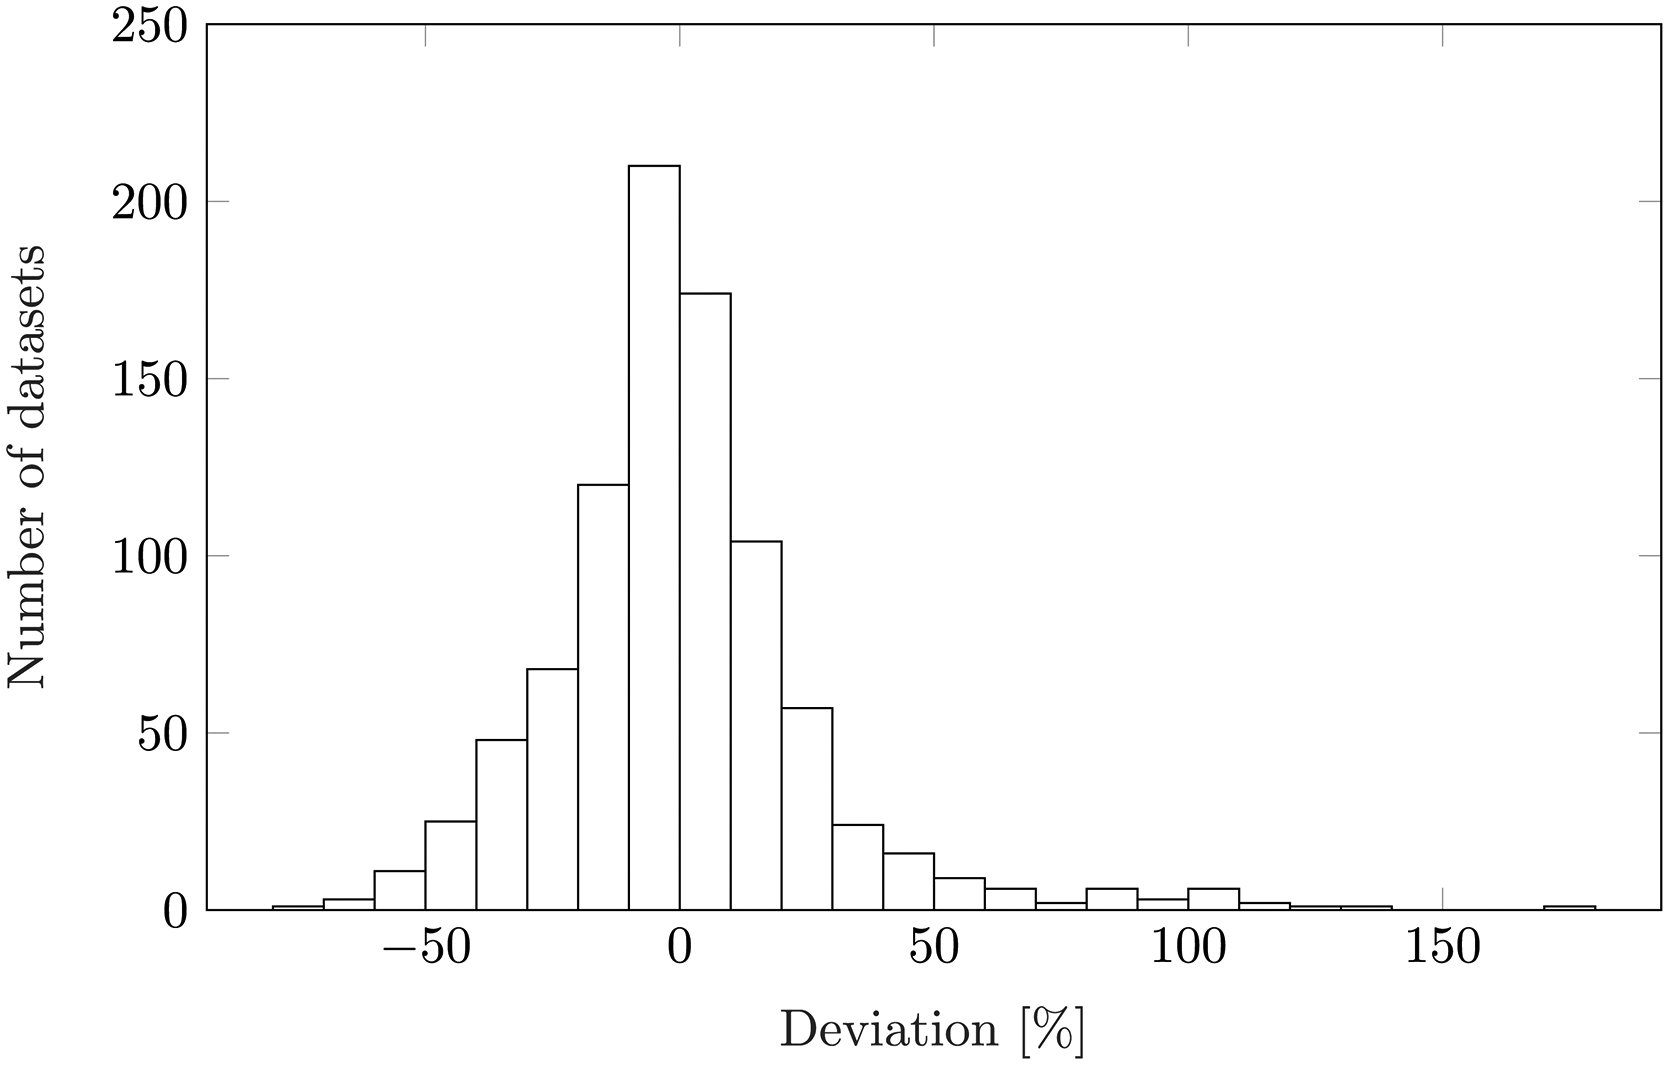
Histogram of the percentage deviations between the calculated and experimentally determined fatigue strengths.
In our own investigations in Burkamp et al.
181
it was shown in a larger statistical evaluation that for failure probability deviating from
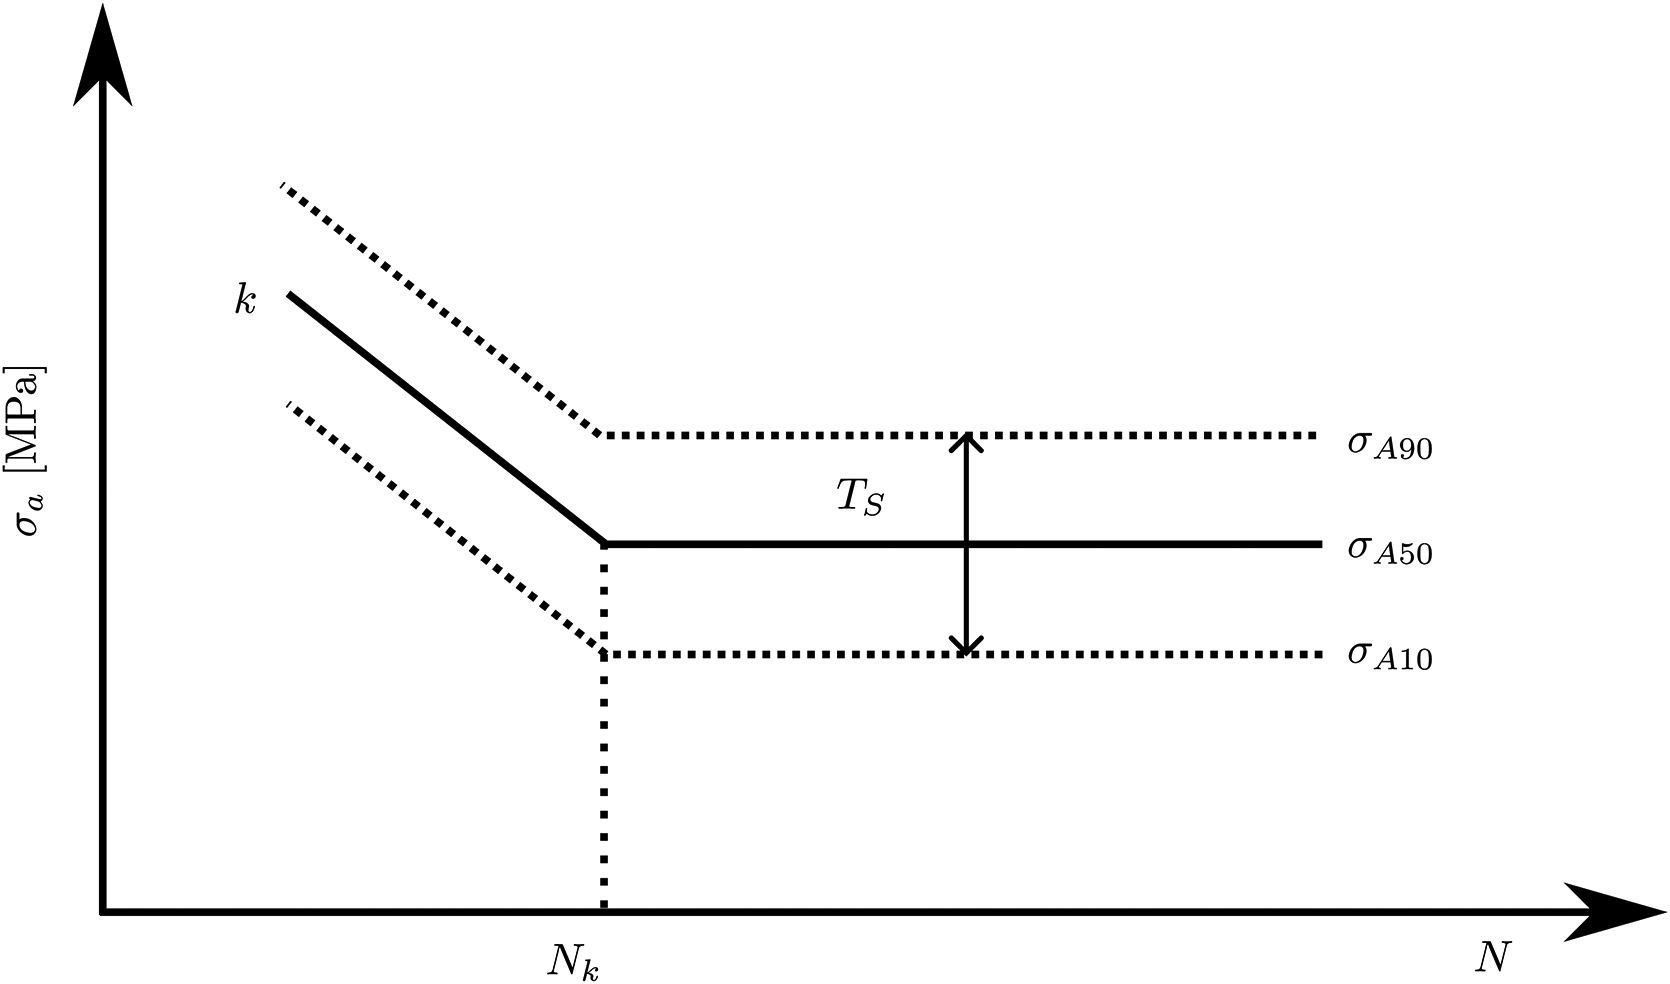
Schematic representation of the synthetic S–N curve with characteristic values.
Conclusions
In this study, with inclusion of results from Burkamp et al. 181 and Beiss et al., 167 a novel algorithm is presented, which enables the construction of synthetic S–N curves for components made of sintered steels with arbitrary shapes and loading conditions, given the knowledge of density and hardness at the proof point. The algorithm allows the density and hardness to be measured for unknown alloys and an alternating strength to be estimated from these, which can then be transferred to a component under a specific load. Alternatively, the fatigue limit under fully reversed loading can be determined experimentally on an unnotched specimen to start the calculation with a experimentally validated fatigue limit for a fully reversed load case.
Footnotes
Acknowledgments
Most of this work was financially supported by the Federal Ministry of Economics and Energy of Germany under AIF-No. 20234 N/1 via Forschungskuratorium Maschinenbau (FKM). The final report for the project can be found in Burkamp et al. 180 All this support is gratefully acknowledged.
Funding
The authors received no financial support for the research, authorship, and/or publication of this article.
Declaration of conflicting interests
The authors declared no potential conflicts of interest with respect to the research, authorship, and/or publication of this article.