
Abstract
This study provides key insights into the critical role of nanoparticle distribution in oxide dispersion-strengthened (ODS) powders for laser powder bed fusion (PBF-LB/M). A comparative analysis of mechanical (ball milling, BM) and liquid-based (dielectrophoretic deposition, DD) additivation methods was conducted to produce ODS feedstocks by integrating 1 vol.-% yttria (Y2O3) nanoparticles into Fe20Cr metal powder. ODS materials enhance high-temperature strength and creep resistance by dispersing fine, stable oxide particles within a metal matrix. This makes the precise size and distribution of nanoparticles crucial in the final bulk material. Powder characterisation shows that while both methods produce powders suitable for high-density parts, the DD method achieves higher uniform nanoparticle distribution, with smaller average particle sizes (74 nm) and interparticle distances (826 nm). In contrast, longer milling durations resulted in slightly larger particle sizes (77 nm) and distances (790 nm), while shorter milling times produced even larger nanoparticles (108 nm) with greater interparticle distances (1114 nm). These results suggest that DD offers advantages in optimising the distribution of oxide nanoparticles to enhance the strengthening effects in high-temperature applications.
Keywords
Introduction
Additive manufacturing (AM) has emerged as a transformative technology with significant implications for modern industries. Particularly in producing complex geometries, the versatility of AM has positioned it as a crucial player in advancing manufacturing processes. Among the materials explored for AM, oxide dispersion strengthened (ODS) steels stand out due to their unique properties, such as high-temperature resistance and mechanical strength, making them particularly relevant for high-temperature applications such as fusion power plants. 1
ODS steels are engineered to withstand extreme thermal and mechanical conditions, preventing creep deformation in challenging environments. 2 Due to the strong interaction between dislocations and nanoscale oxide particles, they exhibit significantly enhanced creep resistance compared to dispersion-free ferritic steels. This dislocation interaction stabilises the microstructure during creep and forms dislocation loops around the oxide nanoparticles (ONP), impeding dislocation movement and delaying high-temperature deformation. 3 Well-known ODS steels, including EUROFER, 4 MA956 5 and PM2000, show 20% increase in compression strength at 600°C for ODS fabricated via AM compared to raw steel matrix. 6 The conventional manufacturing of ODS steels involves intricate and expensive processes with several process steps, such as sintering with subsequent high isostatic pressing (HIP), to ensure the homogeneous distribution of ONPs within the metallic matrix. This homogeneous distribution is crucial for the Orowan mechanism to function effectively at high temperatures. 7 Both ONP size and distance are essential criteria for achieving the desired properties. 4 This makes homogeneous ODS powder material a critical precondition, as this initially defines the best possible outcome.
While AM offers the advantage of producing complex geometries, the limited availability of powder variants, particularly for high-demand applications, poses a significant challenge. Specifically, the demand for and research on ODS materials continuously increases 8 as AM represents a comparatively uncomplicated process family for producing this type of material. Thus, the successful integration of AM in processing ODS steels has already been demonstrated multiple times,8–10 but choosing suitable powder production processes remains a critical factor. For high-quality ODS powders, ONP must be combined with micron-size metal particles so that the metallic particles are homogeneously covered with ONP, while agglomeration or the loss of ONP is to be avoided. This is even more important as the involvement of a liquid phase and melt pool currents increases the risk of ONP assemblages occurring.11–13 Mechanically alloying is the most widely employed method due to its ease of use. However, mechanically alloyed powder is often deformed due to the high applied forces during milling. 14 Deviations from the spherical shape may hinder flowability, 15 which is crucial for a homogeneous powder spread during layer-wise manufacturing. Thus, the quality of the resulting parts can be seriously affected. 16 Gentler methods, for example, mixing in a tumble mixer, pose the risk of insufficient bonding of ONP and metal particles and, thus, inhomogeneous distribution of ONP in the final part. 17 More elaborate methods, such as liquid-based, seem counterintuitive at first glance, as incorporating liquids in preferably dry powders to minimise gas porosity is not the most apparent solution. However, recent studies have shown that this process is suitable for producing ODS powders for high-density parts. 18
Most studies in the field of ODS powders focus on a single powder production method or limited powder characteristics, such as particle size or chemical composition.16,19–21 This has resulted in a lack of comprehensive comparative studies that quantitatively evaluate how different ODS powder production processes influence the properties of the final powder. Furthermore, the use of various matrices (PM2000, 22 MA956, 5 14YWT, 10 and aluminum alloys)23,24 complicates direct comparisons. To address this gap, the present study conducts an in-depth investigation of two distinct powder additivation methods—ball milling (BM) with varying durations and dielectrophoretic deposition (DD)—for producing ODS powders specifically tailored for AM via laser powder bed fusion (PBF-LB/M). The focus is on incorporating 1 vol.-% (∼0.6 wt.-%) yttria (Y₂O₃) nanoparticles into Fe20Cr metallic powder. By evaluating powder characteristics in detail, the study aims to assess the effectiveness of each additivation method in achieving uniform dispersion of oxide nanoparticles within the metallic matrix, which is critical for successful processing in PBF-LB/M. The microstructural analysis conducted here will be crucial for understanding the impact of these powder preparation methods on the subsequent consolidation behaviour during PBF-LB/M processing.
Materials and Methods
Micrometer-sized metal powder with the nominal composition Fe20Cr (wt.-%) was used as the base material for producing oxide-additivated metal powder. The initial particle size distribution (PSD), as provided by the manufacturer (Rosswag GmbH, Pfinztal, Germany), ranged from 15 to 45 μm (d10 = 20.16 μm, d50 = 34.92 μm, d90 = 62.50 μm). The chemical composition of the Fe20Cr powder was verified by X-ray fluorescence (XRF), confirming a composition of 79.6Fe-20.4Cr (wt.-%, 78.43Fe-21.57Cr at.-%). Ceramic Y2O3 ONPs with an average particle diameter of 32 to 36 nm and a purity of 99.9% from Goodfellow Cambridge Ltd were used for additivation. As a PBF-LB/M platform substrate material, AISI 316L was used.
Processing
Low-energy BM was performed using a centrifugal mill (Retsch S1). For producing ODS powder, an empty yttrium-stabilized zirconium oxide (YSZ) container (500 ml) was initially loaded with 300 g of YSZ milling balls (10 mm in diameter). Fe20Cr metal powder (300 g) was then added, followed by the ONPs, which were spread over the metal powder and manually pre-mixed with a spatula to ensure initial distribution. This mixture was then transferred into the centrifugal mill for further mechanical mixing. Longer grinding times can lead to a finer distribution of the ONPs, 25 improving the final material's homogeneity properties. However, a longer grinding time can also lead to more significant deformation and fragmentation of the powder particles, resulting in smaller particle sizes and potential flowability issues. 26 The ball-to-powder ratio (BPR), which significantly impacts the morphology and consequently the flowability of the powder compared to grinding time, 14 was therefore kept constant in this study. Two parameter sets were applied on different powder batches: two cycles of 60 minutes at 70 rpm in air (BM/120 min) and two cycles of 20 minutes at 70 rpm in argon (Ar4.6) atmosphere (BM/40 min). This variation allows the study of ONP distribution in the powder and its subsequent effect on the properties of the printed parts produced with PBF-LB/M.
For the DD process, 27 250 ml of deionised water (pH 8) was first added to a 1-litre vessel, followed by the addition of 300 g of Fe20Cr metal powder. This mixture was briefly pre-mixed manually to ensure even dispersion of the metal powder. Separately, the ONPs were dispersed in 150 ml of deionised water using an ultrasonic finger (Hielscher GmbH, UP200S) with an amplitude of 75% and a cycle of 0.75 for 2 minutes. The pre-dispersed ONP solution was then added to the vessel containing the water and metal powder, and the entire mixture was manually remixed to ensure uniform ONP distribution. This final mixture was subsequently transferred to a rotary evaporator, where it was dried at 80°C under a 320-mbar atmosphere for approximately 6 hours, with the rotation speed adjusted between 80 and 20 rpm depending on the drying progress.
The reference metal powder and additivated powders were processed using PBF-LB/M (Aconity Mini, Aconity GmbH, Herzogenrath, Germany). The different additivation methods and powder properties can cause potential variations in process behaviour. For this reason, a wide range of process parameters was selected to compensate for these variations. This approach ensures that each material, despite its unique characteristics, can be processed under conditions most likely to produce dense samples. Nine cubes (10 × 10 × 10 mm3) were built using identical parameter sets in one built job for each powder material with laser powers (Ytterbium laser, λ = 1070 nm) between 175 and 220 W, scan speeds between 700 and 915 mm/s, and hatch distances varied between 70, 80 and 90 µm. The laser spot diameter was 50 µm, and the nominal powder layer thickness was 30 µm.
Analytical methods
The Y2O3 nanoparticles were investigated with transmission electron microscopy (TEM) using a JEOL, JEM-2200FS machine. PSD of the ODS and reference powder were determined using dynamic image analysis. Scanning electron microscopy (SEM; Apreo S LoVac, Thermo Fisher Scientific) provided insights into powder morphology, while energy dispersive spectroscopy (EDS) allowed quantitative comparison of nanoparticle distribution in the ODS powder. The flow rate and apparent density of the metal and additivated powders were determined using a Hall flowmeter, following the procedures outlined in ASTM B213 and ASTM B212. Flow rate (FRH) was reported in (g/s), and apparent density (AD) in (g/cm3). The percent packing density (PD) was calculated using the theoretical density of Fe20Cr (ρFe20Cr = 7.724 g/cm³). Flowability was also analysed using a rotating drum test. The relative humidity was measured with a DBS moisture analyser (Kern & Sohn GmbH). Approximately 10 g of powder was rapidly heated to 150°C for 10 minutes, and the mass loss was expressed as a percentage. The Fe20Cr base, ODS powder and bulk samples were subjected to XRF analysis using a Bruker S8 Tiger instrument equipped with a rhodium X-ray tube and a beryllium window that operates at a power of 4 kW. For powder measurement, 5 g of the virgin and additivated powders were analysed under a helium atmosphere. The printed samples were halved, and the cross-sections representing scanning direction were prepared by grinding with 180-grit paper to obtain a flat surface before surface analysis. The bulk samples were measured under vacuum with an region of interest (ROI) of 8 mm in diameter. The Quant-Express quantitative method, designed for the Bruker system, determined each element's weight percentage (wt.%) through the corresponding Kα lines.
Microstructural analysis was conducted using light optical microscopy (LOM) on metallographically prepared cross-sections, employing a Leica DM-2700 microscope. Density measurements were performed on each sample using five LOM images taken at a magnification of 50x, with images distributed across the entire build height and width of the cross-sections to ensure comprehensive coverage. The densities of the samples were measured using ImageJ software (Version 1.54j). For SEM analysis, images of the PBF-LB/M reference and ODS samples were captured at various magnifications. The interparticle distance was calculated from 4 to 8 images taken at 5kx magnification, while particle size was measured at higher magnifications of 80kx and 120kx to enhance accuracy. Pairwise Euclidean distances between particles were computed using the numpy linear algebra norm function (np.linalg.norm). The minimum distances were averaged to obtain the mean minimum distance, indicating particle clustering. Analysis was conducted using Python with the Pandas, Numpy and Matplotlib libraries.
Results and discussion
ONP characteristics
TEM analysis was performed on the Y2O3 ONP to assess their morphology and elemental composition. Figure 1 presents TEM images of the ONP in as-received condition and a line scan of one representative Y2O3 particle.
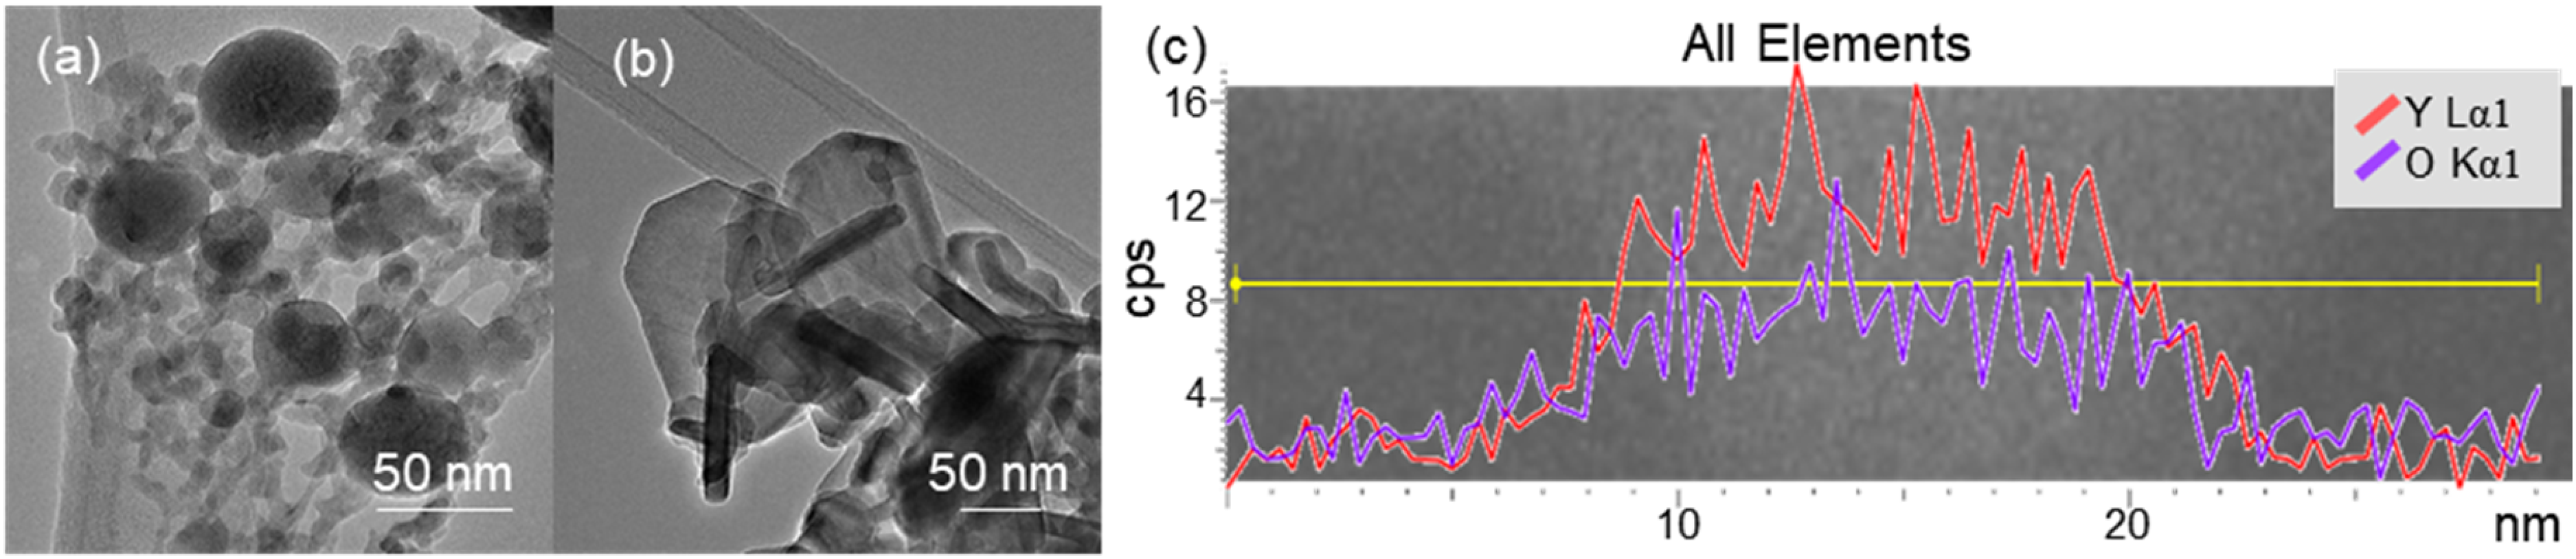
Transmission electron microscopy image showing (a) spherical Y2O3 nanoparticles and (b) plate-like Y2O3 nanoparticles. (c) Line scan of Y2O3 nanoparticle indicating the elemental distribution of yttrium (Y) and oxygen (O).
The TEM images (Figure 1(a) and (b)) reveal that the Y2O3 nanoparticles (NPs) exhibit a variety of morphologies, including spherical (Figure 1(a)), plate-like (Figure 1(b)), and irregular geometries that are plate-like but not symmetrical. The majority of the particles are angular and plate-like. Additionally, the images indicate a narrow size distribution among the nanoparticles. A spherical particle shape and uniform sizes are advantageous for consistent material properties in the final part. The line scan (Figure 1(c)) confirms a homogeneous distribution of yttrium (Y) and oxygen (O) throughout the nanoparticles, verifying their composition as Y2O3. Notably, no core-shell structures were detected. However, the observed plate-like morphology of some Y2O3 nanoparticles poses a potential concern. According to the theory of ODS materials, 28 a homogenous distribution and size of powder particles with a small interparticle distance, 29 either through high particle loading or smaller particles, support the strengthening effect more effectively in high-temperature environments. 30 Therefore, a spherical shape of the reinforced particles supports the homogenous interparticle distance and may positively affect the strengthening.28,31 The plate-like shapes might lead to anisotropic mechanical properties and less effective pinning of dislocations, which could compromise the material's performance under thermal and mechanical stress. During the melting and solidification processes in laser-based AM processes, the strengthening effect can also be altered due to the distribution of ONP and microstructure characteristics like grain size. 6 With the varying process parameters, the size of the ONP can be changed.32–34 Despite their high melting point of 2430 +/− 25°C, 35 the local energy densities of the laser radiation are high enough to exceed this temperature in the melt pool and cause partial melting, 34 resulting in rounding and even dissolving of the smallest ONP. Similar effects are observed, for example, in WC-containing coatings applied by laser cladding.36,37
Particle morphology and ONP distribution of ODS powders
Figure 2 presents the results of SEM and EDS analyses of powder particles, comparing the reference powder with powders additivated using the different routes of BM and DD.
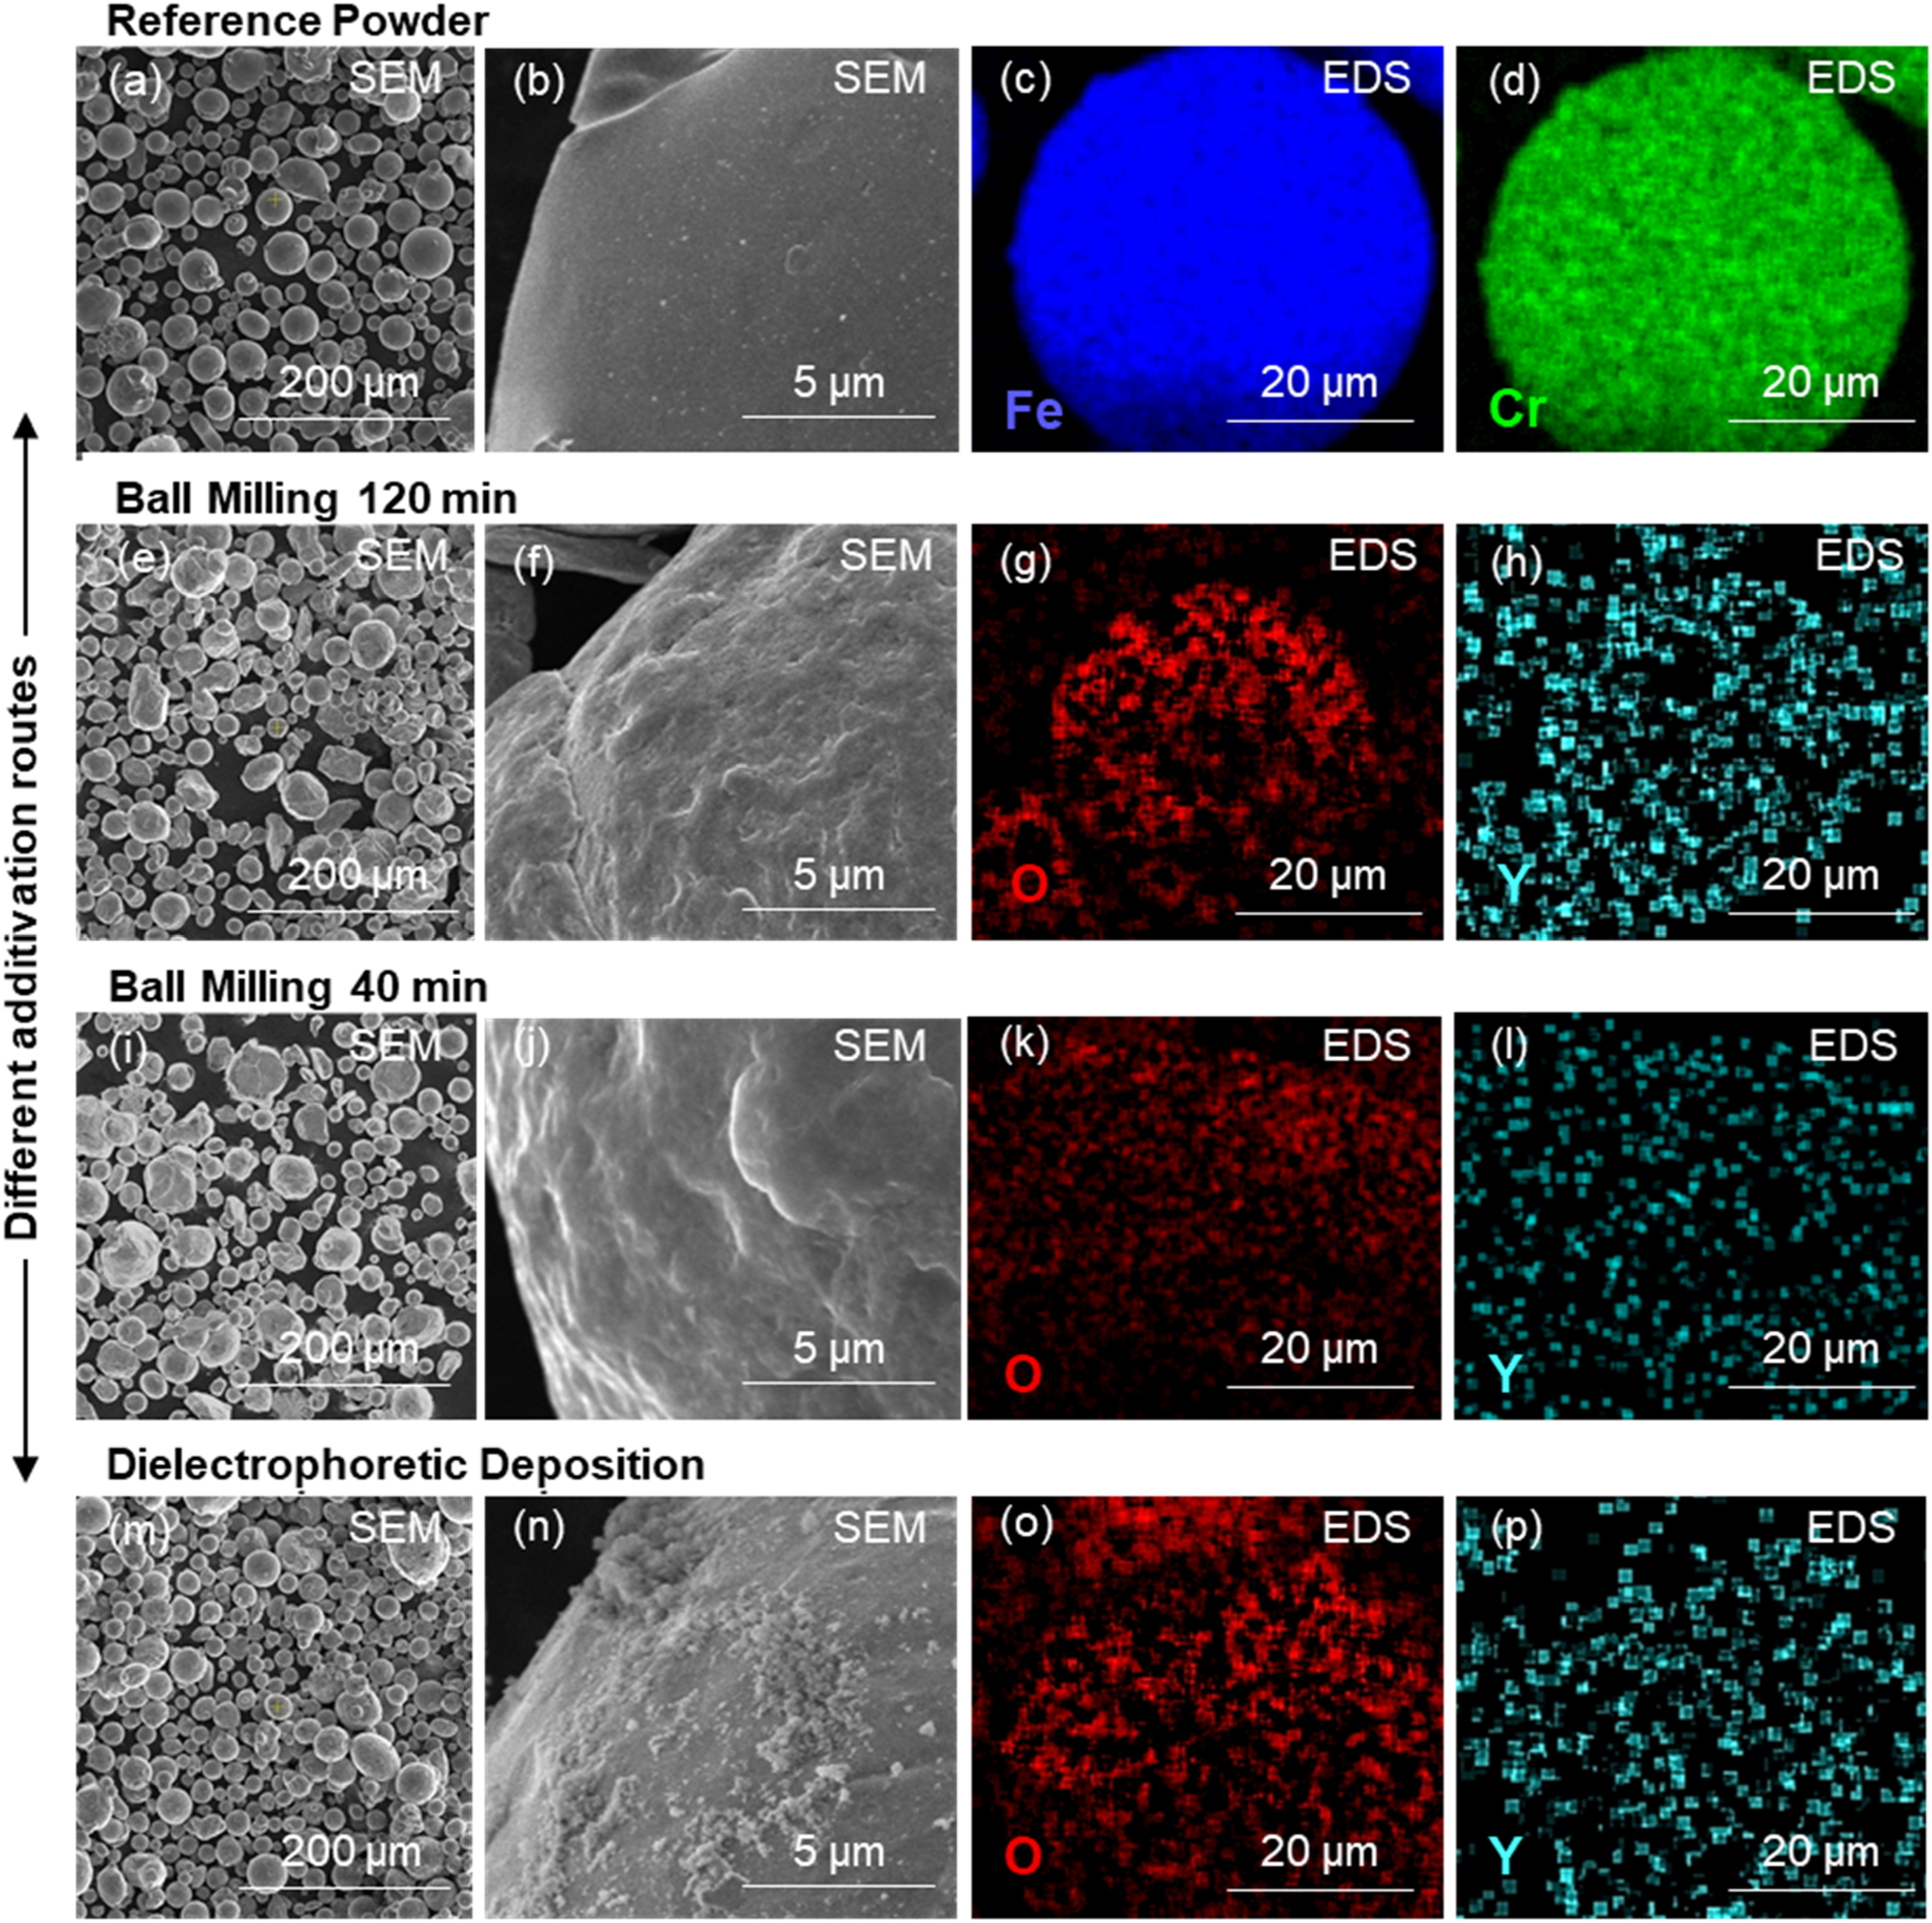
(a) and (b) SEM image of the reference powder. (c) and (d) EDS elemental maps of the reference powder showing Fe and Cr distribution. (e) and (f) SEM image of powder after BM/120 min. (g) and (h) EDS elemental maps of powder after BM/120 min showing O and Y distribution. (i) and (j) SEM image of powder after BM/40 min. (k) and (l) EDS elemental maps of powder after BM/40 min showing O and Y distribution. (m) and (n) SEM image of powder after DD. (o) and (p) EDS elemental maps of powder after DD showing O and Y distribution. BM: ball milling; DD: dielectrophoretic deposition; EDS: energy dispersive spectroscopy; SEM: scanning electron microscopy.
The SEM images reveal distinct particle morphology and size distribution differences among the powders. The reference powder (Figure 2(a)) comprises well-rounded particles typical for gas atomisation. In contrast, the powders subjected to BM (Figure 2(e) and (i)) exhibit slightly altered shapes with increased surface roughness, indicating mechanical deformation during milling. The visual comparison between BM/120 min and BM/40 min does not reveal a noticeable difference in particle morphology, indicating that the milling duration (BM/120 min vs. BM/40 min) does not significantly affect this aspect. Notably, the DD additivated powder (Figure 2(m) and (n)) shows distinguishable nanoparticles on the surface, appearing as whitish dots or flakes. The appearance of whitish areas contrasts with the BM powders, whose nanoparticles are not discernible via SEM, likely due to their embedding within the roughened surfaces.
EDS elemental maps (Figure 2(b)–(d), (g), (h), (l), (l), (o) and (p)) provide insights into the elemental distribution of Fe, Cr, O and Y. Despite different additivation methods, no significant differences in Y distribution are observed among the powders. This could be attributed to the limited sensitivity of EDS in detecting the low Y content (1 vol.-%) and the small particle size of the Y2O3. The detection limitations of EDS at low Y concentrations prevent definitive conclusions regarding the uniformity and aggregation behaviour of the nanoparticles across the different additivation routes. Further, more sensitive techniques might be required to assess the nanoparticle distribution accurately. As far as the observations show, the distribution of the Y is predominantly uniform, regardless of the additivation method.
Physical properties of ODS powders
Dynamic image analysis was utilised to quantify powders’ PSD processed with the different additivation routes. The results are presented in Figure 3.
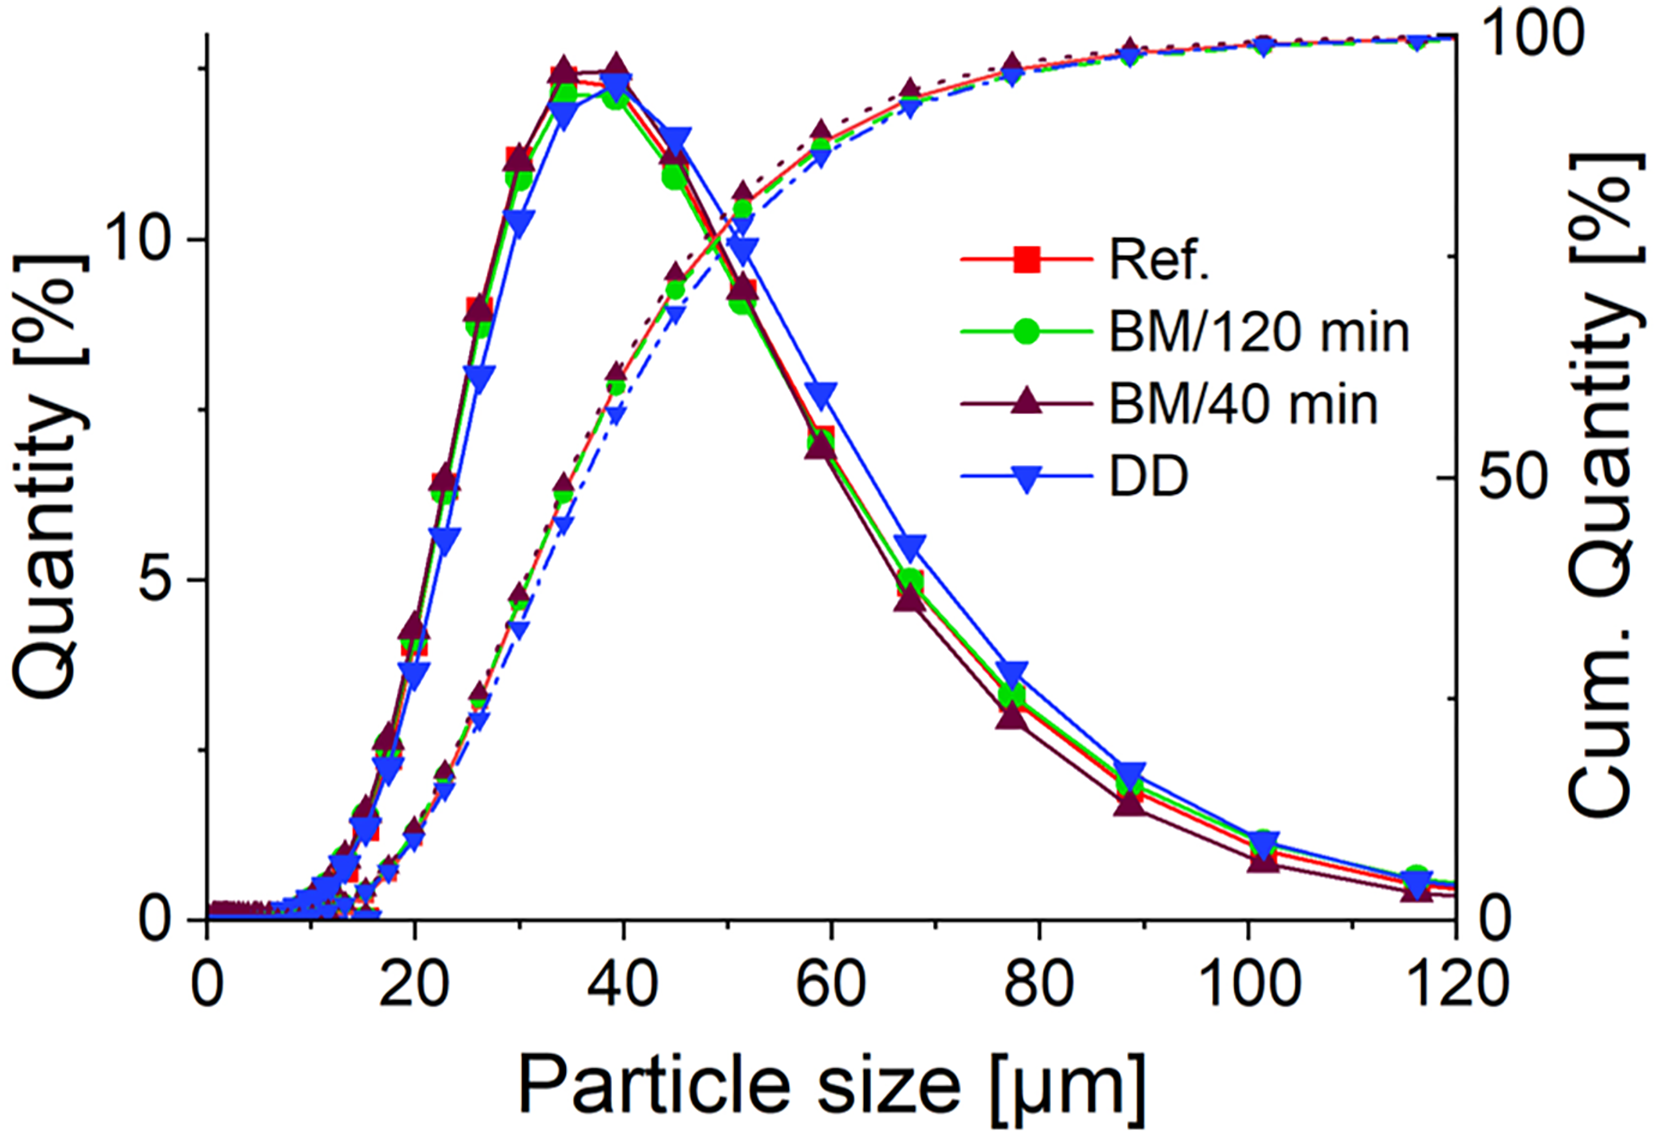
Percentual and cumulated particle size distribution of powder additivated with different routes.
The PSD analysis indicates no significant difference between the reference powder and the powders processed through BM (BM/120 min and BM/40 min) and DD. All samples exhibit a similar distribution, with D10, D50 and D90 values closely aligned across the different methods. This suggests that the additivation processes do not markedly alter the overall PSD of the Fe20Cr powder, even though the DD curve tends to shift to larger sizes compared to the reference and BM powders. Table 1 summarises PSD values of the powders and the related physical properties determined in this study.
PSD (D10, D50, D90), relative humidity, flow rate (FRH), AD, TD, Hausner Ratio and PD of reference powder Fe20Cr and additivated Fe20Cr + 1 vol.% Y2O3 powder.
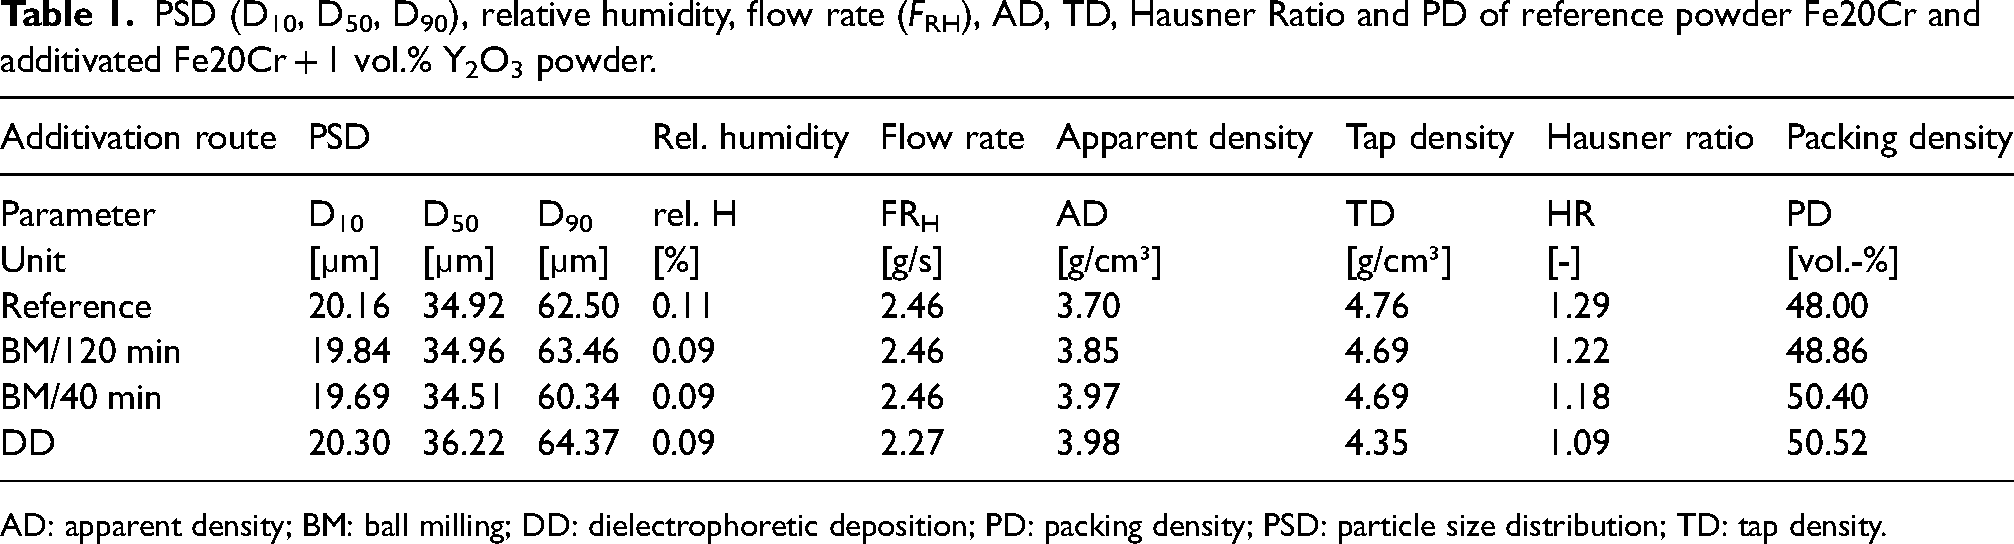
AD: apparent density; BM: ball milling; DD: dielectrophoretic deposition; PD: packing density; PSD: particle size distribution; TD: tap density.
The PSD also shows slightly larger average particle sizes, so it is assumed that ONP agglomerates could have occasionally led to the binding of the Fe20Cr particles. The standard deviation of the size values is within a maximum of 2%, with the D90 value for the DD sample showing a deviation of only 0.72 µm. Therefore, even within these minor deviations, the particle size remains slightly increased, supporting the observation that ONP agglomerates may have contributed to the binding of the Fe20Cr particles. However, there is no indication of such phenomena from SEM analysis of the ODS powders. Unlike the BM powder, where the nanoparticles are more uniformly integrated into the matrix, the DD powder shows nanoparticles prominently on the surface (Figure 2(n)). Considering the relatively high loading of 1 vol% for ODS steels in AM, the surface coverage by the nanoparticles is very dense. In the SEM images, several areas where ONP agglomerations up to 1.5 µm in height are visible can be identified. When converted to diameter, these accumulations can increase the detection of small particles < 10 µm in the PSD. The relative humidity of the powders remains low, around 0.09–0.11%, indicating minimal moisture content not affected by additivation routes. This shows that a liquid phase in the DD does not directly influence the residual moisture after the corresponding drying step. Flow rates are similar for all samples, with the reference and BM powders exhibiting a slightly higher flow rate than the DD powder. This difference can be partially attributed to interparticle friction effects, which influence flow characteristics alongside packing density and apparent density results. In the DD powder, the higher apparent and packing densities suggest a denser particle arrangement with potential interparticle friction reduction due to ONP surface distribution. The surface roughness of the DD powder and the agglomeration of ONP may lead to slightly increased interparticle friction, resulting in a lower flow rate compared to BM powders. Apparent density and tap density values show some variation, with the DD method resulting in the highest apparent density (3.98 g/cm3) and the lowest Hausner ratio (1.09), suggesting better packing efficiency and flowability. The packing density follows a similar trend, with the DD method achieving the highest value (50.52 vol.-%). The unprocessed, gas-atomized reference powder is expected to have the lowest packing density due to its unchanged sphericity. The potentially reduced sphericity in the BM/120 min and specifically in the BM/40min powder could lead to increased particle interlocking. This interlocking can result in higher packing densities. This could also occur for the DD powder due to the rougher surface and agglomeration of the NP. The morphology of mechanically alloyed powders may be influenced more strongly by the ball-to-powder ratio than by the milling time. 14 Since the BPR remained constant between BM/120 min and BM/40 min, significant packing density differences between these powders are not expected. While the DD technique showed promising results in terms of particle distribution, density and flowability, it is important to consider the reproducibility of this method. In this study, each experimental result is based on a single batch, which limits our ability to fully evaluate consistency across multiple production runs. Several factors could influence reproducibility in DD, including environmental variables like ambient humidity and room temperature, as well as fluctuations in water temperature during the dispersion process or PSD of metal and nanopowders. Small variations in these conditions could impact the behaviour of the nanoparticles in solution, their distribution on the metal particles, and the drying dynamics within the rotary evaporator.
Processability of ODS powders
Table 2 shows the process parameters and resulting densities of samples produced from the reference powder and additivated powders via BM (BM/120 min and BM/40 min) and DD. Identical parameter sets were tested within each respective build job to evaluate the influence of the different ODS powders on the production of high-density samples by PBF-LB/M.
Varied PBF-LB/M process parameters laser power (PL), scan velocity (vs) and hatch distance (Δys) with fixed layer height (
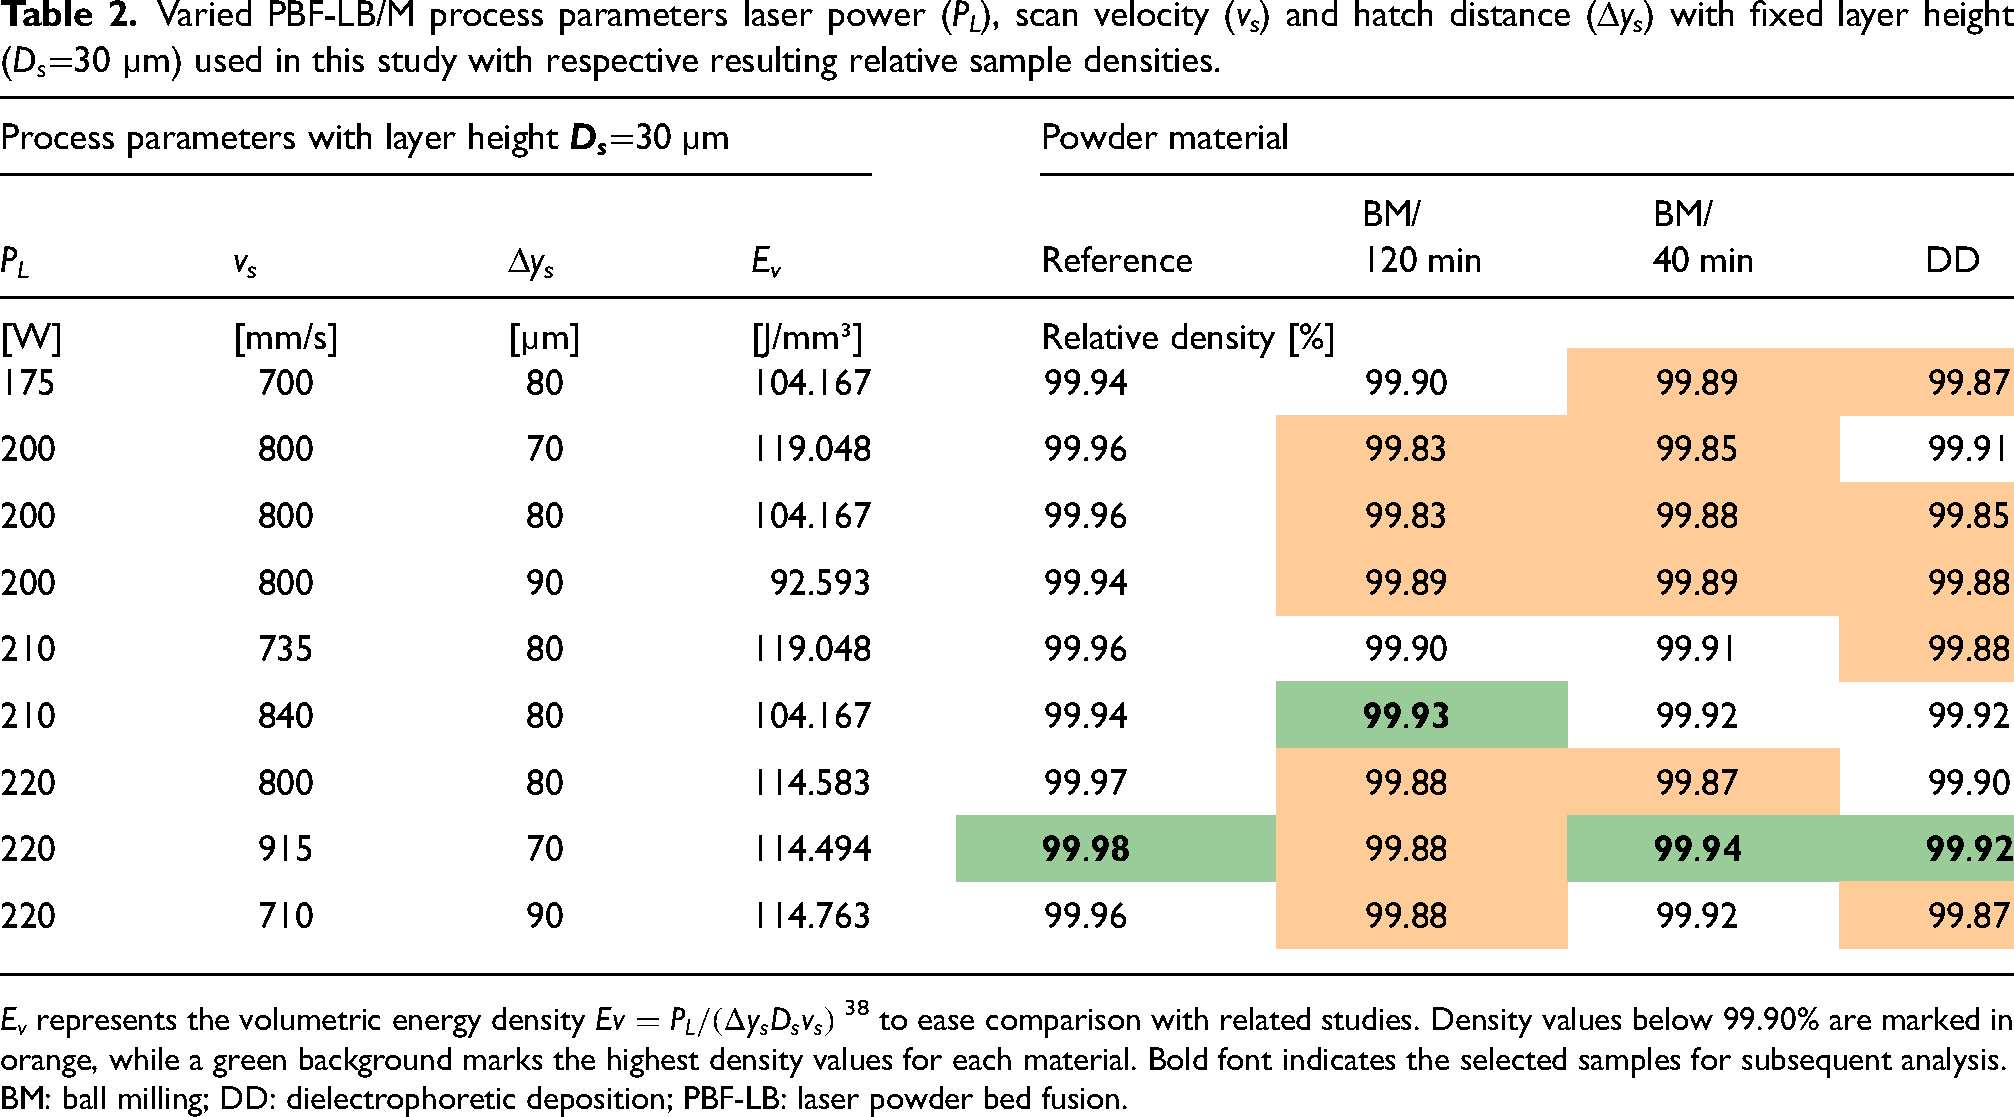
Ev represents the volumetric energy density
BM: ball milling; DD: dielectrophoretic deposition; PBF-LB: laser powder bed fusion.
The results show high densities with values consistently above 99.8% could be reached within the analyzed process window for studied powders. The lowest porosities for samples built from reference powder, BM/40 min and DD were achieved with 220 W, 915 mm/s and a 70 µm hatch distance, resulting in 99.98%, 99.94% and 99.92% relative density, respectively. For BM/120 min, the highest density of 99.94% was measured using 210 W, 840 mm/s and 80 µm hatch distance. However, all samples produced from ODS powders exhibit a lower density than the reference Fe20Cr samples. Figure 4 shows a cross-section of the samples with the highest densities of the reference and NP-loaded powder with different additivation routes BM/120 min, BM/40 min and DD. In samples with added ONPs, the number and size of micropores is slightly increased. The reasons for this have not yet been conclusively investigated, and considerations include melt pool dynamics, heat conductivity, absorption and evaporation being influenced by the ONPs.39–41
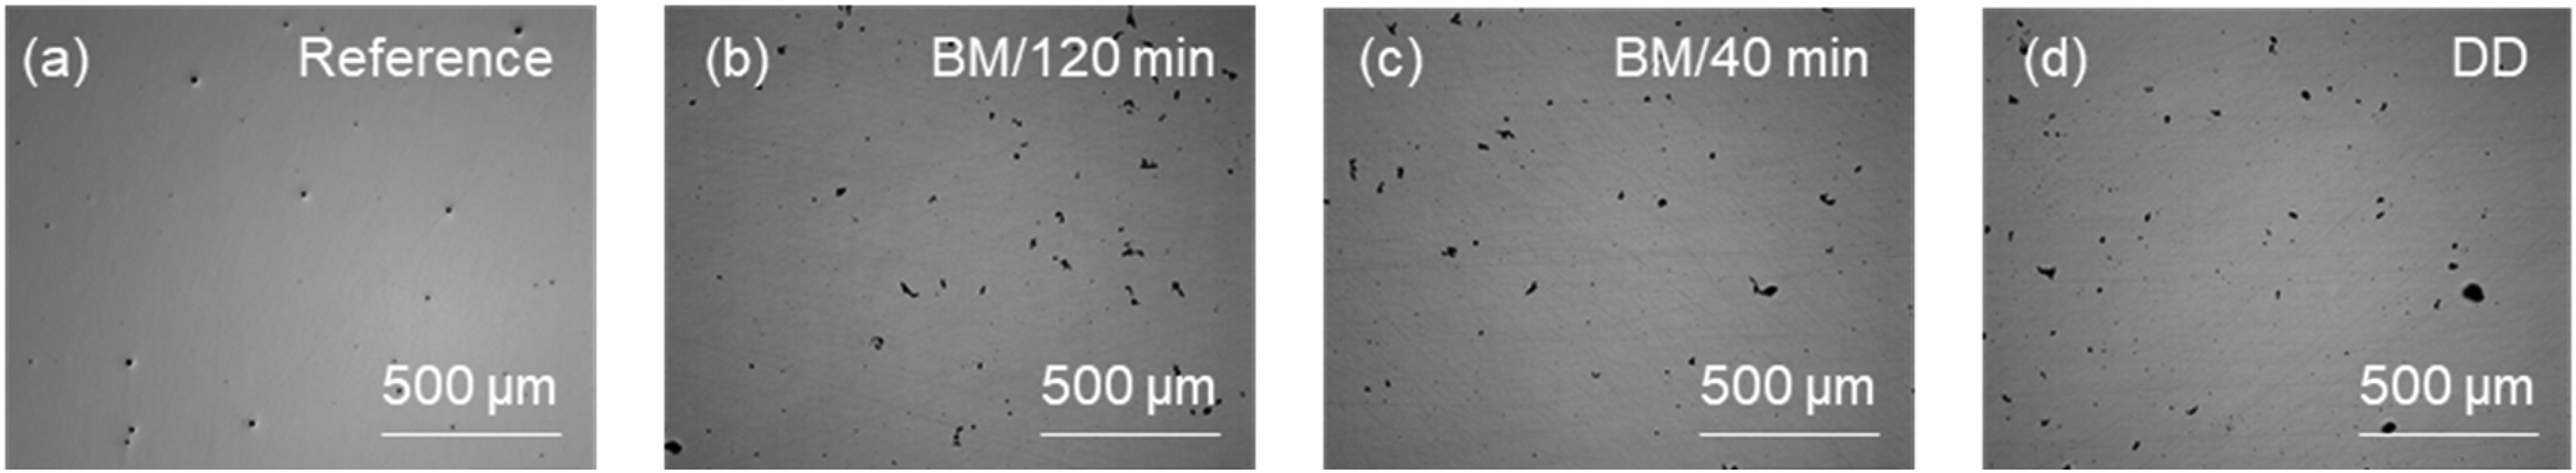
LM images of cross-sections of a reference (a), BM/120 min (b), BM/40 min (c) and DD (d) sample at 50× magnification. BM: ball milling; DD: dielectrophoretic deposition.
Moreover, the wettability of the ONPs in steel matrix is low, which may lead to related effects. 42 According to Table 1, moisture introduced by ONPs can be ruled out as the cause of increased pore formation. Notably, the pores for the ODS samples have an irregular shape, whereas the reference sample shows round pores, presumably due to gas inclusions. The irregular shape of the pores in the ODS samples might also indicate a lack of fusion during the PBF-LB/M process or be due to the poor wettability of the nanoparticles within the metal matrix. When the ONPs are not adequately wet with the surrounding molten metal during the PBF-LB/M process, it can lead to incomplete integration of the particles into the matrix. This inadequate bonding can create voids around the nanoparticles, forming irregularly shaped pores in the final sample.
The results indicate that all ODS powders demonstrate suitable processability with high-density outputs regardless of the additivation route. The variation in density is minimal among the different additivation methods, suggesting that the process window for achieving optimal density is not significantly affected. This implies that the powders’ inherent properties, such as PSD and flowability, are sufficiently maintained across different additivation processes and do not alter the process dynamics to a critical degree. It is noticeable that the parameters to achieve high-density samples with BM/120 min powder differ from those needed for the other powders, and the overall densities are lower when using BM/120 min powder. The processing of BM/120 min under ambient air could significantly impact its processability, as the increased O content in the powder may lead to a higher incidence of defects.43,44 In correlation with the higher determined Hausner ratio, it is assumed that the homogeneity of the whole powder is probably low after the long milling process. This means that analytical methods that involve only small quantities of powder may need to be evaluated more cautiously. An overall lower homogeneity might also explain variances during the PBF-LB/M process, especially regarding the powder spread and, thus, resulting densities.
Correlation between ODS powder and part composition
The chemical composition of the powders and the processed PBF-LB/M samples was analysed using XRF. The results are summarised in Table 3. According to the added 1 vol.-% Y2O3, the nominal expected Y2O3 content would be 0.6 wt.-%, and therefore, the Y content would be 0.47 wt.%.
Elemental composition of powders and PBF-LB/M produced samples analysed by XRF, values in wt.-%.
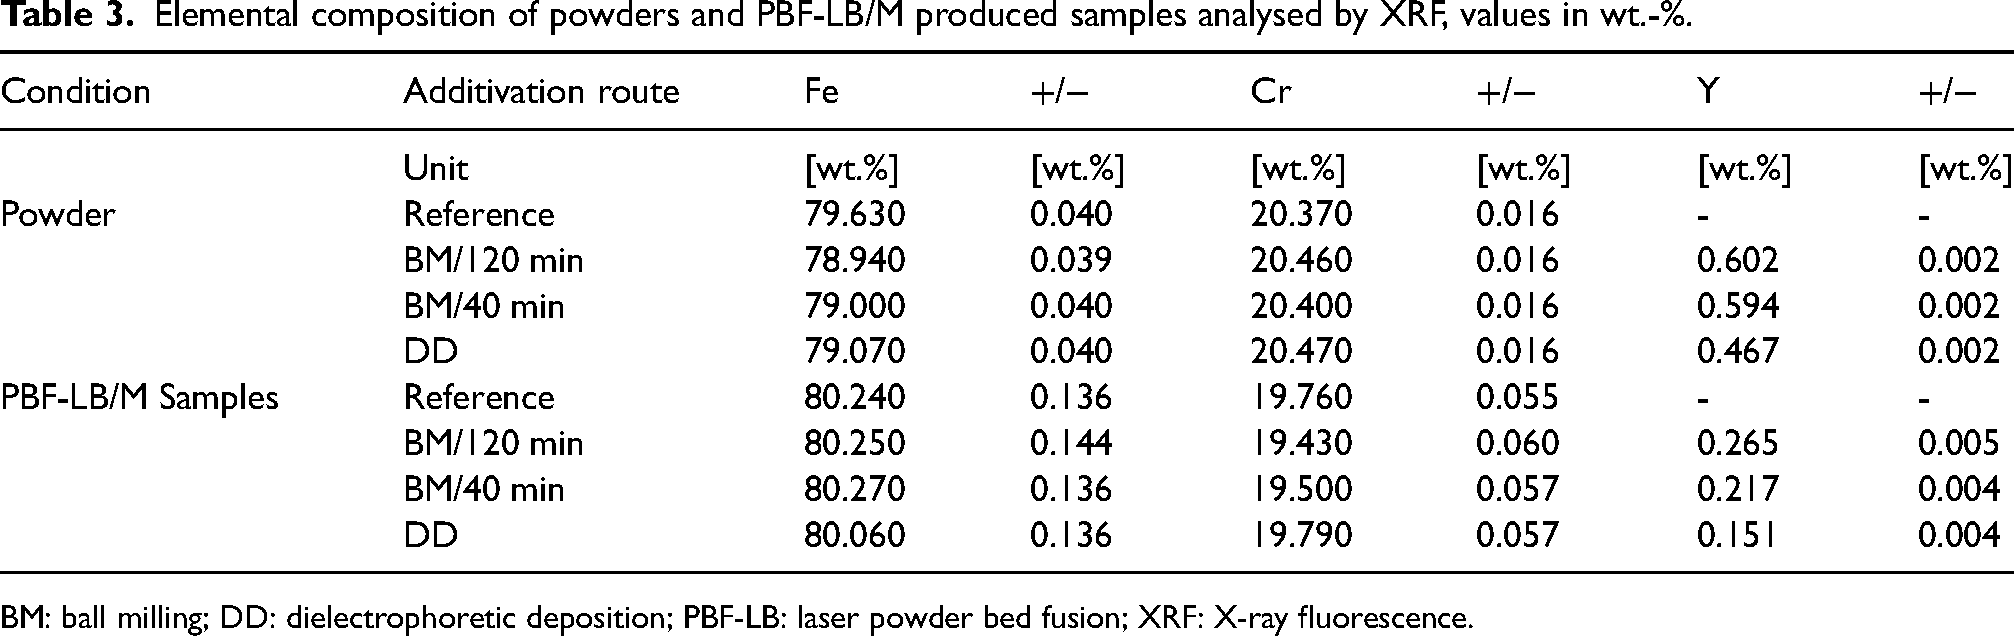
BM: ball milling; DD: dielectrophoretic deposition; PBF-LB: laser powder bed fusion; XRF: X-ray fluorescence.
The reference powder shows no detectable Y, as expected. Both BM variants (BM/120 min and BM/40 min) yield similar Y content in the ODS powders, approximately 0.6 wt.%, indicating that the BM process effectively combines Y2O3 nanoparticles with the Fe20Cr matrix powder. In contrast, the DD route shows a slightly lower Y content of 0.467 wt.%, suggesting that the supporting efficiency of this method should be further optimised in producing ODS powder despite the initial addition of the same amount of nanoparticles for additivation as in the other methods. The Y content tends to decrease by approximately 65% (BM/40 min) to 70% (DD) during PBF-LB/M processing. This reduction could be due to the loss of ONP during the process, possibly from evaporation or the removal of particles from the process zone by the shielding gas flow. This reduction may also involve re-precipitation of oxides under processing conditions, which could influence the observed oxide particle size and distribution in the solidified matrix. Although SEM was used to analyse these characteristics, it may not accurately reflect the true nano-oxide size due to agglomeration and surface effects. For a more precise determination, especially considering results from other studies on ODS steels where typical oxide sizes are closer to 10 nm,34,45 techniques such as TEM could be employed in future works. The significant decrease in Y content from DD powder to the PBF-LB/M sample suggests that Y2O3 nanoparticles may interact with the melt differently during the PBF-LB/M process than BM. SEM analysis reveals that the ONPs in the DD powder are more concentrated on the surface. This positioning leads to greater exposure to laser radiation during processing. As a result, the nanoparticles may absorb more energy, increasing the likelihood of evaporation. However, this effect can only occur at the starting points of the scan vectors as the laser radiation is then absorbed by melt. It should, therefore, not be significant concerning the total volume of the samples. Additionally, there is a potential for NP ejection from the particle surface after interacting with the laser radiation. 46 Furthermore, the Cr content shows a slight reduction from approximately 20.5% in the powder to 19.5% in the final part, suggesting a possible loss of Cr during laser processing, likely due to the evaporation of Cr2O3 or elemental Cr. 47,48
The discrepancy in Y content detection between powders and samples might be attributed to the XRF technique. The penetration depth of X-rays in XRF might affect the measurements. The analysed layer in powder measurements, which is the thickness of the sample that absorbs 90% of the intensity of the XRF line of interest, were around 100, 150 and 300 µm for Al, Cr and Y, respectively. However, the analysed layers in printed parts were 14, 20 and 39 µm. Here, sample surface preparation is crucial for detecting trace elements in a matrix. And 180 grit paper results in a surface roughness of around 25 µm and might result in lower Y amounts detected in parts. However, the grinding step might pull agglomerated Y2O3 particles from the Fe20Cr matrix due to low wettability between the two phases. Furthermore, an alternative XRF preparation methodology, such as oxidising powders with a glass forming matrix to form a glass bead where all elements are homogeneously distributed, might be recommended to understand the differences in Y contents in powder and part. This difference in nanoparticle positioning can lead to variations in the measured Y content, highlighting the need for complementary analytical techniques to obtain a higher accuracy in the assessment.
ONP size and distribution in PBF-LB/M parts
The theory of ODS highlights the importance of interparticle distance (IPD), particle size, and particle appearance in strengthening effects at high temperatures, making it crucial to examine these factors to optimise ODS material performance. Figure 5 shows SEM images of PBF-LB/M samples at various magnifications, illustrating the nanoparticle distribution and morphology in samples from BM/120min, BM/40min and DD powders. The measurements in Table 4, determined from SEM images at 5kx magnification, must be interpreted cautiously due to resolution limitations that could affect the accuracy of particle size and IPD values. However, the comparative analysis remains valid, as all measurements were consistently obtained under the same conditions. In addition to the numerical results from Table 4, the results are also visualised in Figure 6 for better comparison.
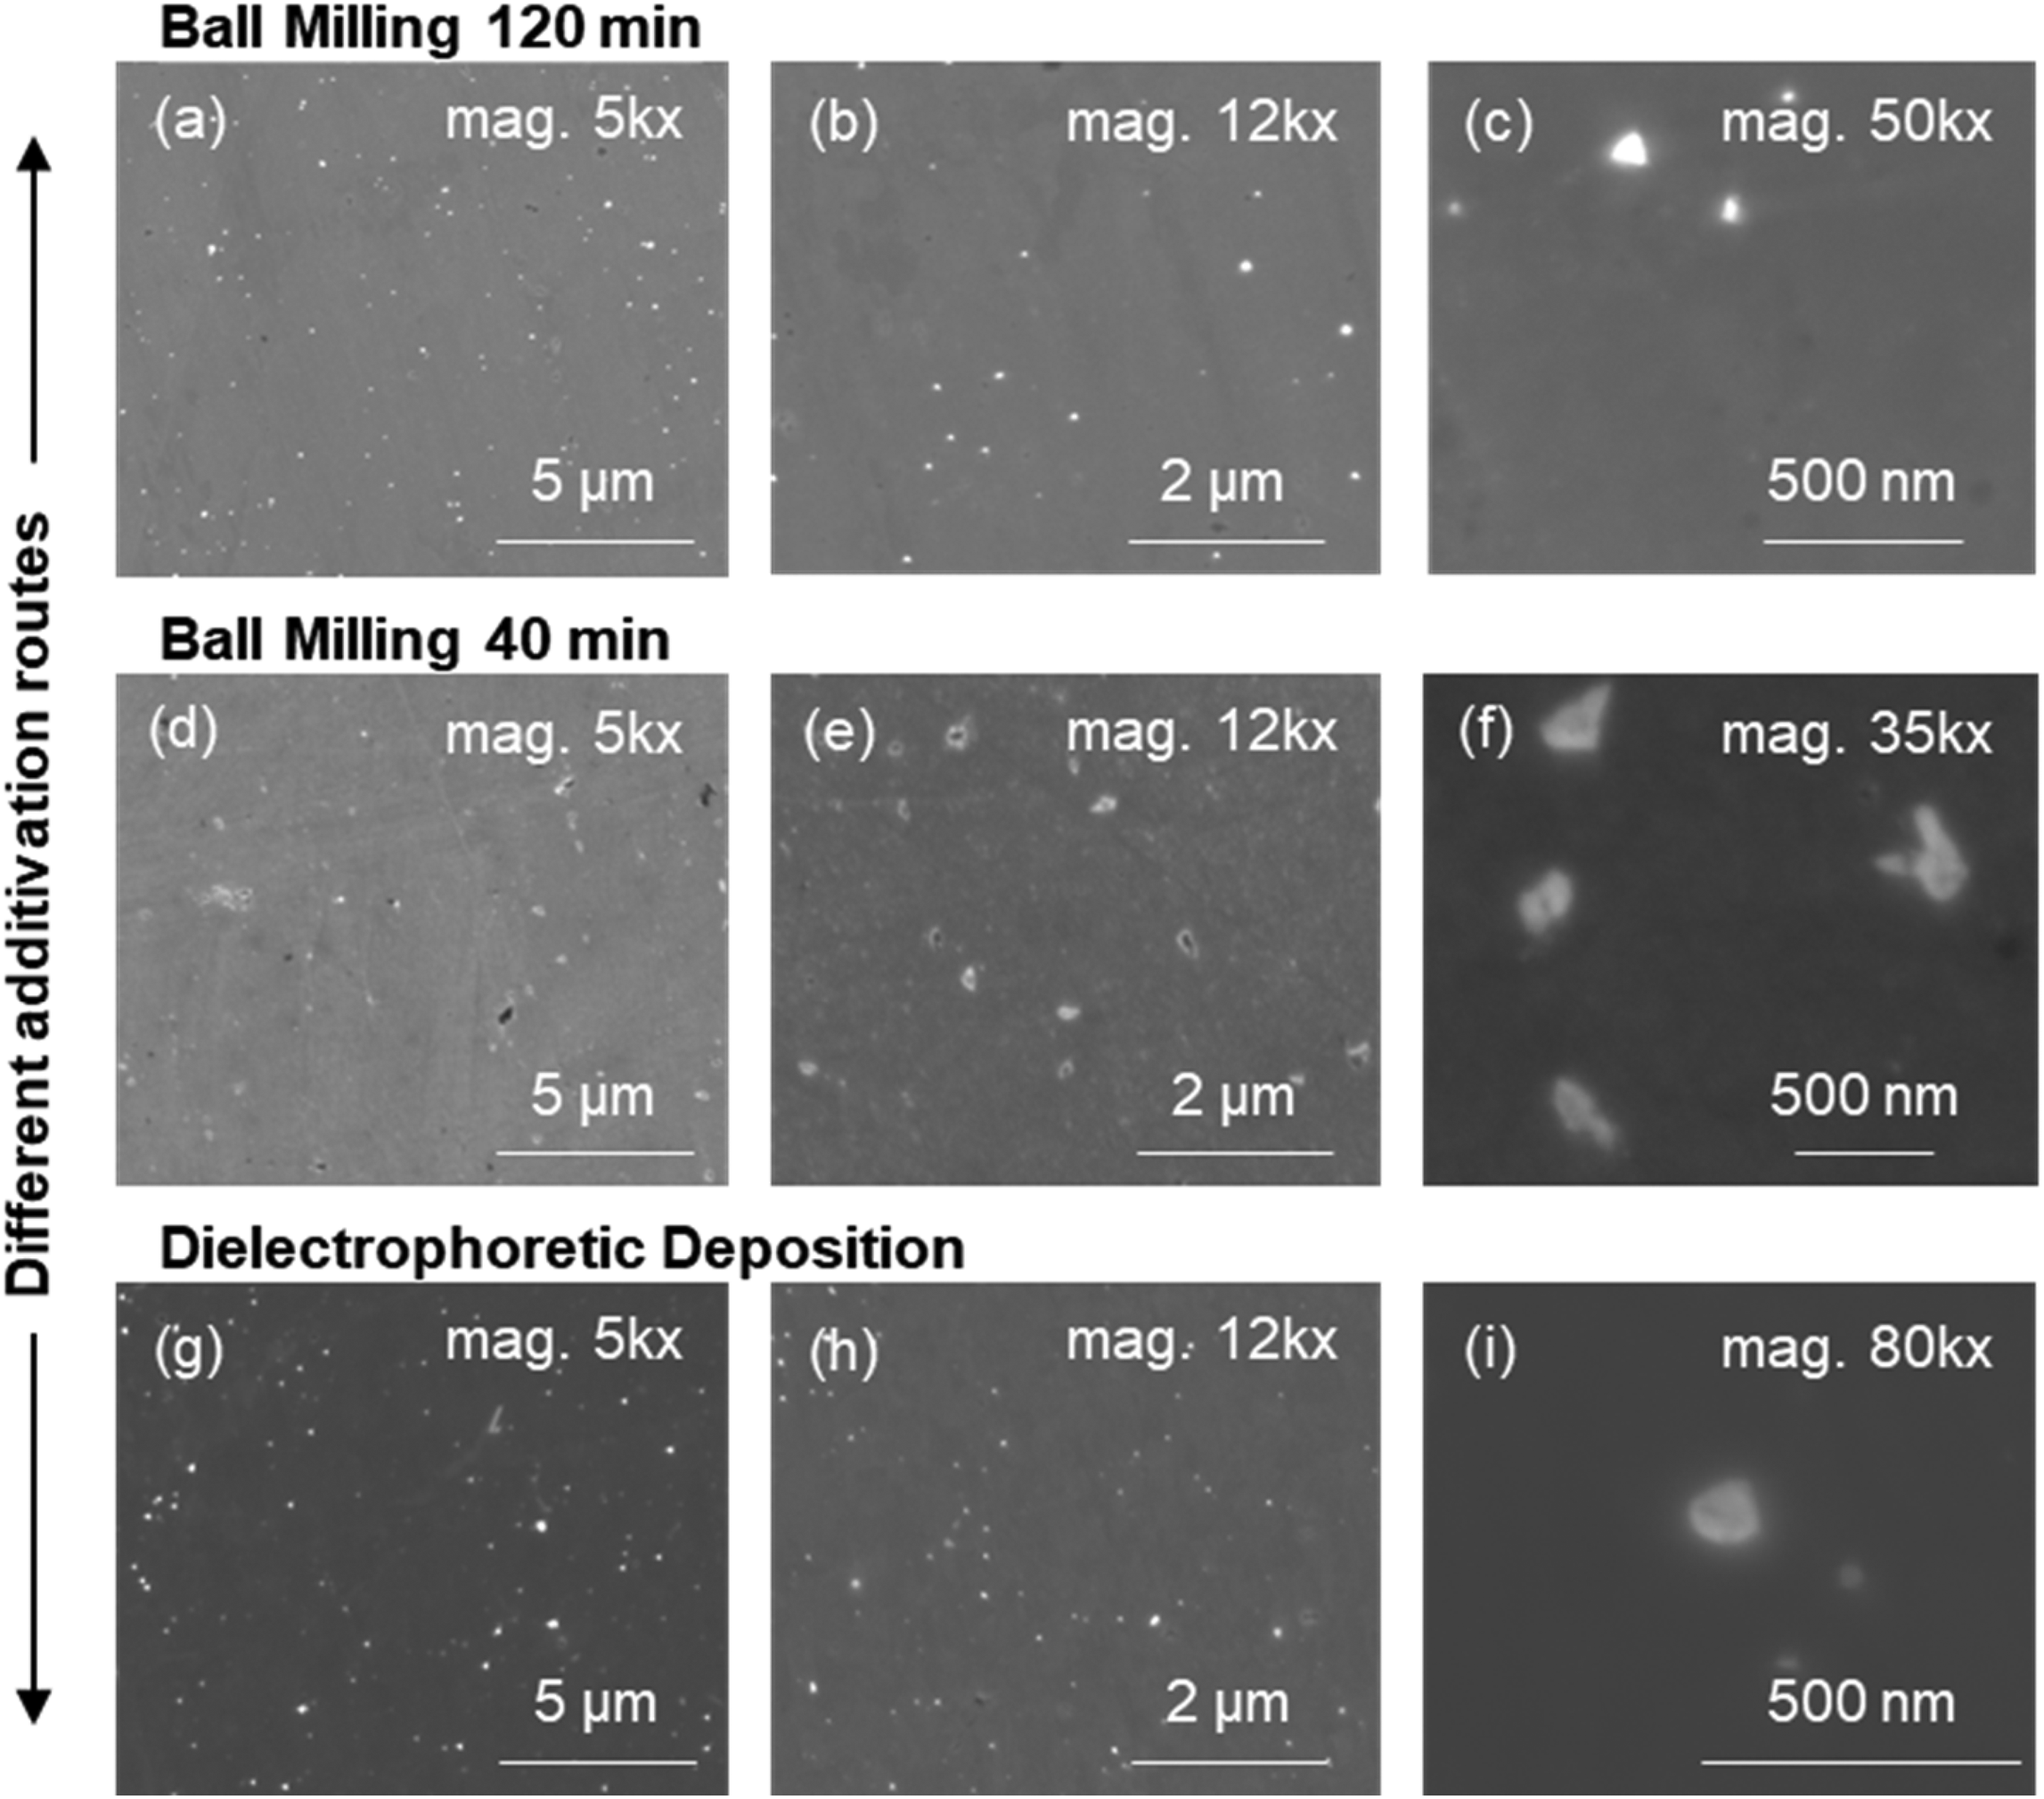
SEM images of PBF-LB/M samples in different magnification and additivation routes: (a)–(c) BM/120 min; (d)–(f) BM/40 min and (g)–(i) DD. BM: ball milling; DD: dielectrophoretic deposition; PBF-LB: laser powder bed fusion.
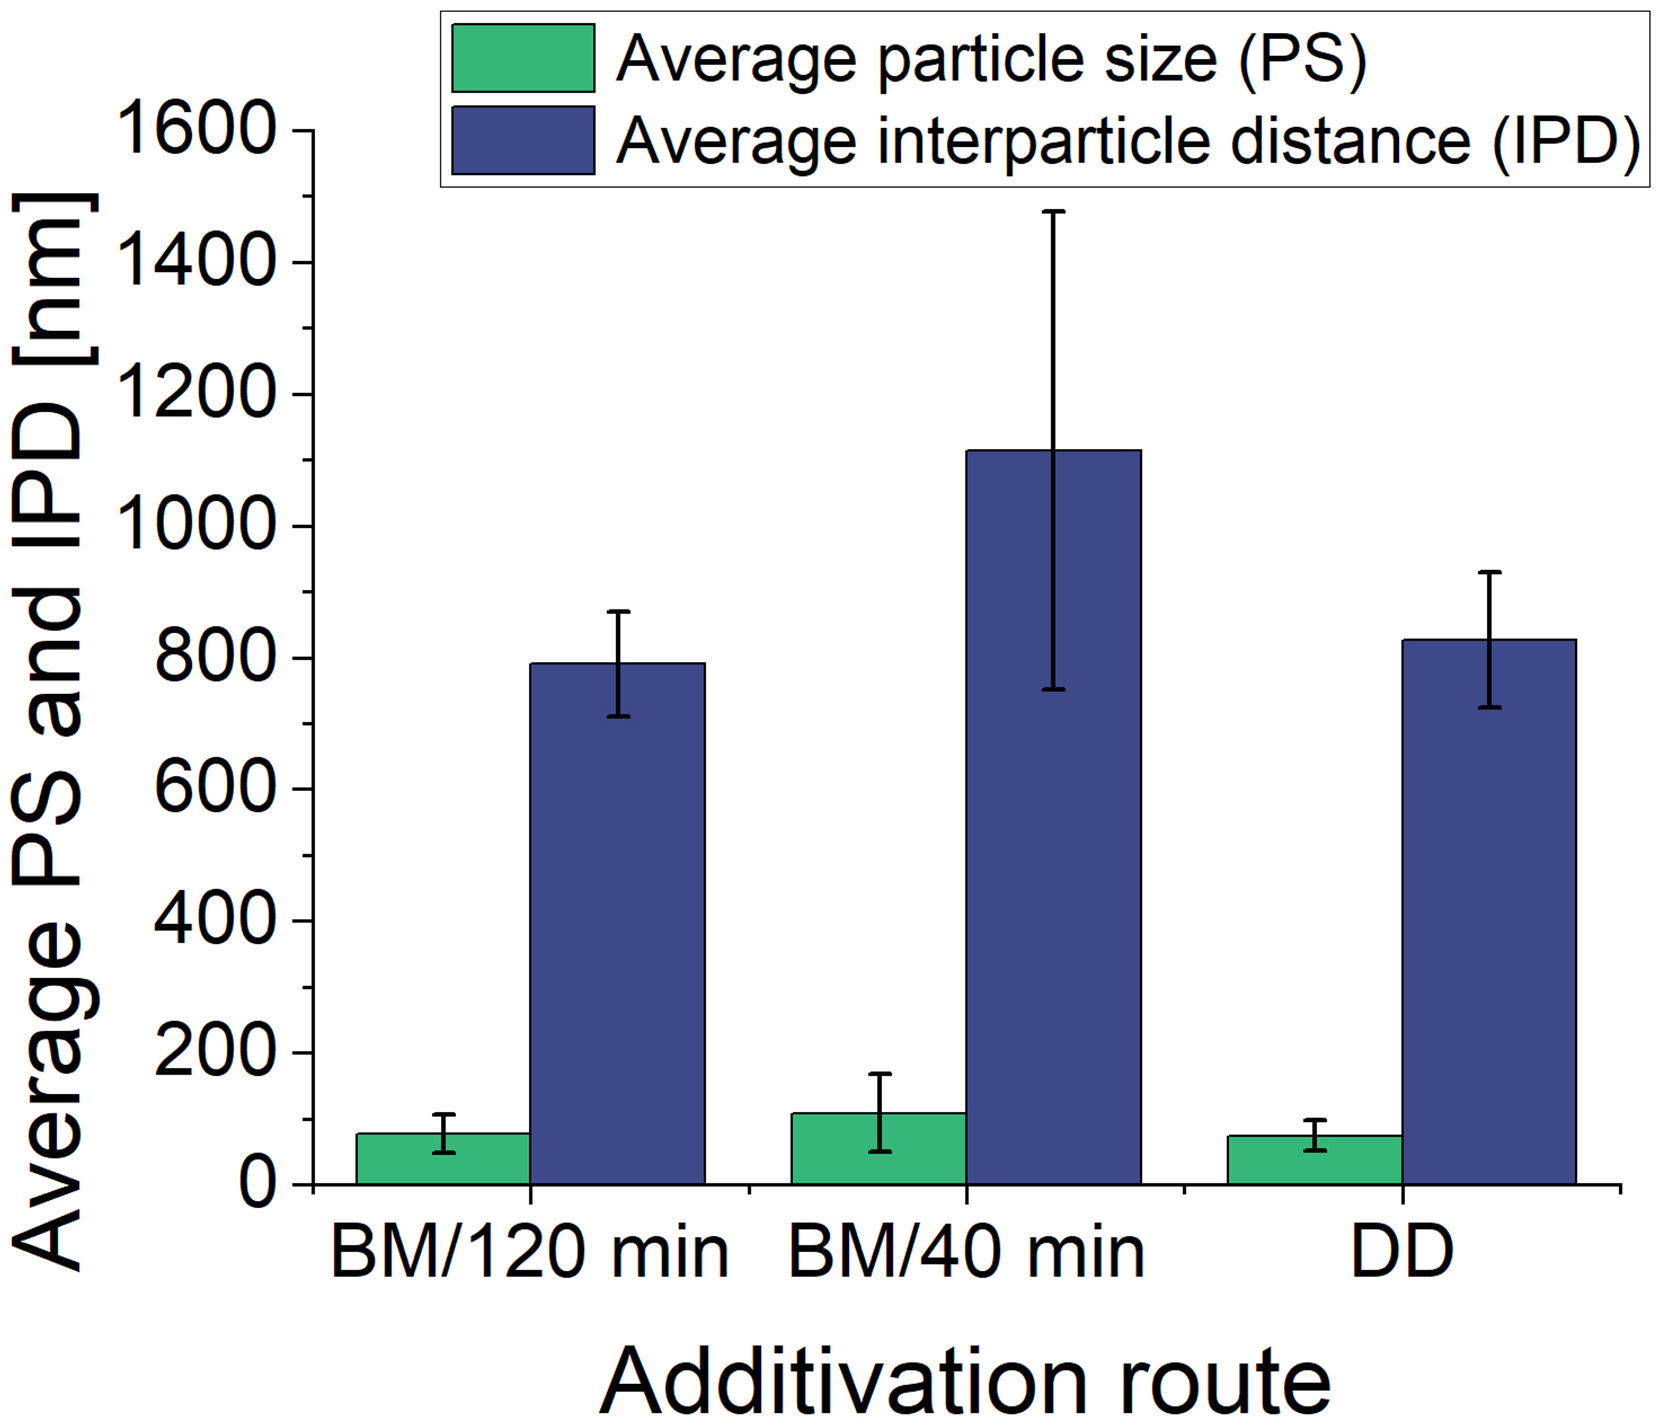
Average particle size and IPD of NP inclusions of the bulk samples additivated with different routes BM/120 min, BM/40 min and DD based on table 4. BM: ball milling; DD: dielectrophoretic deposition; IPD: interparticle distance.
Particle size and interparticle distance including SD.
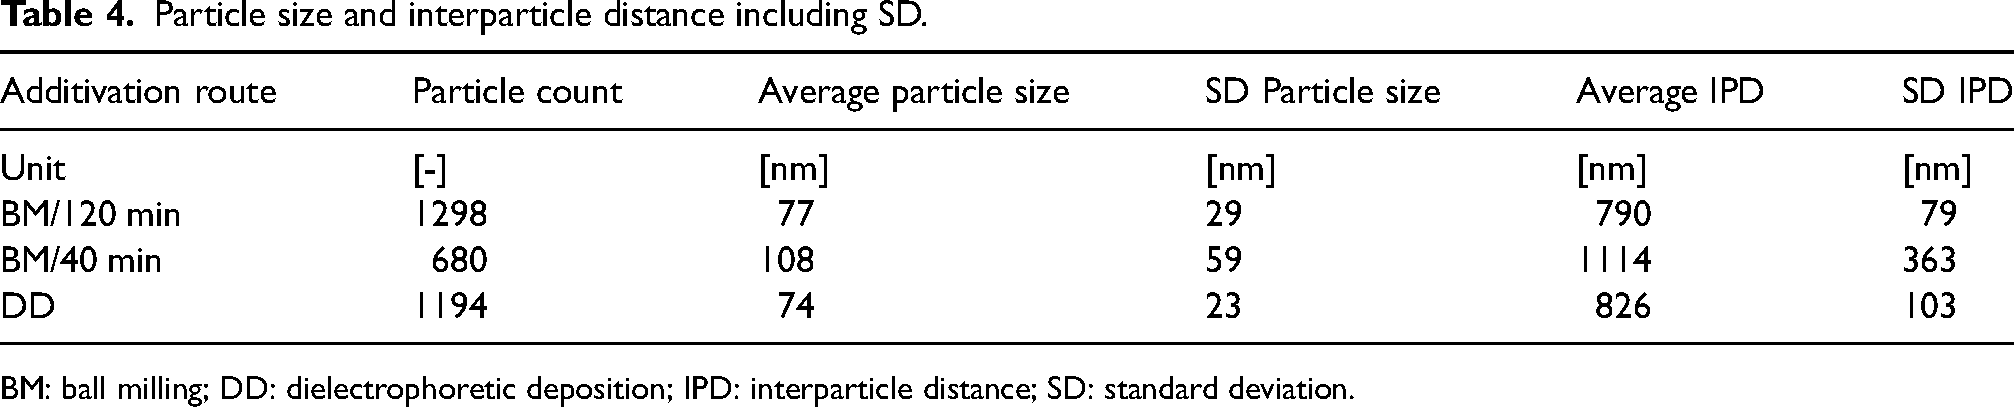
BM: ball milling; DD: dielectrophoretic deposition; IPD: interparticle distance; SD: standard deviation.
As observed in the SEM images, all samples contain visible ONP regions of various sizes, with larger areas likely being agglomerates (Figure 5(c), (f) and (i)). The lower detection limit for the ONP size is approximately 2 to 5 nm. Notably, the BM/40 min sample shows larger ONPs than the manufacturer's specifications and the other samples, indicating significant agglomeration during the shorter milling process and subsequent PBF-LB/M processing. The shorter milling time likely leads to agglomeration, which can also be observed with a gentler mixing process, such as tumbling. The ONPs tend to cluster during the initial milling stages, compounded by the van der Waals forces and density differences between the ONPs and metal powder. This results in a less uniform distribution of ONPs in the printed part, with an average particle size of 108 nm and a significantly larger IPD of 1114 nm, as detailed in Table 4. The elongated ONPs in this sample further suggest that the milling duration was insufficient to break down these agglomerates, leading to a less controlled distribution.
In contrast, the BM/120 min sample exhibits a finer and more uniform distribution of ONPs, with an average size of 77 nm and an IPD of 790 nm. The longer milling time facilitates the embedding of ONPs into the metal powder, causing the agglomerates to break down and resulting in smaller, more spherical particles, according to the literature. 25 This improved distribution is comparable to DD, where the ONPs are slightly smaller, averaging 74 nm, and better distributed, as indicated by a narrower size distribution and smaller error margin in Table 4 and Figure 6. Compared to the embedded ONP on the powder particles of the BM parts, the ONPs are additivated on the surface of the metal particle. The position of ONPs on the surface of the DD powder likely allows these nanoparticles to immediately interact with the surrounding melt pool during the PBF-LB/M process, resulting in greater oxide particle retention and distribution in the subsequently solidified microstructure.
In contrast, in the BM samples, where the ONPs are embedded within the metal matrix, the nanoparticles only interact with the melt pool once the powder particles have melted. This delayed interaction could contribute to the observed differences in particle size and distribution, as the ONPs in the BM samples might have less time to disperse evenly within the melt pool. Ultimately, while the analysis does not provide conclusive insights into the differences in nanoparticle size between the BM powder samples before processing, it is evident that the BM/120 min and DD methods produce a more favourable nanoparticle distribution for dispersion strengthening than the BM/40 min sample. The smaller nanoparticles and shorter interparticle distances observed in the DD sample are particularly beneficial for enhanced dispersion strengthening, as supported by previous studies.28,29 Although the differences in size and distribution of BM/120min and DD are minimal, they may be more related to the initial size of the nanoparticles in the powder before processing rather than their position within the powder particles.
Conclusions
This study comprehensively investigated the impact of different additivation processes on the properties and processability of ODS powders tailored for the AM process of PBF-LB/M, addressing the growing demand for high-performance materials in complex shapes. An amount of 1 vol.-% Y2O3 NP was successfully additivated onto Fe20Cr powders using BM (ball milling) and DD (dielectrophoretic deposition) and subsequently processed into dense samples.
It was found that DD maintains the initial powder shape and surface, while oxide nanoparticles (ONPs) are homogeneously distributed on the Fe20Cr powder surface. BM powders show slight deformation and surface roughening, while ONPs are embedded into the Fe20Cr particles. In the SEM images, ONPs are not visible on the surface of the BM powders. In contrast, ONPs on the DD powder are uniformly distributed on the surface, forming some agglomerations. The exact distribution of the nanoparticles could not be further detailed using Y detection with EDS. ODS powder property analyses indicate that while the additivation routes do not significantly alter the PSD (D50 ∼ 35 µm), the DD method may offer slight advantages in maintaining powder morphology and potentially in improving flow properties compared to BM. However, the observed differences show no apparent impact on the AM process. Compared to Fe20Cr reference material, ONP additivation does not significantly impact the maximum achievable density of the final parts. The processing window is reduced regardless of the selected additivation method, which indicates lower process stability. Deformed particles, partly visible in the BM samples, can lead to uneven powder deposition and defects in the printed parts. All additivation routes effectively introduced Y2O3 nanoparticles into the Fe20Cr matrix of PBF-LB/M parts. The BM/40min samples show larger ONPs and agglomerates (average size: 108 nm) and greater interparticle distances (1114 nm) than the BM/120min sample (77 and 790 nm) and DD sample (74 and 826 nm, respectively).
Although the DD method does not achieve a substantial difference in particle size or interparticle distance compared to the optimised BM/120 min process, it may be advantageous in applications requiring reduced deformation of particles and enhanced flowability due to its preservation of powder morphology. However, an adapted BM process could yield similar results by optimising milling parameters to achieve a finer and more uniform distribution of ONPs, as shown in the BM/120 min samples. Initially, plate-shaped ONPs could not be observed in the final samples, probably because they had either been dissolved or were below the SEM detection limit. The chemical analysis by XRF showed that both BM variants (BM/120 min and BM/40 min) had similar Y contents in the ODS powders (∼0.6 wt.%), while the DD method resulted in a slightly lower Y content (0.467 wt.%). During PBF-LB/M processing, Y content decreased significantly, by approximately 65% (BM/40 min) to 70% (DD), likely due to evaporation or removal of nanoparticles from the process area, such as by the shielding gas flow.
While this study focuses primarily on the powder characterisation and oxide distribution in powders produced by ball milling and DD, it is acknowledged that mechanical properties are critical for assessing the overall performance of AM parts. The uniform dispersion of oxides within the powder is expected to influence the mechanical behaviour of the printed bulk material; however, this effect was not evaluated in the present study. The findings presented here lay the groundwork for future studies investigating the relationship between oxide distribution and the mechanical properties of AM parts. These future studies will enable a more comprehensive understanding of how powder characteristics affect the final material performance. Additionally, the nanoparticle distribution was primarily evaluated using SEM and EDS, which, due to resolution limits, may not fully capture the true size and dispersion of nanoparticles, particularly for oxides below 10 nm. Future studies should incorporate higher-resolution techniques such as TEM to provide a more accurate analysis of nanoparticle size and distribution, along with comprehensive mechanical testing, to more robustly establish the impact of nanoparticle dispersion methods on bulk material performance.
Footnotes
Acknowledgements
We want to thank Daniel Borchert, Leon Dippel and Nils Wiethoff for their support during the experiments and metallographic analysis. Additionally, we extend our gratitude to Ivan Zhirnov for his assistance in analysing the SEM images with ImageJ, Tobias Bochmann for his contributions to SEM and EDS imaging of the powder particles and Jurij Jakobi for his help with the XRF measurements. This manuscript was prepared with the aid of ChatGPT to refine sections of the text.
Author contributions
MG and FR were involved in conceptualisation, writing – original draft and investigation; S-KR in conceptualisation, writing – original draft; AE in investigation; IMK in investigation and writing – review & editing; AH and UK in writing – review & editing and BG in conceptualisation, funding acquisition and writing – review & editing.
Declaration of conflicting interests
The authors declared no potential conflicts of interest with respect to the research, authorship, and/or publication of this article.
Funding
The authors disclosed receipt of the following financial support for the research, authorship, and/or publication of this article: This research was conducted as part of the German Research Foundation (DFG) Priority Program 2122, “Materials for Additive Manufacturing” (SPP 2122, project number 493889809, GO 2566/13-1, and XU 121/20-1 and SPP2122 coordination project numbered 359962234). Additionally, B. Gökce acknowledges support from the DFG Heisenberg Program, project GO 2566/10-1 (445127149).