
Abstract
Electromagnetic axial powder compaction (EMAPC) uses strong magnetic fields to compact powder metallurgy components at high speeds. Lorentz forces accelerate the punch to compact powder in EMAPC. Thus, high magnetic fields cause powder deformations in microseconds. Therefore, measuring the compact height, magnetic field distribution, and compaction velocity was difficult. No literature has reported EMAPC finite element (FE) modeling. Thus, an LS-DYNA multi-physics solver-based FE 3D model has been developed to study SS316s EMAPC. A cylindrical SS316 sample was simulated for EMAPC at various discharge energies. The powder-compressed sample's final deformation was predicted through simulation. To characterize compacted samples, sintered samples were studied for density, porosity, and microhardness. Compressed samples were microscopically examined using optical microscopy. Increased discharge energy lowers height, increases density, and microhardness. FE analysis can be used to optimize EMAPC process parameters for powder compact density and porosity.
Introduction
Powder metallurgy processes produce parts with improved structural properties and high precision tolerances. However, the rapid advancements in modern industry demand the production of high-performance materials, which cannot be achieved with conventional powder compaction methods. Therefore, there is a pressing need to develop efficient powder compaction processes to meet industry requirements. 1 While there are several advanced powder compaction methods available,2–4 electromagnetic (EM) powder compaction stands out as a high-efficiency process with a high-power rate compaction mechanism. This process employs a strong magnetic field to transform the powder into a high-density near-net-shape product. 5
Notably, Huang et al. 6 utilized ANSYS software to analyze the displacement, velocity, and stress of aluminum powder during the low-voltage EM compaction method. Cui et al. 7 investigated the spring-back behavior of copper powder compacts produced using EM pulse compaction and analyzed it with MSC Marc software. To quantitatively replicate the compaction response of pharmaceutical powders, Han et al. 8 employed a modified Drucker-Prager Cap constitutive model. This model was implemented in ABAQUS through a user subroutine to calculate stress and density variations during compression, decompression, and ejection. Rui et al. 9 utilized elasto-plastic 3D FEA with the modified Drucker-Prager Cap model in ABAQUS to simulate the compaction process and predict the residual stress of green PM compacts of Distaloy AE. Ali et al. 10 addressed the challenges in finite element (FE) modeling of EM forming by introducing an improved loose coupling algorithm that considers deformation effects on pressure, enhancing simulation accuracy and efficiency.
SS316 alloy possesses exceptional mechanical properties, characterized by high strength and hardness. This alloy finds extensive application in machinery manufacturing, electronics, aerospace, and various other fields.11,12 Therefore, this article focuses on the development of a strongly coupled FE model using LS-DYNA software to analyze the EM axial compaction of SS316 powders. FE simulations provide insights into the variation of magnetic field distribution over time and the dynamics of powder at different time steps for four distinct discharge energies. The established FEM model has been rigorously validated against experimental results
Experimental and simulation procedure
Description of the EM compaction equipment
EM powder compaction machines essentially utilize high-energy storage capacitor banks to discharge a significant electrical current through driving coils in mere microseconds. Figure 1 shows an EM powder compaction electrical circuit with the powder compaction work stage. As shown in Figure 1, the EM powder compaction equipment consisted of a set of capacitors, a control panel, a power supply unit, and a powder compaction assembly. The compaction workstation comprised various elements such as a multi-turn pancake coil, a driver plate, a plunger-punch, and a die. In this work, the pancake coil and driver are made up of copper material. The geometrical dimensions of the experimental setup are given in Figure 2(b). The punch and die are made up of SS 316 material with an internal diameter of 13 mm. Experiments were carried out on a 25 kJ and 250 µF capacitance EM forming machine.
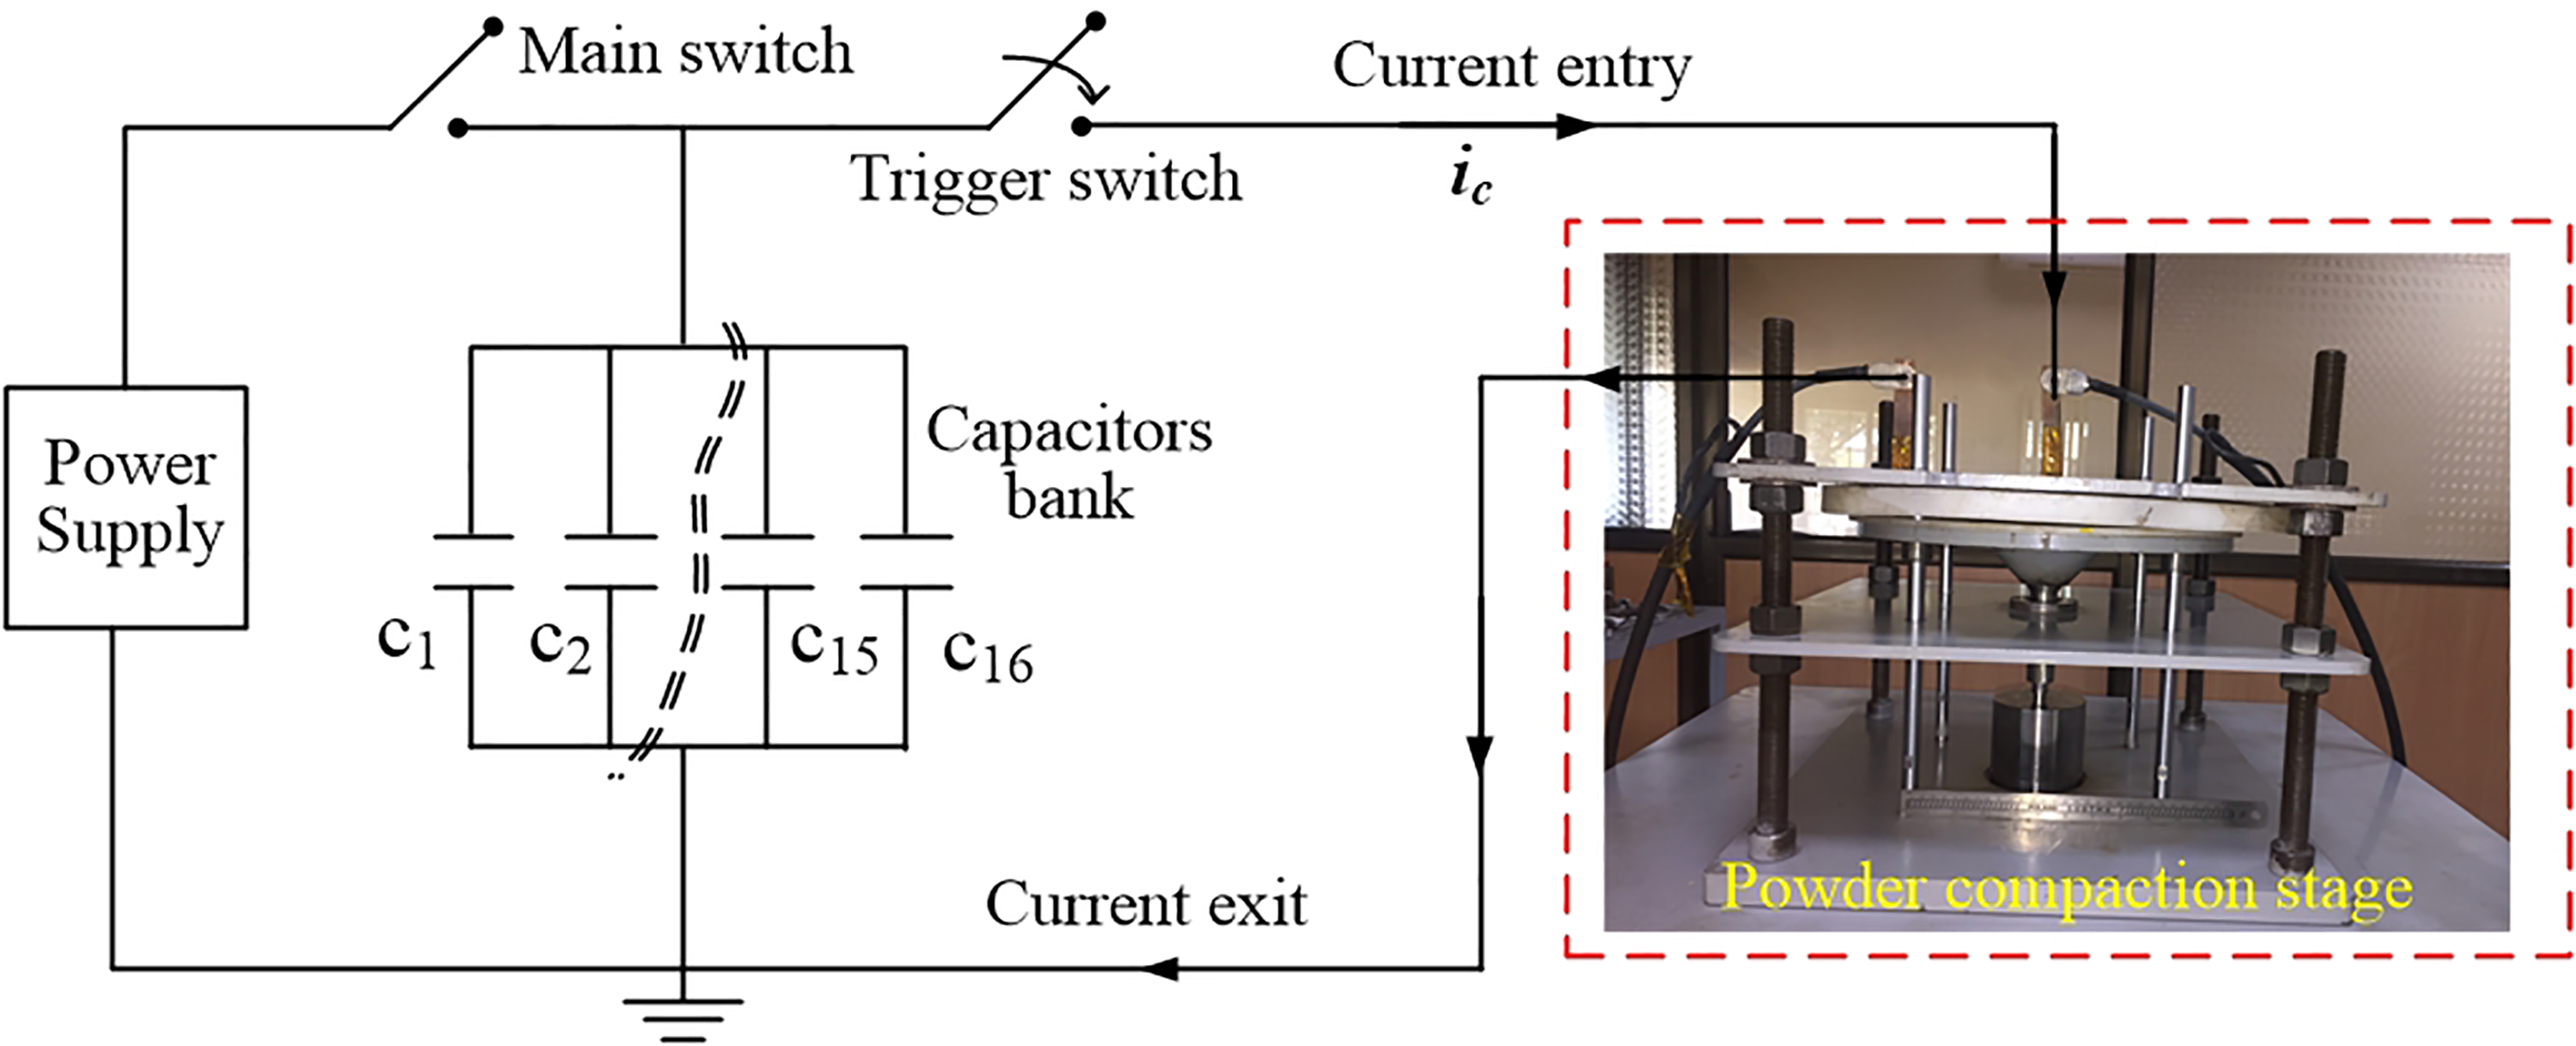
Electrical circuit and experimental compaction setup of EM powder compaction process.
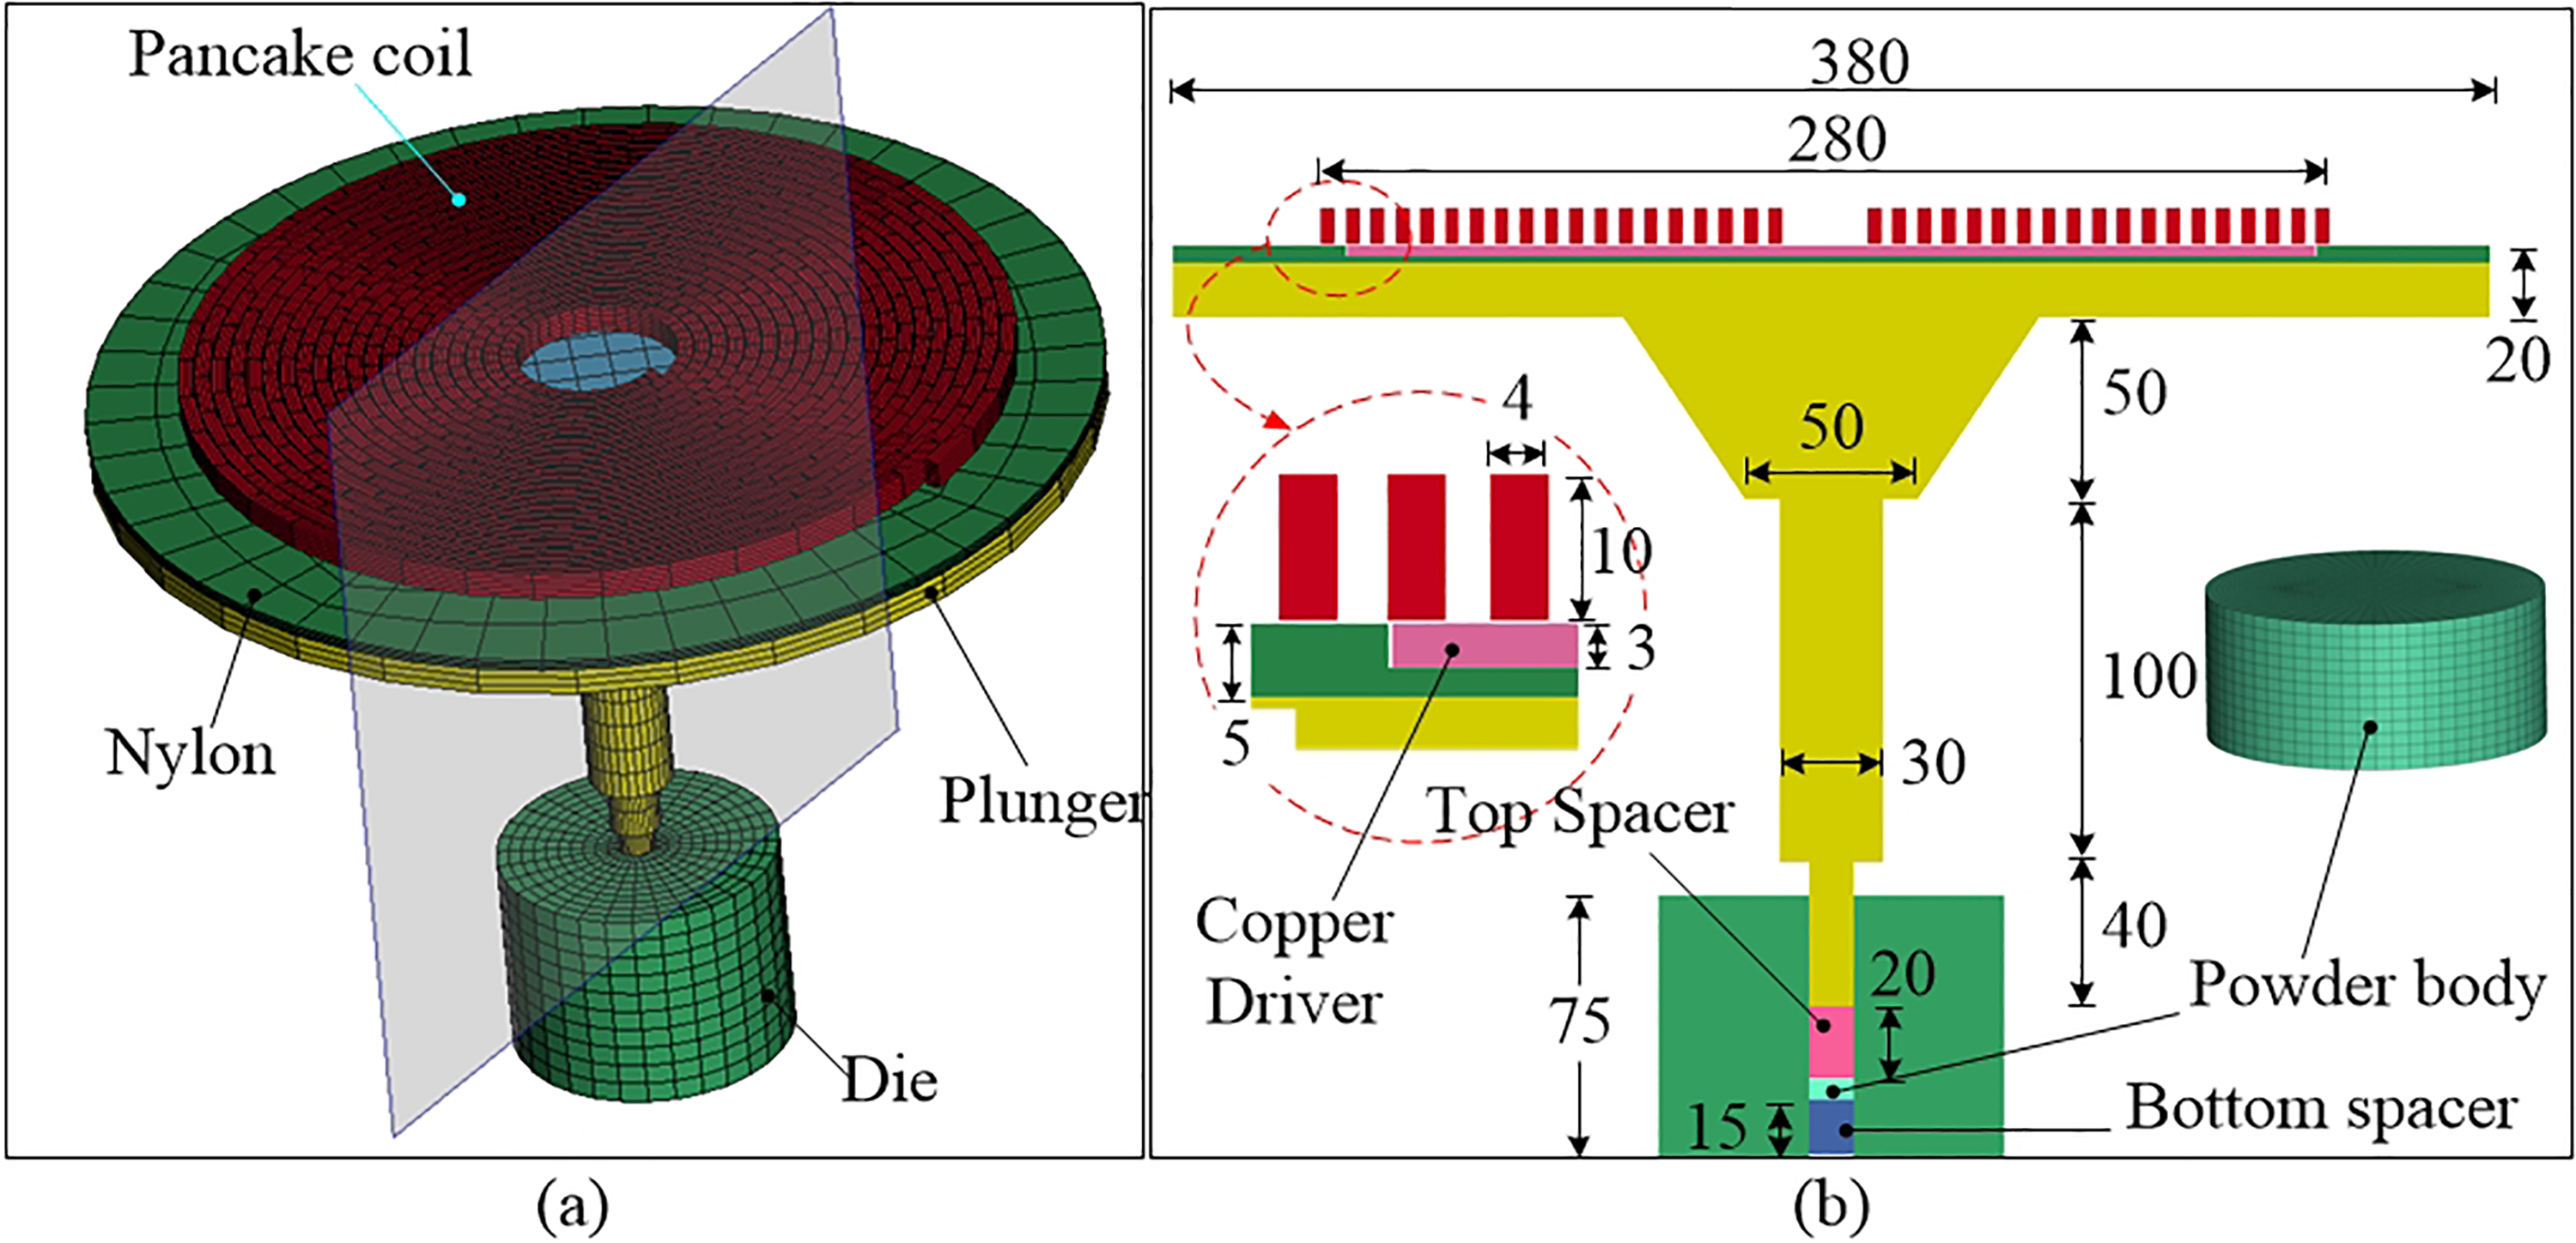
EMAPC model in LS-PREPOST (a) 3D model and (b) sectional geometry with dimensions.
The rigidity of a powder compaction tool is an important aspect in the EM powder compaction operation because it ensures consistent operation and stability of the entire system under various mechanical stresses and loads during the powder compaction process. This rigidity is essential to ensure both the quality and precision of the final powder compact product. The frame and structural components of the powder compaction machine were selected to be robust and rigid. The rigidity of the supporting plates ensures that they do not deform when subjected to forces during the compaction process. EM powder compaction system uses strong magnetic fields to compact the powder placed in the die. The main components responsible for generating these strong magnetic fields are the coil and driver plate. Thus, these components are securely mounted on a nylon block and aligned to maintain their position and strength during operation. The tooling punch and dies in the compaction machine are crucial for shaping the powder into the desired form. These components are made up of SS 316 steel and rigidly mounted with the help of bolts. Proper alignment precautions were taken to prevent any misalignment during the compaction process, which could result in non-uniform compaction.
With the use of a Rogowski coil and oscilloscope, the discharge current passing through the coil may be measured. To begin the experiments, the capacitors were charged to the required energy, and the energy was then dumped through the driving coil using a trigger switch. RLC circuits provided high amplitude damped sinusoidal current to flow through coil. Due to this, an eddy current was produced in the adjacent conductor, that is, driving coil. Strong Lorentz forces were produced between the coil and driver plate as a result of the opposing nature of the applied current in the flat coil and the eddy currents in the driving plate. Lorentz force drove the punch with very high velocity to compact the powder placed in the steel die. In this manner, the powder gets quickly compressed to a near-net shape with high density.
FE modeling procedure
LS-DYNA is FE analysis software commonly used for simulating various dynamic and nonlinear phenomena, including EM-forming processes. EM fields are solved using a FE method for the conductors, coupled with a Boundary Element Method for the surrounding air. In EM forming simulations, several key elements and components need to be modeled to accurately capture the physics of the process. The main elements and components commonly used in the EM powder compaction process are the coil, driver plate, plunger, die, and powder body. LS-PREPOST v4.7.2 was used to model the mentioned elements. Figure 2 depicts the EM axial powder compaction model and its geometrical dimensions.
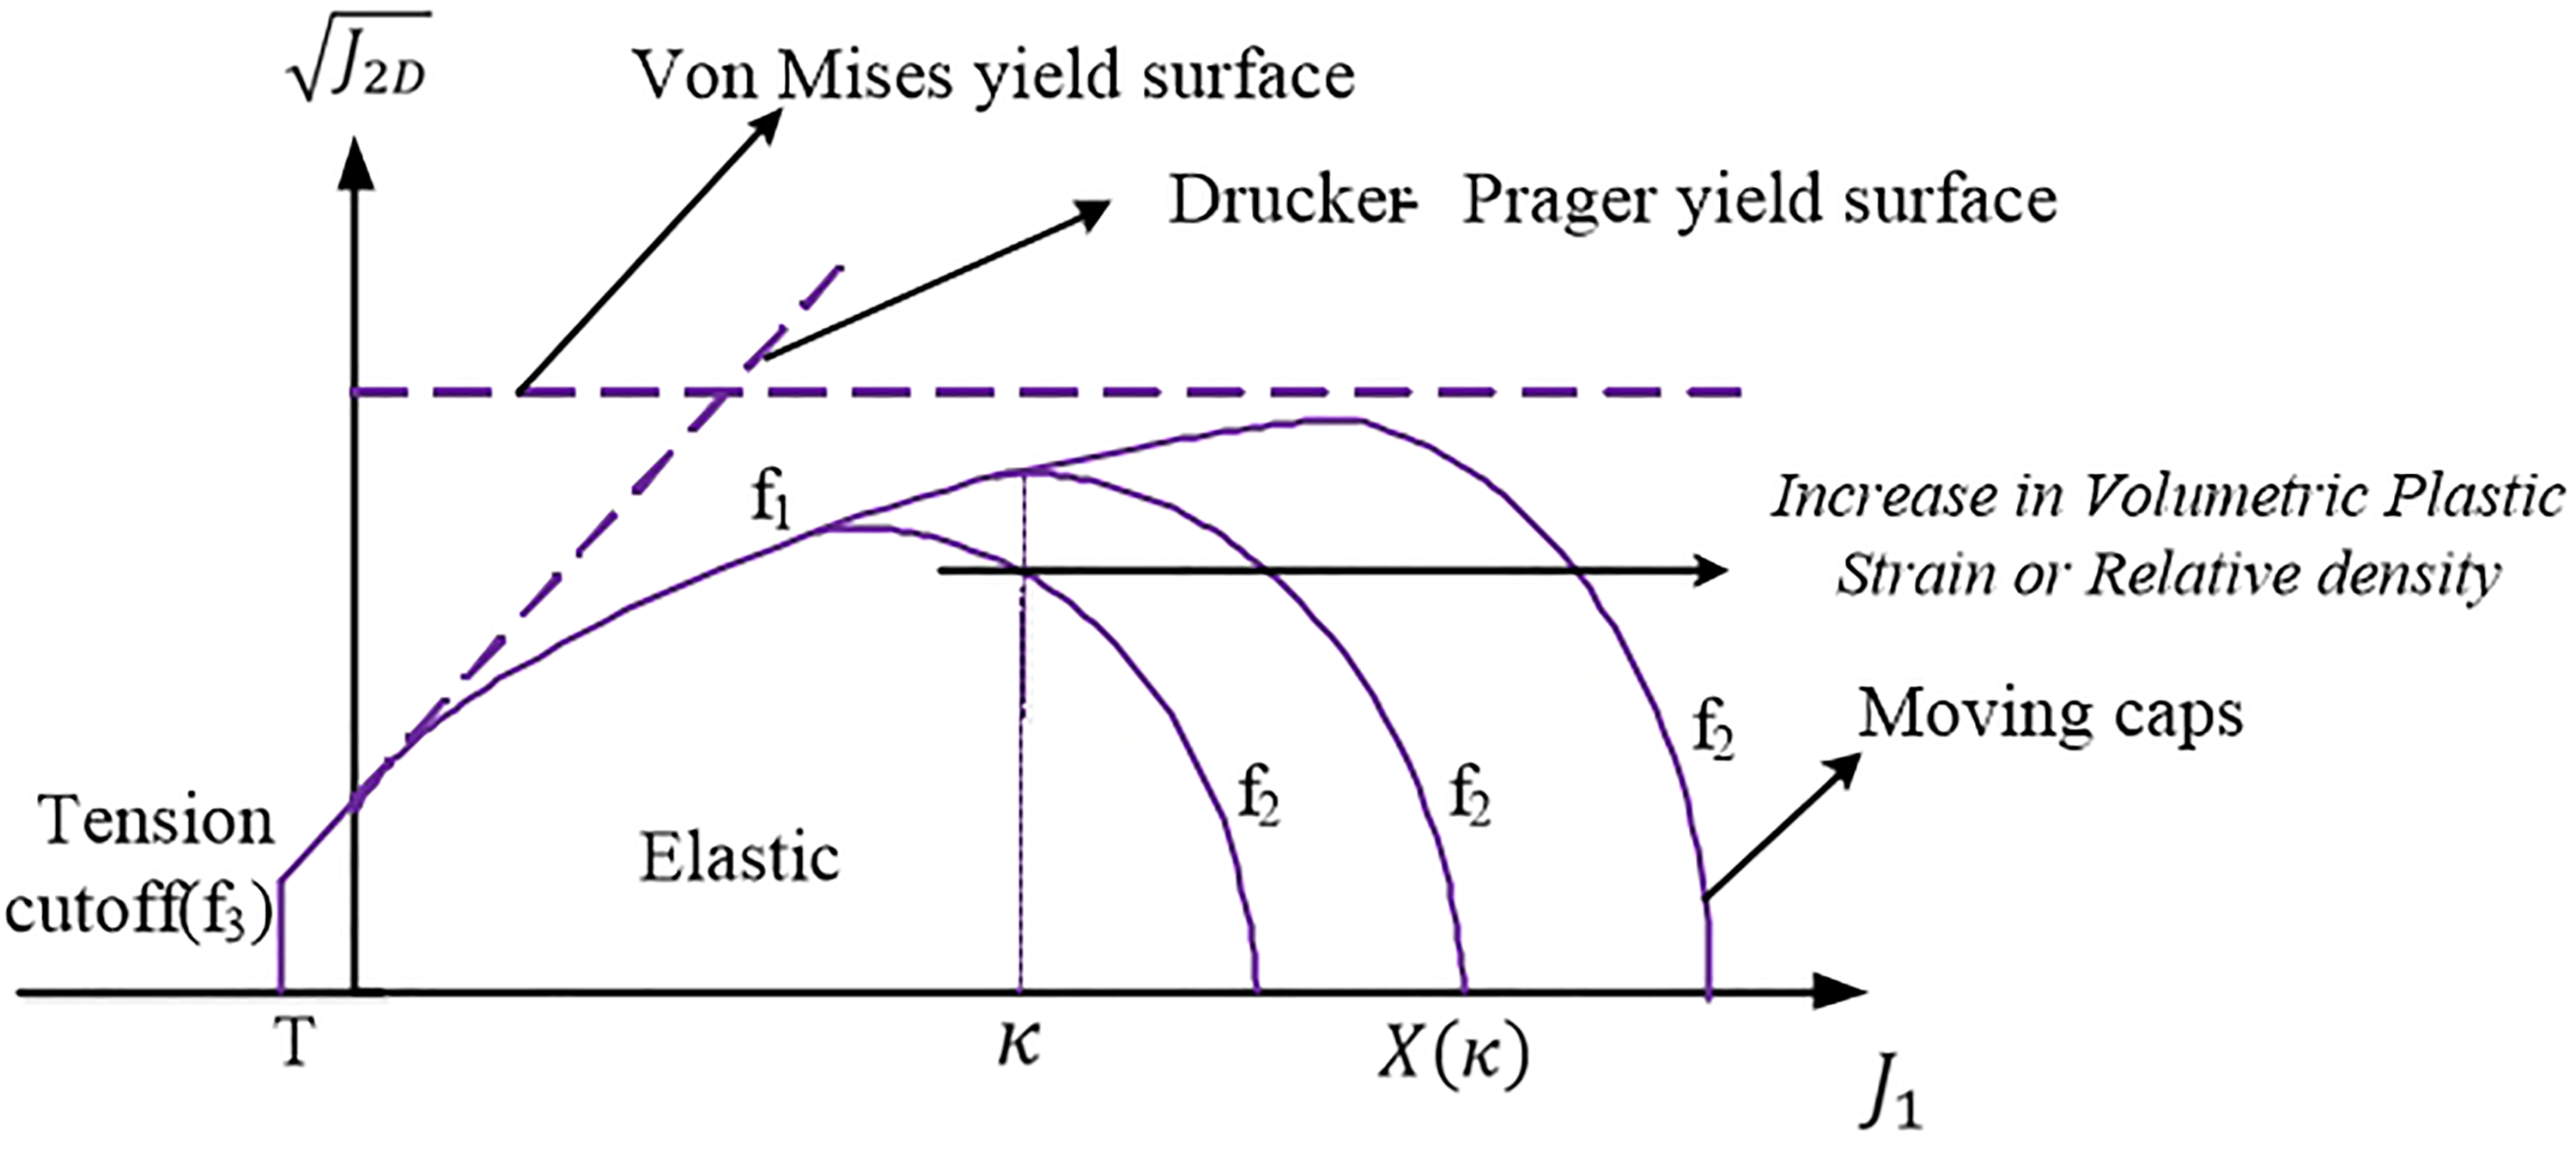
Constitutive model for powder compression.
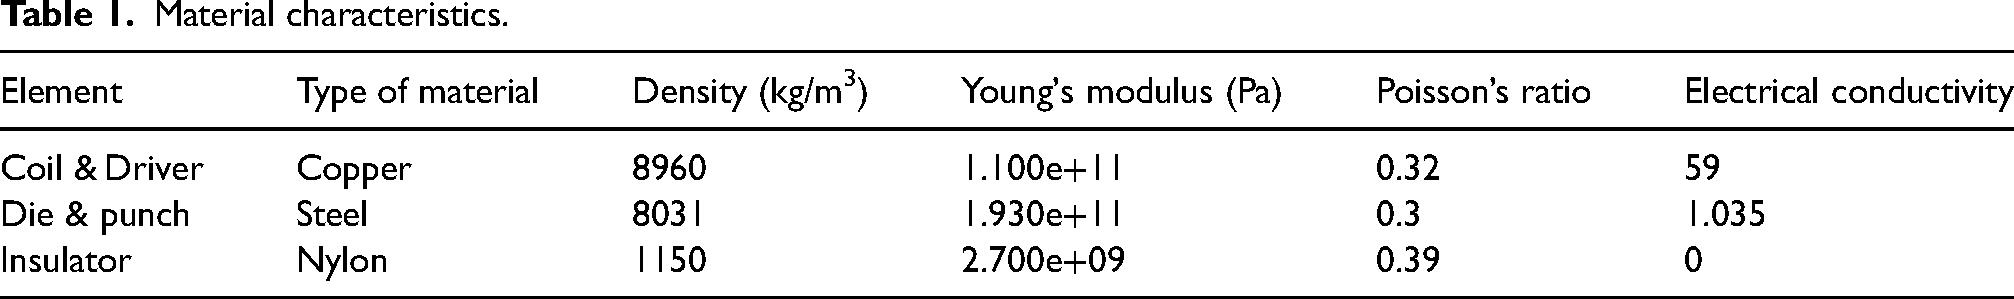
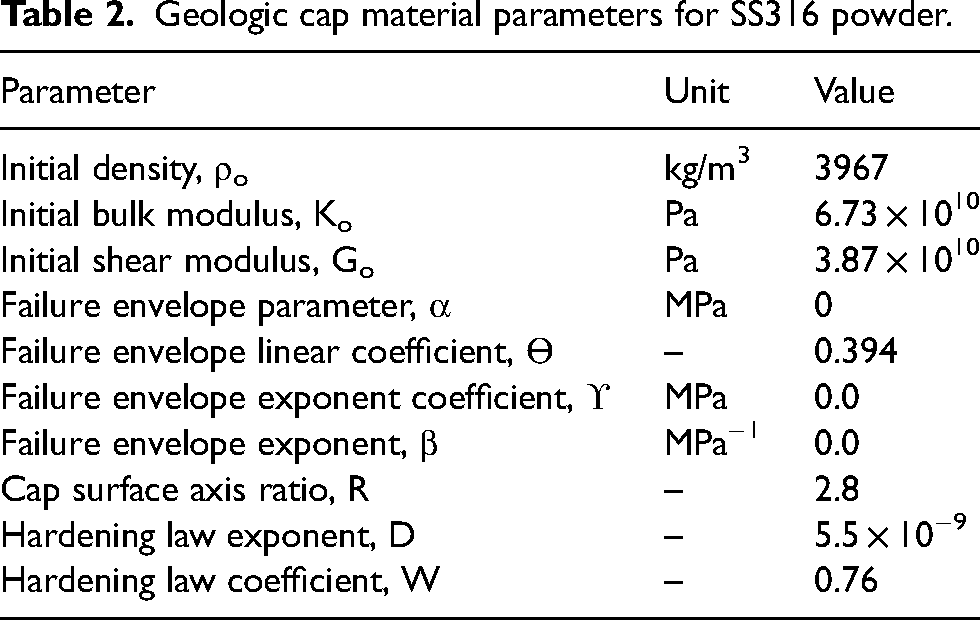
The EM compaction model consisted of a total of 93,784 solid elements. The SS316 powder body was modeled with an initial height of 5.72 mm, and the powder body used for simulation is meshed with 14,592 3D solid hexahedral elements and 12 layers. The powder body was modeled as SS316 material and assumed to be continuous. Except for the powder body, all other components were modeled as rigid bodies using solid elements. The coil and driver workpiece, typically conductive metal objects, were meshed using eight-node hexagonal elements with appropriate material properties. These elements must be conductive to allow for the flow of electric current. The coil that generates the EM field is typically represented as a coil of wire. Proper meshing of all components is chosen for the accuracy of the simulation. The coil mesh consists of five layers in the thickness direction with 15,000 3D solid hexahedral elements. Similarly, the driver plate is meshed with five layers in the thickness direction with 6080 3D solid hexahedral elements. The pancake coil was modeled as rigid copper with constrained 6 degrees of freedom (DOF). The driver plate was modeled as rigid copper provided with 1 DOF. The plunger component, basically acting as a force-transmitting medium, is meshed with 34,368 3D solid hexahedral elements. The punch, die, and spacer were modeled as rigid steel materials. The die used to shape the powder into a cylindrical sample is represented using 3D solid elements of 5120. Proper boundary conditions were given to simulate real-world behavior accurately, such as fixed nodes for the die surface at the bottom. The Geological cap material model was employed to explain the powder's deformation.13,14 The material characteristics employed in the numerical simulations are shown in Table 1. The geological cap parameters for SS316 material are shown in Table 2. Geologic cap models are often used to simulate the behavior of powder materials under applied loads. The cap model, formulated by DiMaggio and Sandler in 1971, is built upon classical plasticity theory.15,16 The geologic cap plasticity model incorporated the most realistic yield surfaces for powder materials under compaction. The model comprised three distinct surfaces represented as follows: a failure envelope (f1), a movable cap surface (f2), and a tension cut-off (f3) as depicted in Figure 3. Furthermore, Figure 3 visually demonstrates how the cap yield surface expands with increasing material density due to an increase in volumetric plastic strain.
Material characteristics.
Geologic cap material parameters for SS316 powder.
Equation (1) represents the fixed yield surface.
And, J1 = the first invariant (trace) of the stress tensor,
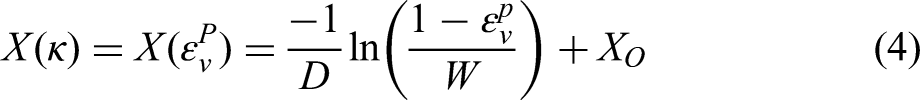
As the particles undergo severe deformation, they experience work hardening, which is captured by the concept of a moving cap. The moving hardening cap is mathematically represented by an elliptical function (f2), and the expansion of the yield cap in the stress space is governed by a hardening rule described by Equation (2).
R represents the cap surface axis ratio, which is the ratio of the two diameters of the elliptical cap, L and b are the points at which f1 and f2 intersect in the J1 and J1 and
Equation (3) represents the tension cut-off criterion, which is utilized to describe the material's hydrostatic tension limit.
The current curves used in the numerical simulations (shown in Figure 4) were measured experimentally using a Rogowski coil. Electric flow through the coil was modeled directly from the current curve via the in and out segments of the coil's terminals. LS-Dyna multi-physics solver permits the BEM and FEM matrices to be recalculated every 6 μs and updated to the mechanical solver in order to capture the effect of powder compression on the magnetic flux change. 17 The simulations were conducted for one full cycle time, or 392 μs, as the majority of deformation occurred during the first peak current.
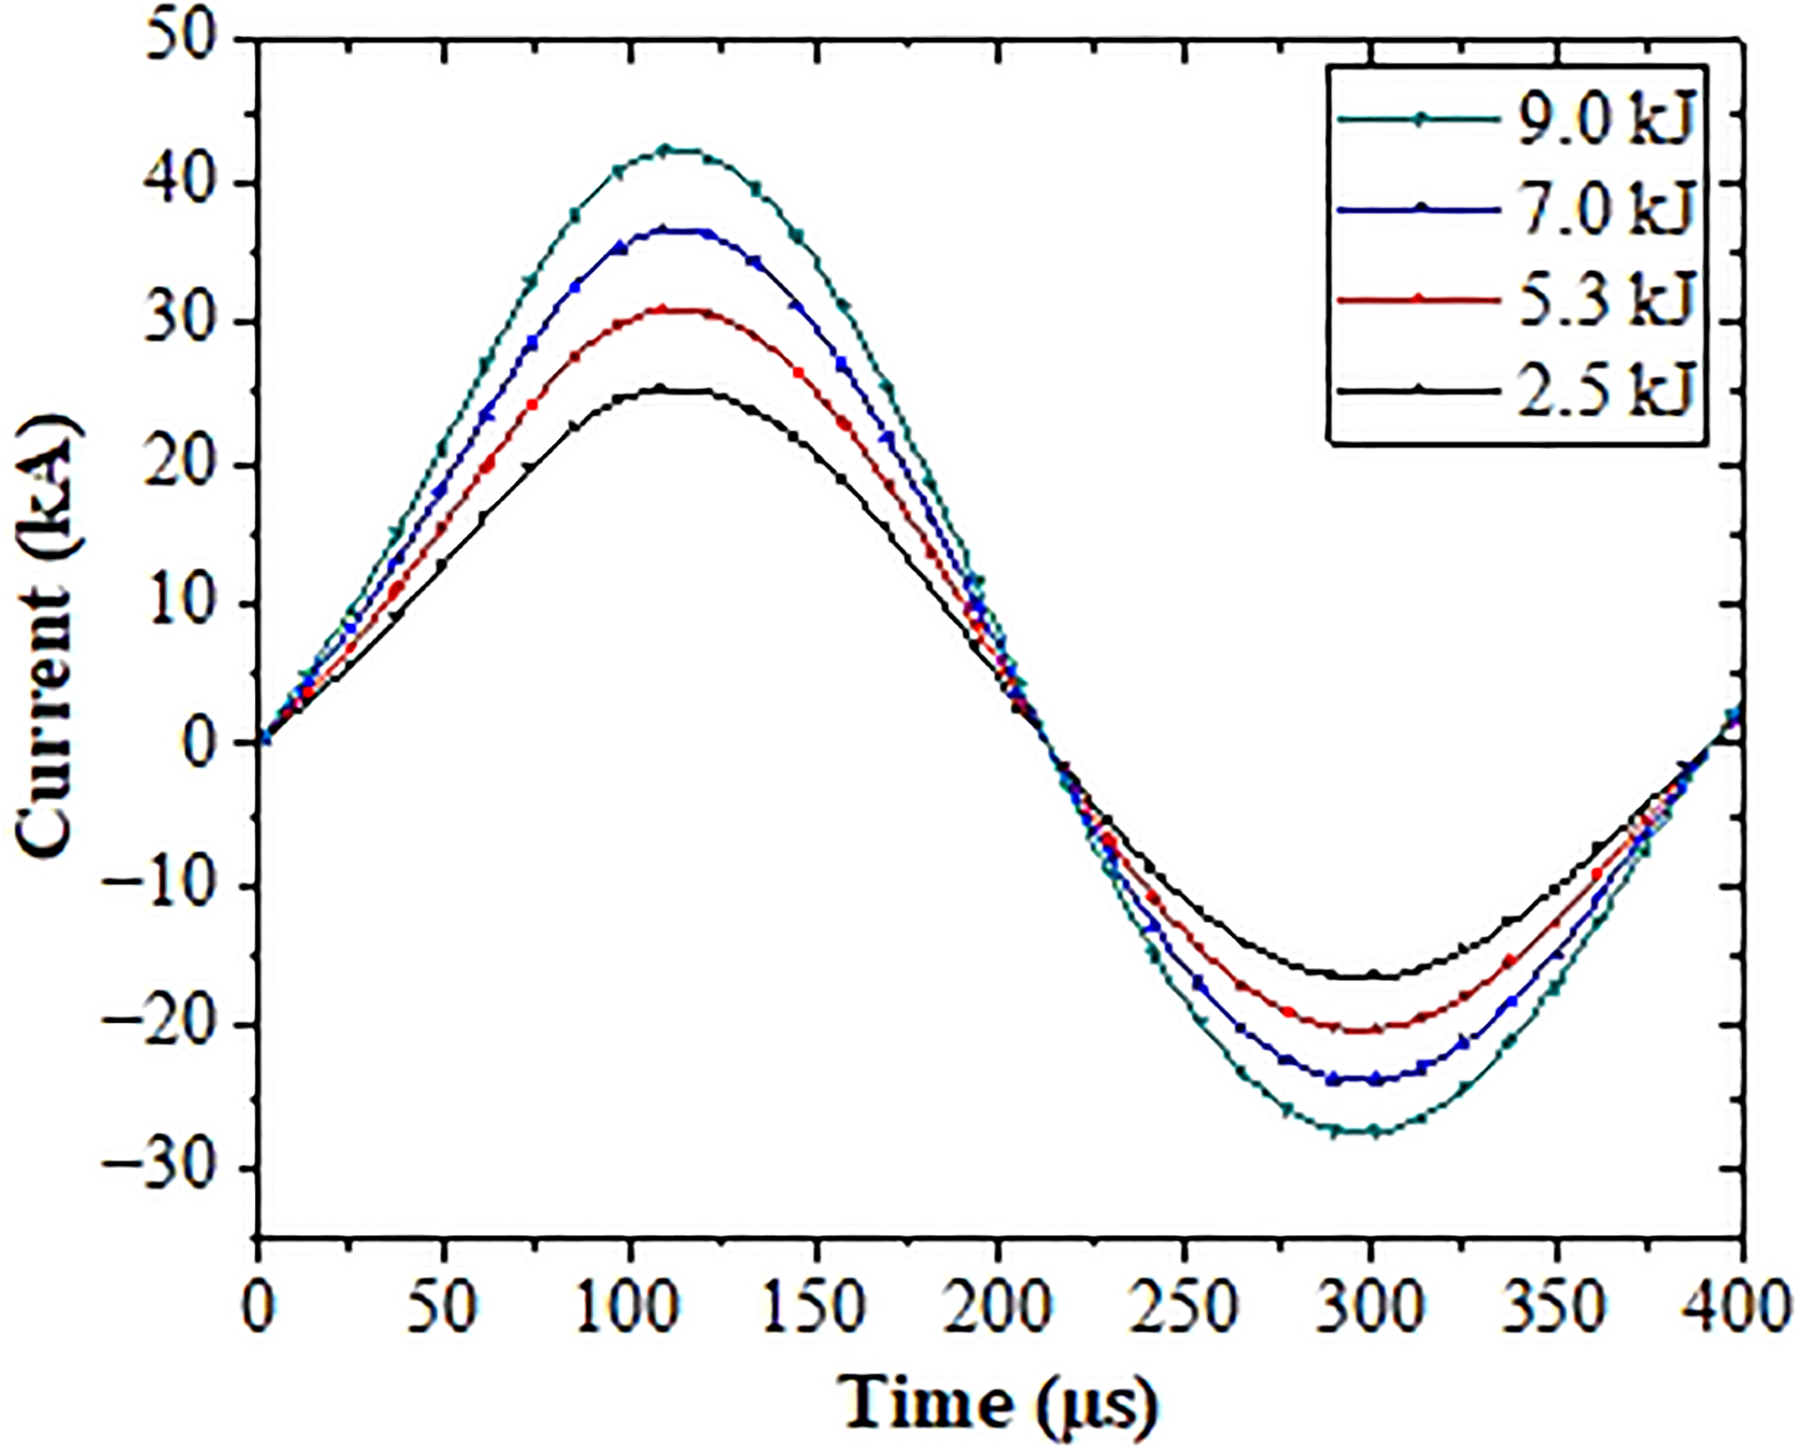
Current curves used in numerical simulation.
Materials used and experimental work
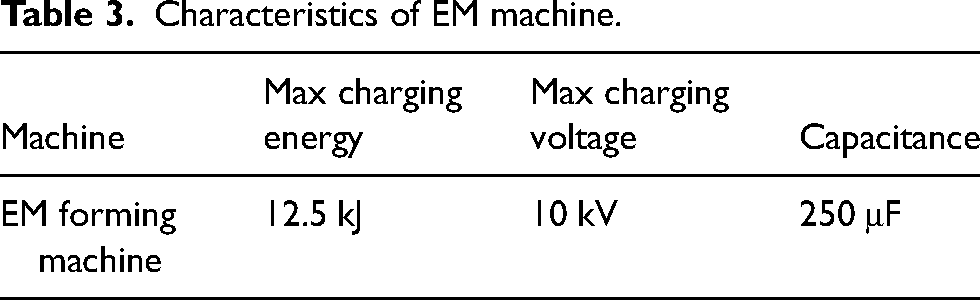
Experiments were conducted on a 10-kJ EM forming machine using discharge energies of 2.5, 5.3, 7, and 9 kJ to verify the numerical results. Table 3 shows the detailed specifications of the EM forming machine. Commercially available 98% pure SS316 powder with average particle size 0–50 μm was used as starting powder to study the EM axial powder compaction process. The density of SS316 used was 7.9 g/cm3. Different height samples with 13 mm diameter were produced at various discharge energies. The specimens were then sintered in the box-type furnace at 1375 °C for 2 h to provide sufficient strength to the sample for further post-processing operation. 11 Sintered specimens were vertically sectioned using WEDM to investigate the microstructure and bulk microhardness. Sectioned samples were mounted in thermoset material using hot mounting machine and polished using various grit size SiC papers followed by polishing with diamond paste (0–0.5 and 3–4 μ) on velvet cloth to achieve a mirror finish. Optical microscope was used to study the microstructure and porosity analysis. Vickers hardness was used for measuring the average microhardness at five distinct locations.
Characteristics of EM machine.
Results and discussion
Magnetic Flux Density and Lorentz Force Distribution
Figure 5 shows the magnetic flux density variation and Lorentz force variation on the driver plate with respect to time at various input currents. The highest magnetic flux density attained was 7.53 T after 117 μs at the maximum discharge current of 42.2 kA. After that, the magnetic field reduced to its minimum value due to reduction in the peak current. There was another rise in the magnetic field to the next maximum of 5.09 T at 311 μs. From Figure 5(a), it was observed that magnetic flux density increased with an increase in discharge current. The highest Lorentz force attained was 26 kN at 9 kJ, which produced highest deformation in the powder body. In the EM forming process, a small jump in the magnetic field at 200 μs may occur when the current is reversed. This tendency is due to several factors such as magnetic hysteresis, eddy current, magnetic circuit effect, and transient effects.
(a) Changes in the density of the magnetic flux density and Lorentz forces with time at various discharge energies.
Dynamics of SS316 powder body during EM axial powder compaction (EMAPC) process is shown in Figure 6(a). It was observed that significant deformation started at 130 μs with 0.1616 mm and increased to 1.917 mm at 390 μs at the expense of 9 kJ discharge energy. Figure 6(b) predicts the variation in the displacement of the elements at various layers in the axial directions. The top layer elements were subjected to higher displacements compared to other layer elements. This is because the top layer elements were close to the punch and received more compaction force. As the depth increases, the intensity of force wave propagation diminishes due to frictional forces with the walls and among the particles.
(a) Deformation in the powder at various times step in 9 kJ discharge energy and (b) displacement variation with time for various discharge energy.
Figure 7 depicts the variation of the von Mises stress in the powder body at various compaction discharge energies. It was observed that the top surface edge elements were subjected to higher stresses. Axial and radial stress gradients were observed in the powder body. As the discharge energy increased, the amount of compaction load increased, resulting in increased stresses. As the energy consumed was layer by layer, this resulted in differences in the von Mises stress values at the upper and lower surface layers.
Von-misses stress distribution in the powder body at various discharge energies.
Physical map of the compacted samples
The physical appearance of SS 316 powder compacted samples prepared at various discharge energies using EM axial powder compression method were given in Figure 8. The final heights of the samples were measured using Vernier calipers. Minimum height of 4 mm sample was obtained at 9 kJ, which resulted in the highest green density of 5654 kg/m3 and sintered density of 5774 kg/m3. The increase in discharge energy led to an increase in both the green density and the sintered density of the SS316 powder. The results of the simulation and the experiments were compared, and the findings are presented in Figure 9(b).
Physical appearance of SS316 powder compacted samples.
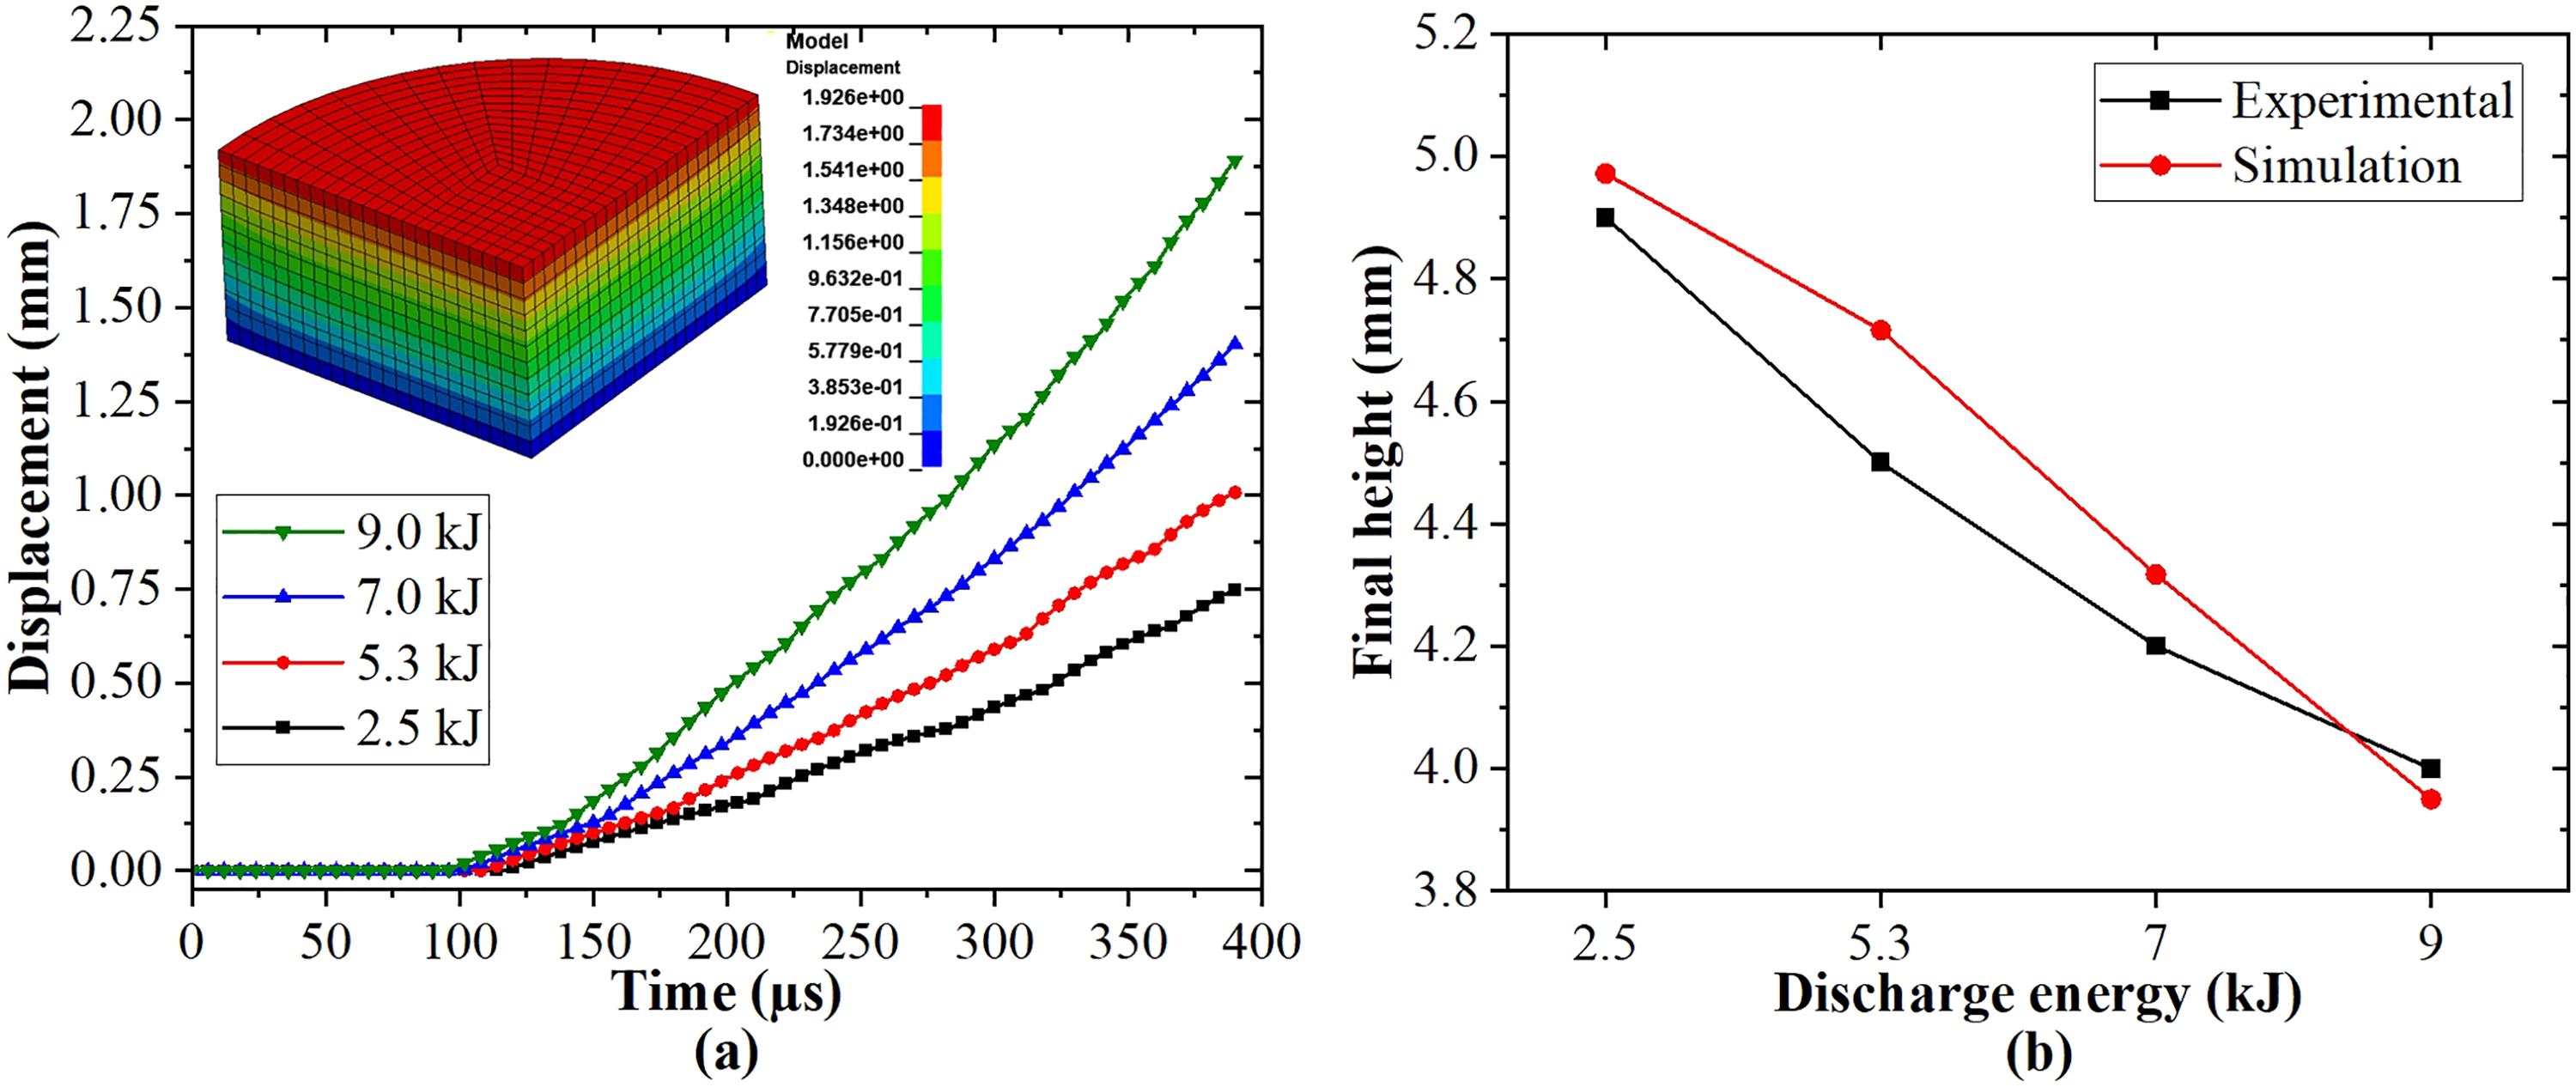
(a) Variation of displacement of powder with time at different discharge energy (b) final height comparison between simulation and experiments results.
Powder body deformation at various discharge energy is shown in Figure 9(a). The final height of the powder body was observed to decrease with increase of input current, that is, discharge energy. The experimental results were in accordance with simulations results. In essence, the differences in curve shapes shown in Figure 9(b) could indicate variations in the underlying assumptions of the material model compared to the real-world experimental conditions. The disparities between simulation and experimental results in EM powder compaction occur due to differences in material properties, the experimental setup, geometry variations, process conditions, model complexity, uncertainty in material behavior, and environmental factors.
Density analysis
After removing the compact from the die, the final dimensions of the sample were measured with the help of Vernier calipers. Using the following equation, with the help of initial weight of SS316 powder, the green density of the specimen was measured.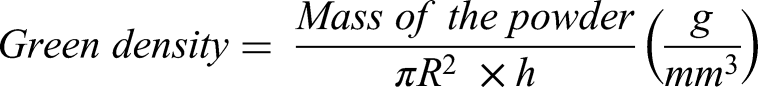
Using the Archimedes principle, the sample's sintered density was determined. The rearrangement of powder particles consumed up to 5.3 kJ of discharge energy, resulting in poor packing density. Powder compaction increased as discharge energy increased. Due to the increase in particle contact area caused by an increase in discharge energy, significant densification was attained. From Figure 10(a), it was concluded that an increase in discharge energy resulted in increase in green density as well as in sintered density. The highest sintered density was found to be 5774 kg/m3 at the highest discharge energy of 9 kJ.
As the discharge energy increase in the EM powder compaction method, it not only results in increased density and reduce porosity but also activates a range of mechanisms for particle rearrangement. These mechanisms encompass particle redistribution, plastic deformation, inter-particle friction, and mechanical interlocking. With the increasing compaction energy, a redistribution of particles within the powder body becomes evident. Initially, loosely arranged or clustered particles tend to disperse more evenly, enhancing the overall packing density. This reshuffling is of great significance in attaining a more uniform structure in the final compacted component.
With the increase of compaction forces, the particles undergo plastic deformation and repositioning, resulting in a variety of interlocking mechanisms arising. These mechanisms comprise mechanical interlocking, where irregularities in the particles mesh together, and metallurgical interlocking, involving localized diffusion bonding at contact points. These interlocking mechanisms augment the overall strength and stability of the compacted sample. Moreover, alongside particle deformation, some metal particles may experience plastic flow. This entails the particles moving over one another, accommodating the reduction in volume as the powder is compacted. This contributes to an overall densification of the powder. The rate of densification also accelerates with the increasing compaction energy. Initially, the swift reduction in porosity and particle rearrangement lead to a rapid surge in green density. As the compaction energy continues to rise, achieving further densification becomes more gradual, owing to the growing challenge of packing the remaining voids tightly. A comprehensive understanding of these processes is imperative for optimizing the powder metallurgy procedure and attaining the desired properties in the final product.
Microhardness and microstructure analysis
Vickers microhardness tests were carried out to determine the bulk hardness of sintered SS316 compacts prepared using EMAPC. In materials testing, including hardness testing using the Vickers hardness method, it is essential to measure the hardness through the section where the compact has been cut rather than just on the top and bottom surfaces. The Vickers hardness test provides a measure of hardness based on the indentation's diagonal lengths. By measuring the hardness through the section, a volume-averaged hardness value is obtained. This is important because the properties of the material can vary within the interior, and a single measurement at the surface may not represent the true hardness of the entire specimen. Measuring through the section accounts for this variation.
The value of microhardness was calculated as the average of the results of five readings taken at various location in the vertical cross-section of the compact. Figure 10(b) shows Vickers microhardness variation at different compaction energies. The value of bulk hardness was significantly lower at low discharge energy (2.5 kJ). From microstructure analysis, it was confirmed that at low discharge energy, pores were formed in the form of large voids with irregular sizes, as shown in Figure 11(a). Thus, hardness reduced as a result of the development of a stress concentration center at the void locations. The microhardness increased with increase of the discharge energy. Porosity decreased as compaction discharge energy increased. It is evident from Figure 11(d) that the pores were fewer and smaller corresponding to 9 kJ discharge energy sample. As a result, there were no stress concentration zones, which thereby increased the hardness.
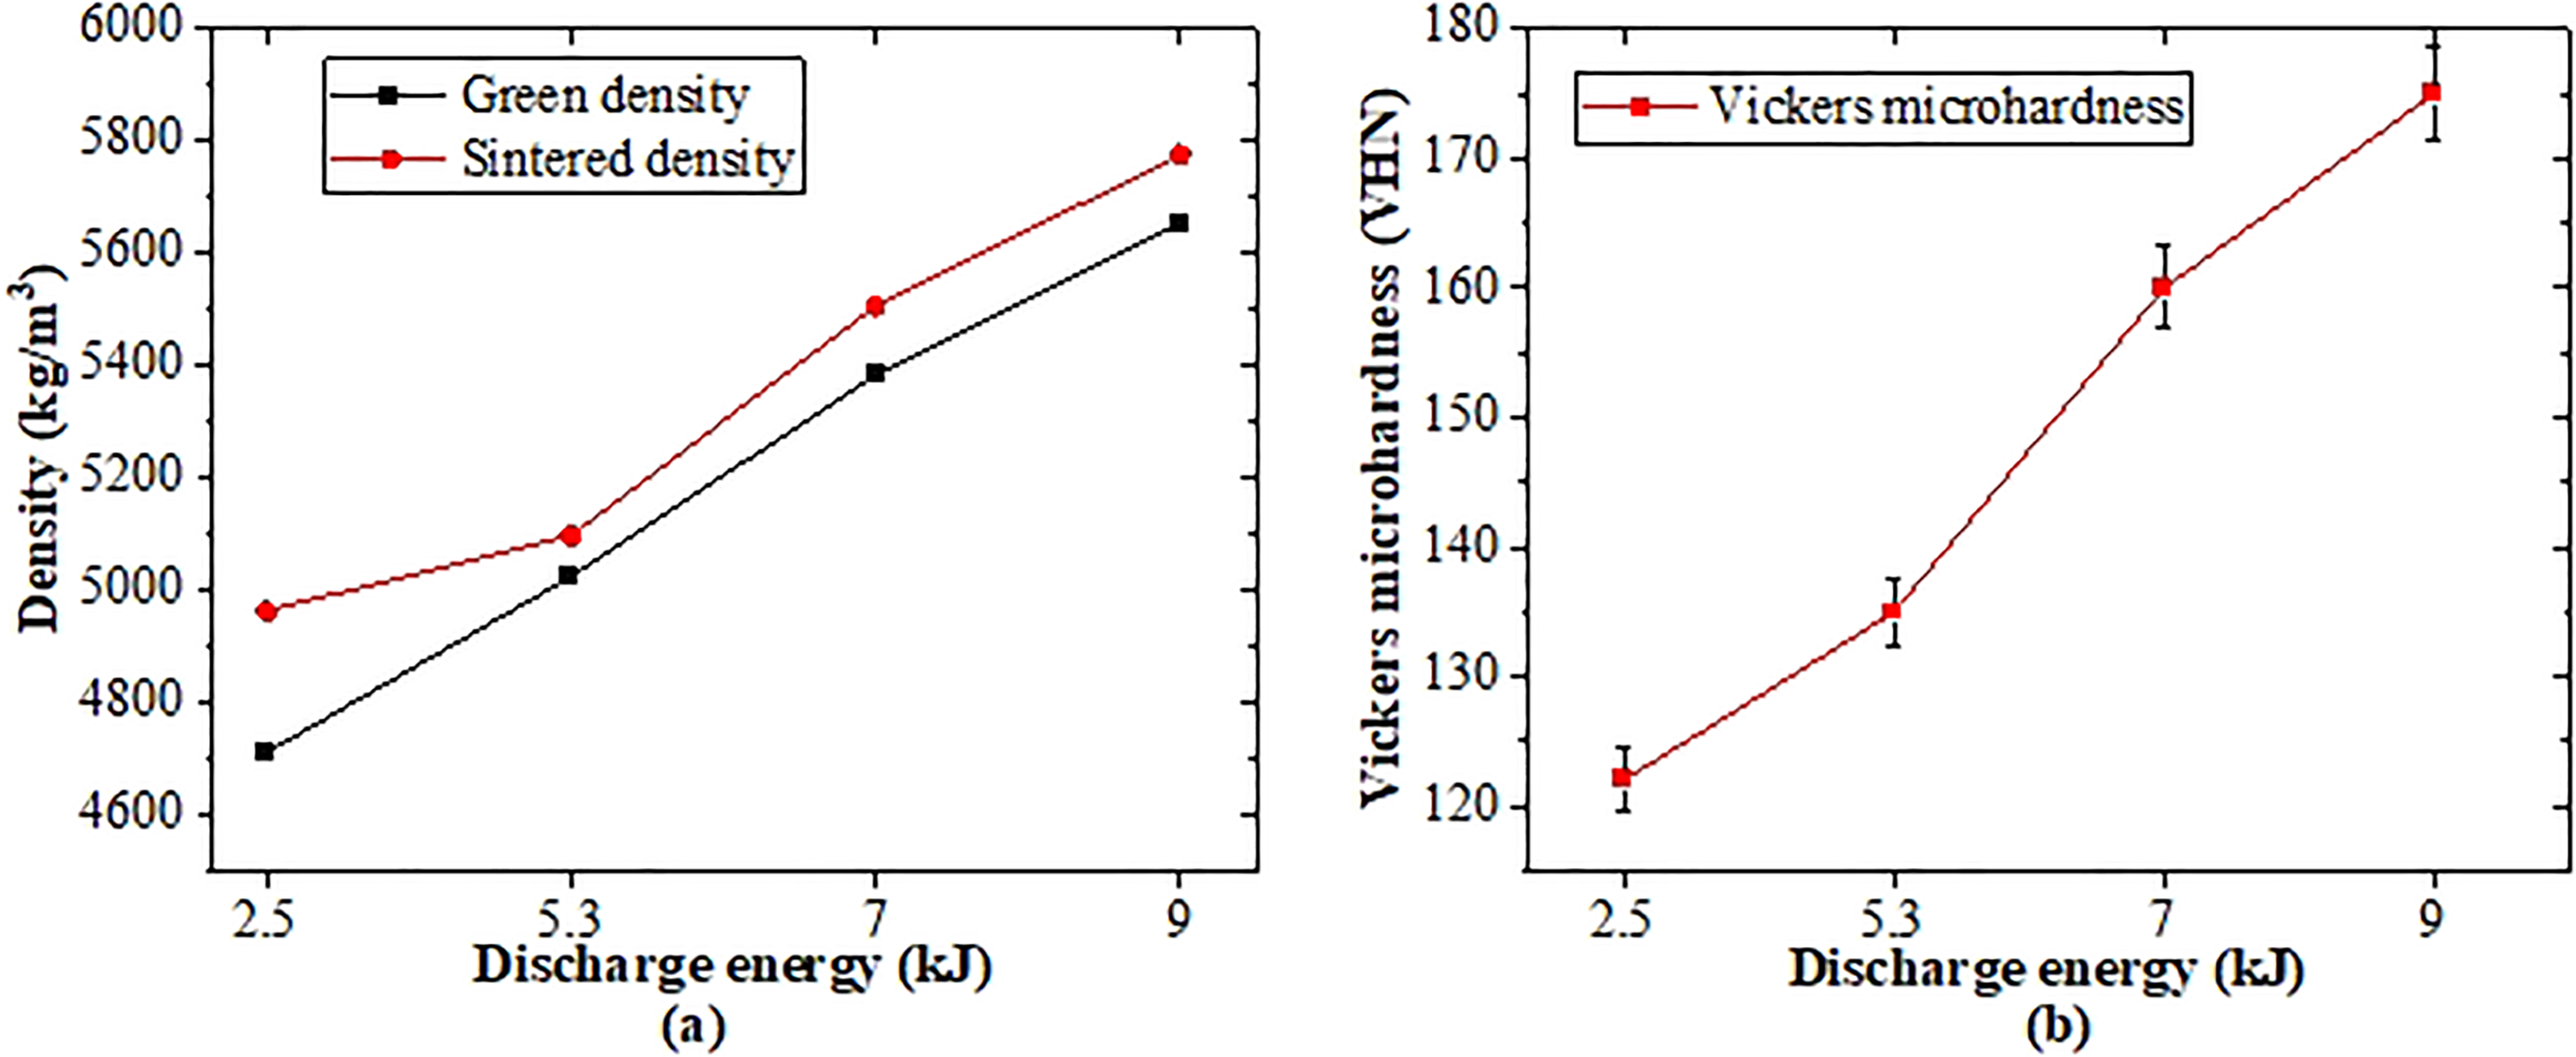
(a) Density variation and (b) Vickers microhardness variation of SS316 powder compacts with discharge energy.
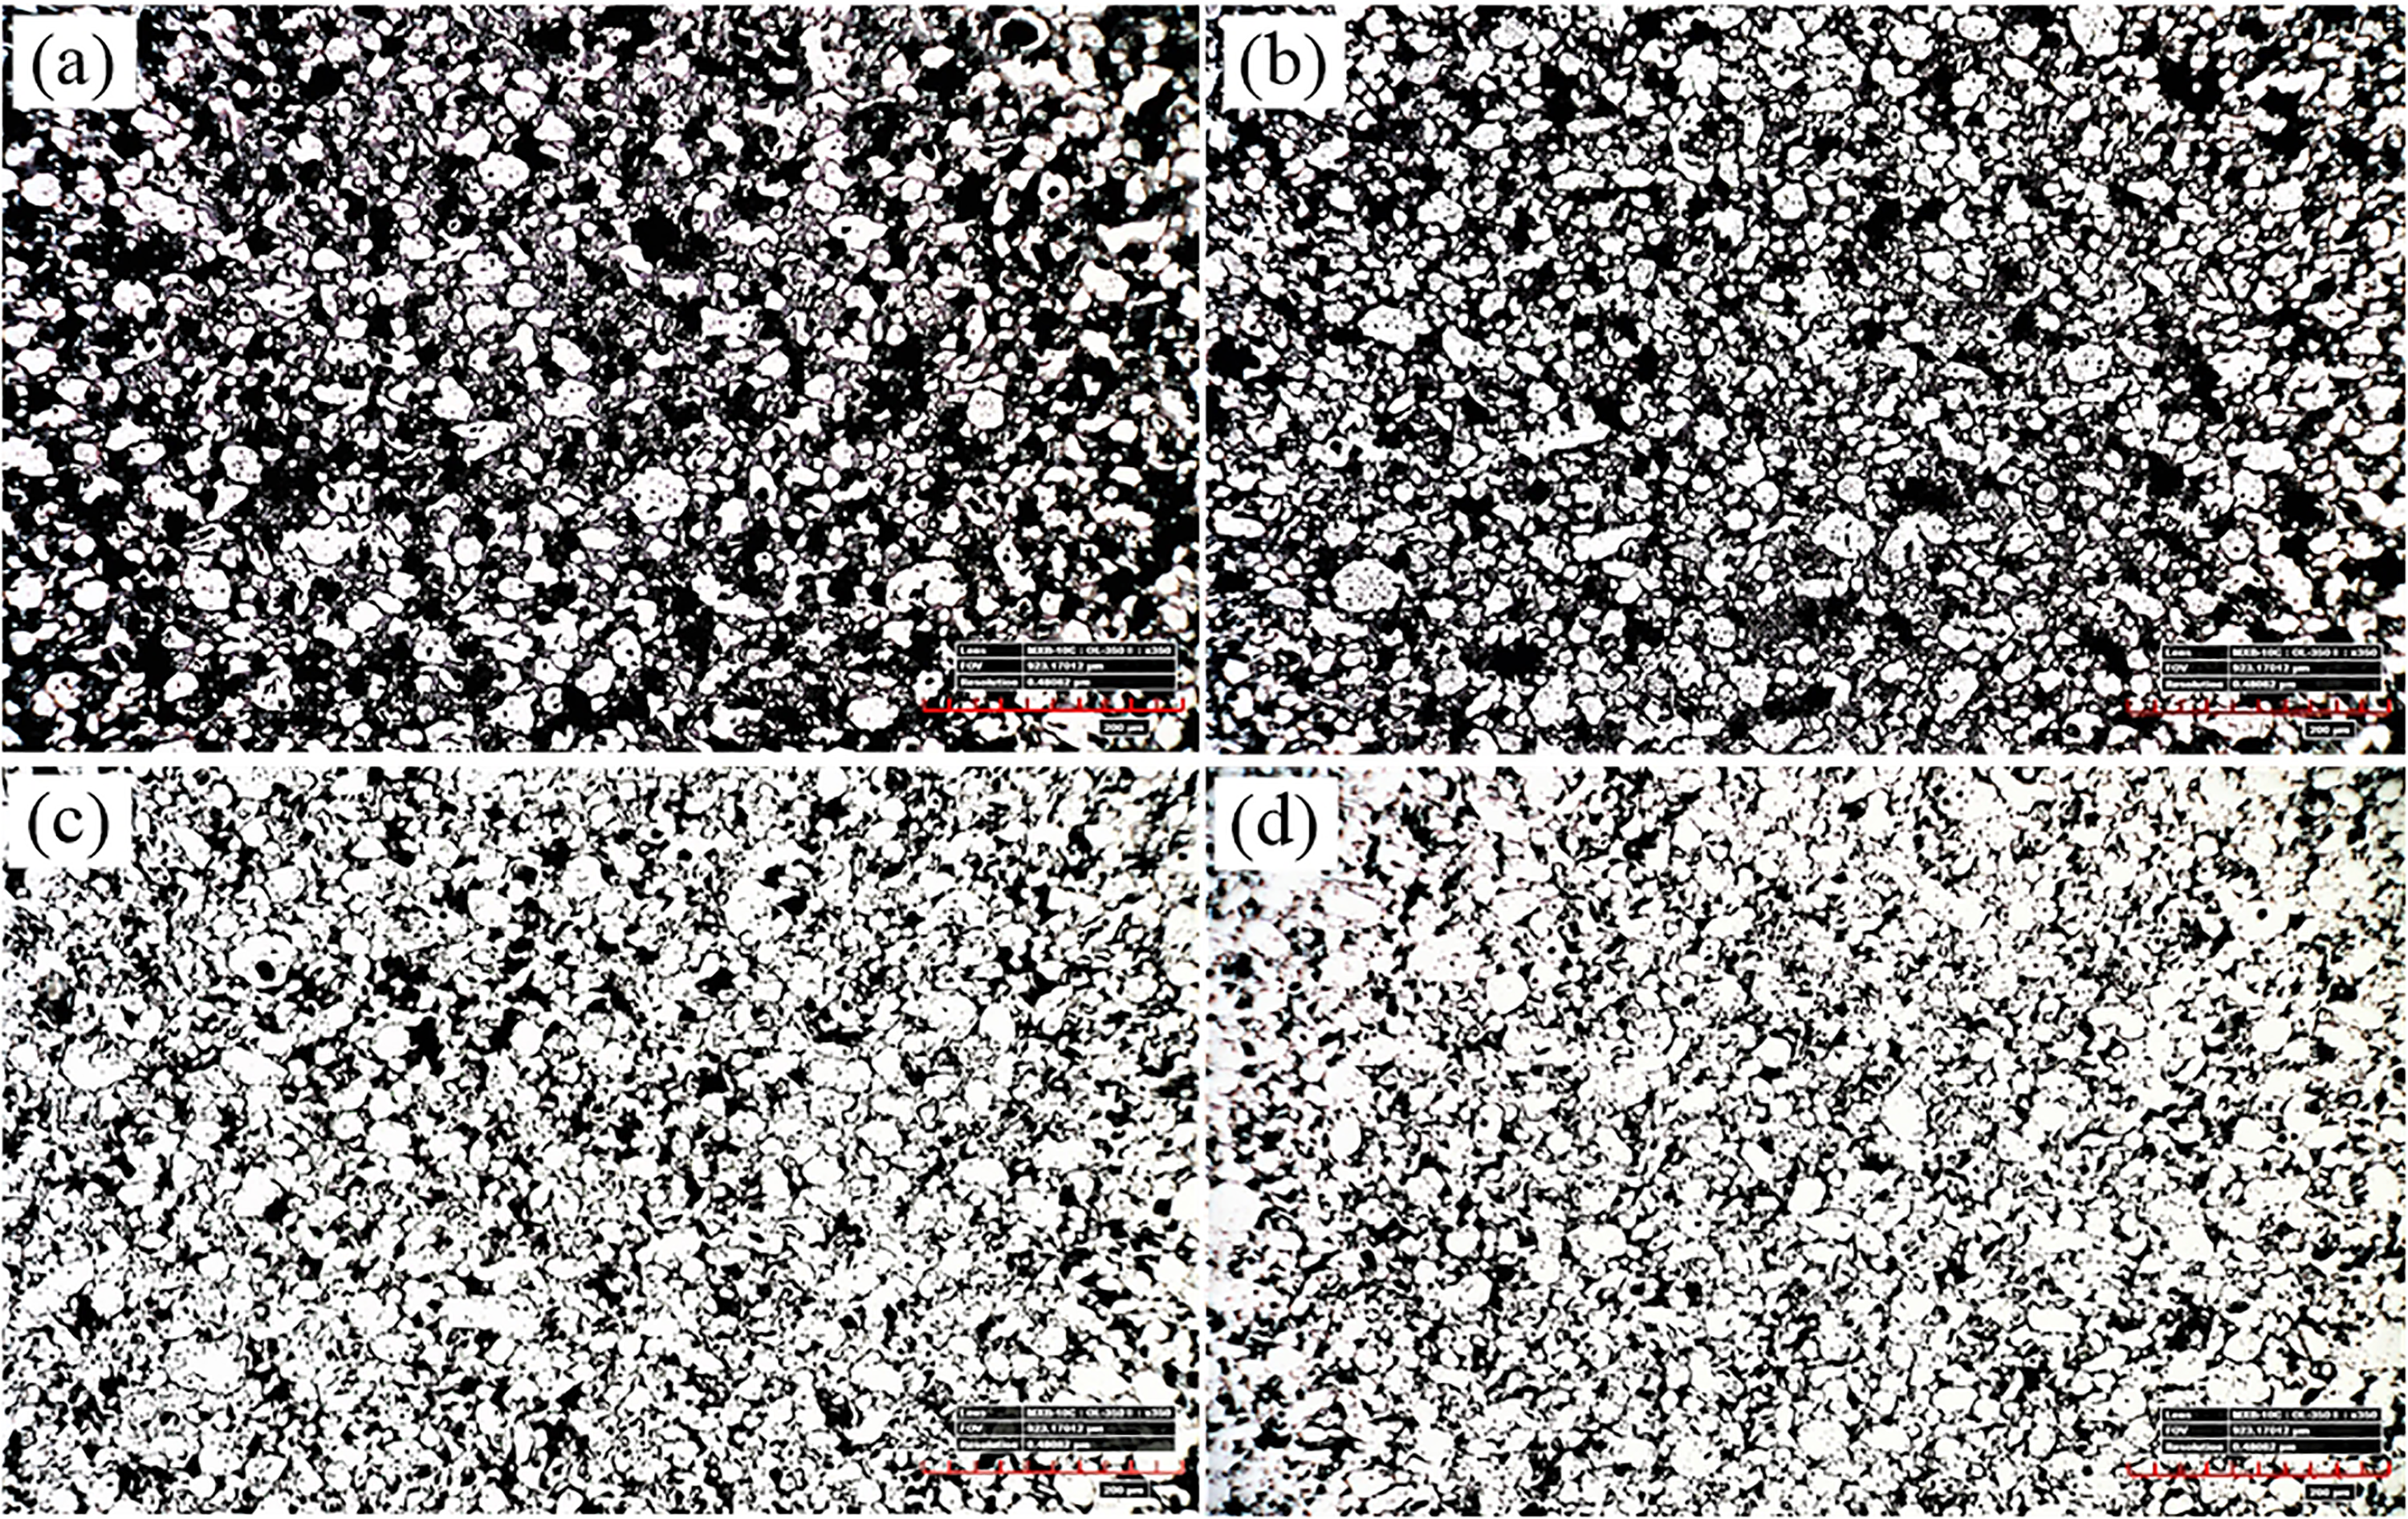
Optical microstructure analysis of SS316 compacts at (a) 2.5, (b) 5.3, (c) 7, and (d) 9 kJ.
The discharge energy of 9 kJ corresponded to the highest amount of hardness that could be achieved. Bonds between the particles increased, which resulted in increase of density and hardness as the discharge energy increased. The porosity distribution and porosity percentage were measured using ImageJ software. The porosity distribution with threshold images is shown in Figure 12. The highest porosity of 36.9% and lowest porosity of 25.3% were obtained at 2.5 and 9.0 kJ discharge energy. The density and porosity are primarily influenced by the discharge energy. As the discharge energy rises, the Lorentz forces also experience an increase, leading to a higher impact force during powder compaction, thus powder density increases. Powder compacts of SS 316 with low porosity are particularly appealing for biomedical application. In this process, by adjusting the initial charge voltage in the capacitor bank, it is possible to control the process as per the specific application needs with desired porosity levels.
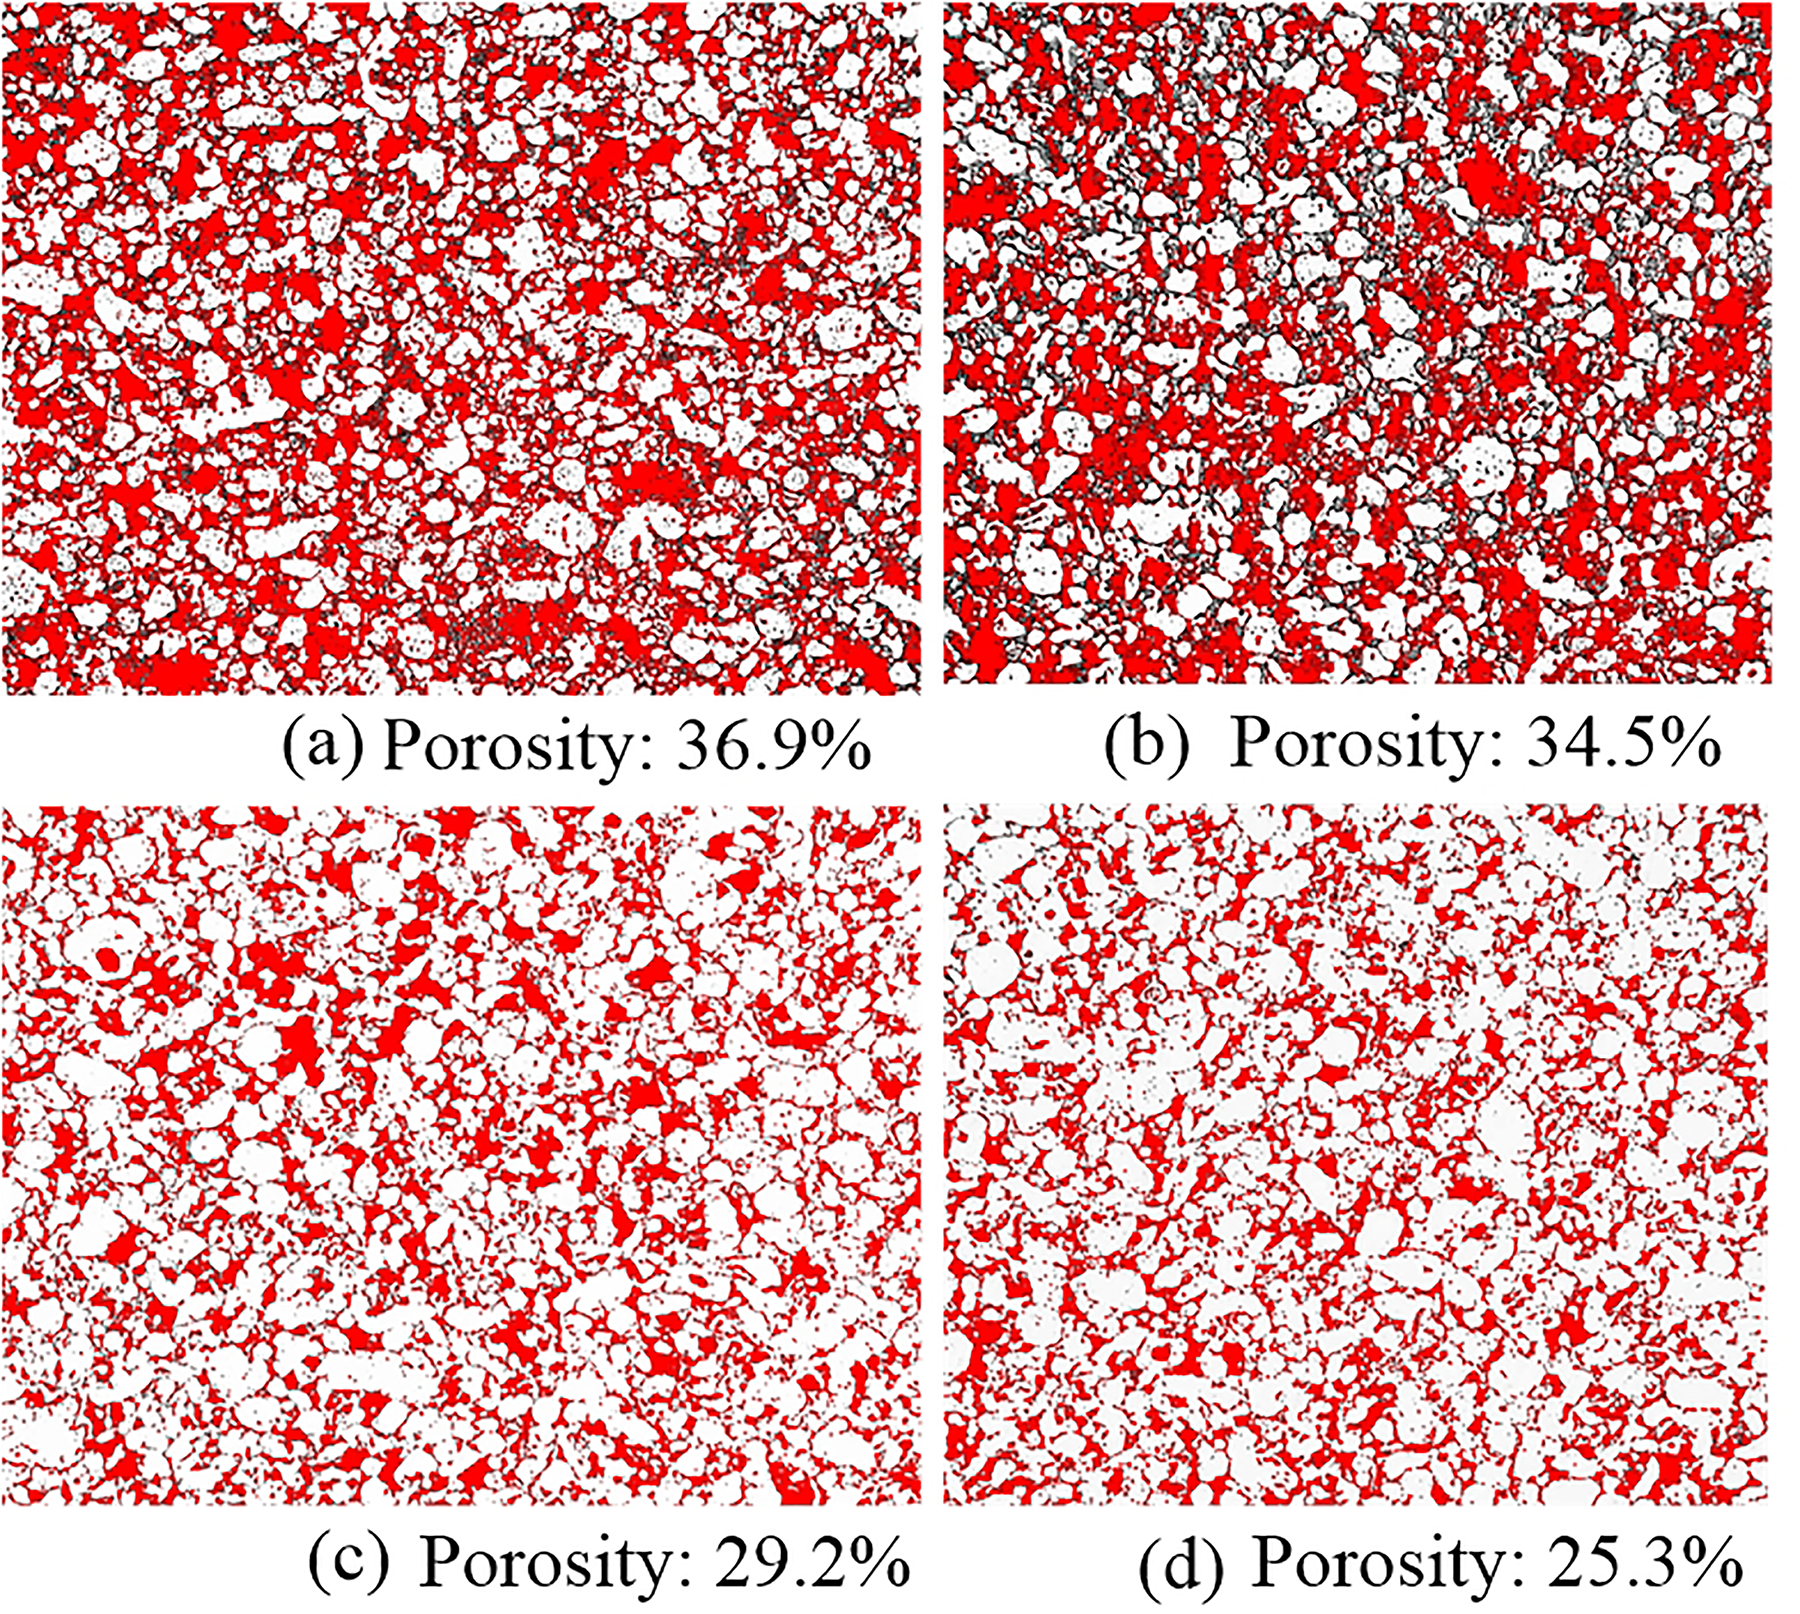
Porosity distribution in SS 316 compacted samples at (a) 2.5, (b) 5.3, (c) 7, and (d) 9 kJ.
Conclusions
In conclusion, the EMAPC of SS316 has been thoroughly studied through a combination of experiments and strongly coupled simulations using LS-DYNA software. Several key findings and remarks can be summarized from this investigation:
The simulation model can predict parameters that are hard to measure in experiments, such as displacements of the powder, stress distributions in the powder body, magnetic field density, and Lorentz forces distribution in the coil/driver material. Magnetic flux density and Lorentz forces increased with increase of input energy. The simulations showed that the discharge energy was used up layer by layer during the powder compaction process. The axial deformations of the powder body predicted by simulations were compared to the results of the experiments and found to be reasonably consistent. EM axial powder compaction was successfully used to produce SS316 cylindrical samples without cracks. The discharge energy is directly related to the intensity of the EM forces generated during the compaction process. As discharge energy increases, the magnetic field strength and Lorentz forces acting on the driving plate also increase. Consequently, higher discharge energy leads to greater compression forces applied to the powder. Higher discharge energy typically results in greater compaction of the powder. This can lead to increased powder density within the compacted part. In applications where achieving a specific density is crucial, adjusting the discharge energy can be a way to control the compaction level. The discharge energy can influence the speed at which the powder is compacted. Higher discharge energy may lead to faster compaction rates, which can be advantageous for high-volume manufacturing processes. Careful control of the discharge energy is essential to ensure the uniformity and quality of the compacted part. Inconsistent or excessive discharge energy can lead to uneven compaction, defects, and material waste. The compaction discharge energy influenced the microstructures, physical, and mechanical properties of the samples. Optical microstructure results showed that pore clusters and voids evolved in the material under lower compaction force at low discharge energy; however, as the discharge energy was increased, bigger voids were replaced by smaller pores. The increasing discharge energy resulted in an increase in the bulk density, a decrease in the apparent porosity, as well as an increase in the Vickers microhardness.
Footnotes
Acknowledgments
The authors sincerely thank the Indian Institute of Technology Goa for their support in carrying out this research work.
Declaration of conflicting interests
The authors declared no potential conflicts of interest with respect to the research, authorship, and/or publication of this article.
Funding
The authors received no financial support for the research, authorship, and/or publication of this article.