
Abstract
To what extent and through which means do private actors shape public policy? Research into these questions has been complicated by actors’ tendency to obscure or misrepresent their policy preferences and by the difficulty of operationalizing policy substance. This theory-building study uses qualitative methods and triangulation of multiple sources of evidence to mitigate these challenges. Confronted with puzzling patterns of variation in the design of state-level climate and renewable energy policies, I show how a two-dimensional framework attentive to the economically motivated preferences of business actors explains policy design. Drawing on policy texts, archival documents, and 111 policy-focused interviews, I find business preferences were fragmented, but that a single type of private actor, investor-owned utilities, ultimately prevailed in achieving their preferences in every case. I theorize the sources of their unmatched influence, and find that their distinctiveness is precisely what makes them powerful. My findings have implications for the study of business power and understanding obstacles to equitable climate policymaking.
To what extent and through which means do private interests shape public policy? These are persistent questions in political science and political sociology. 1 Yet research into these questions faces at least two challenges. First, business actors can strategically obscure or misrepresent their true policy preferences, making it difficult for researchers to accurately assess whether policy conformed to them. 2 Second, there is the challenge of operationalizing the substance of policy itself, given its many cross-cutting provisions and effects, playing out both short-term and long-term. 3 Overcoming both challenges is necessary to determine the all-important question of influence: who got how much of what they wanted from a given policy, and at whose expense? 4
In this article, I show how these challenges can limit our understanding of how state-level climate and renewable energy policies are designed and implemented, but I also show how they can be overcome through a policy-focused and preference-focused two-dimensional framework of analysis. I first identify the puzzling aspects of variation and uniformity in the design of two policy types: economy-wide greenhouse gas (GHG) policies, which aim to cap a state's total GHG emissions at specified levels, and renewable portfolio standards (RPS) policies, which require that specified percentages of a state's electricity load be generated from specified renewable sources, according to specified timelines. 5
I show how we cannot fully understand substantive design choices among these policies without making two conceptual and analytical moves: (1) identifying the “true preferences” 6 of the business actors with a stake in how these policies are designed and (2) reconceptualizing policy outcomes to be two-dimensional, so we are no longer trying to assess whether a policy in its totality is a “win” for one interest group or another but rather looking at each substantive provision in terms of its distributive effects. 7 This is important since a single law often resembles a “Christmas tree,” with different “ornaments” added on account of different stakeholders. 8 In thinking about climate policy particularly, it is important not only to assess policy design in terms of environmental strength but also in terms of who pays; that is, how are the short-term costs of the transition to a clean energy economy distributed among stakeholders? 9
In what follows, I examine three states that have adopted both GHG and RPS policies. They are the three that Selin and VanDeever name as climate policy leaders among the fifty: California, Massachusetts, and Oregon. 10 All have adopted the full menu of policy tools that the literature frequently discusses: GHG policies, RPS policies, net metering, public benefit funds, climate action plans, and so on. 11 I show how these states’ GHG and RPS policies vary and converge in their design.
When it comes to the GHG policies, they vary in terms of their environmental strength, with California's being stronger than Massachusetts's and Massachusetts's being stronger than Oregon's. When it comes to the RPS policies, they are all similar in terms of who pays; while each has its own distinct provisions, one type of business actor, investor-owned utilities (IOUs), never pays, while costs/risks are consistently shifted onto electricity consumers of all kinds—households and corporations. I review what the relevant literature has to say about why this is the case and find no satisfying answer. I argue that the literature's shortcomings are due to both the “problem of preferences” and the unidimensional conceptualization of the policy outcomes. 12
I then devise a method to mitigate the problem of preferences and to determine the “true” preferences of the business actors with a stake in these policies’ design. I also reconceptualize the policy outcomes to be two-dimensional, considering both environmental strength and the question of who pays. In doing so, I follow Mildenberger's approach of “disaggregate[ing] policy content” and providing a “distributive-institutional account of climate politics.” 13 Applying my framework to the two policies in the three states, the sources of variation and uniformity become clear.
The GHG policies vary in environmental strength because the true preferences of IOUs varied, as did their level of mobilization in pursuit of those preferences. The RPS policies exhibit similar distributive qualities because IOUs in all three states did not care about the environmental strength of the policies, but rather, about who would pay for them; specifically, IOUs wanted to ensure that they would not pay. What emerges from this analysis is that IOUs are unique among corporate actors in the climate policy space, both in terms of the more sophisticated bases of their preferences and their ability to achieve their preferences in policy design. I conclude by exploring why IOUs are so influential, drawing on the literature on regulatory capture, and how this new way of thinking about business preferences and power might be applied elsewhere.
Empirical Background and Puzzle
For decades prior to the recent enactment of the Inflation Reduction Act, the US federal government took a hands-off approach to climate change. 14 Instead, many states took matters into their own hands, acting as “laboratories of democracy,” as Justice Brandeis famously envisioned. The two most significant and prevalent state-level policy instruments are GHG policies (adopted by twenty-three states) and RPS policies (adopted by thirty-seven states). 15 However, these policies differ across the states that have adopted them.
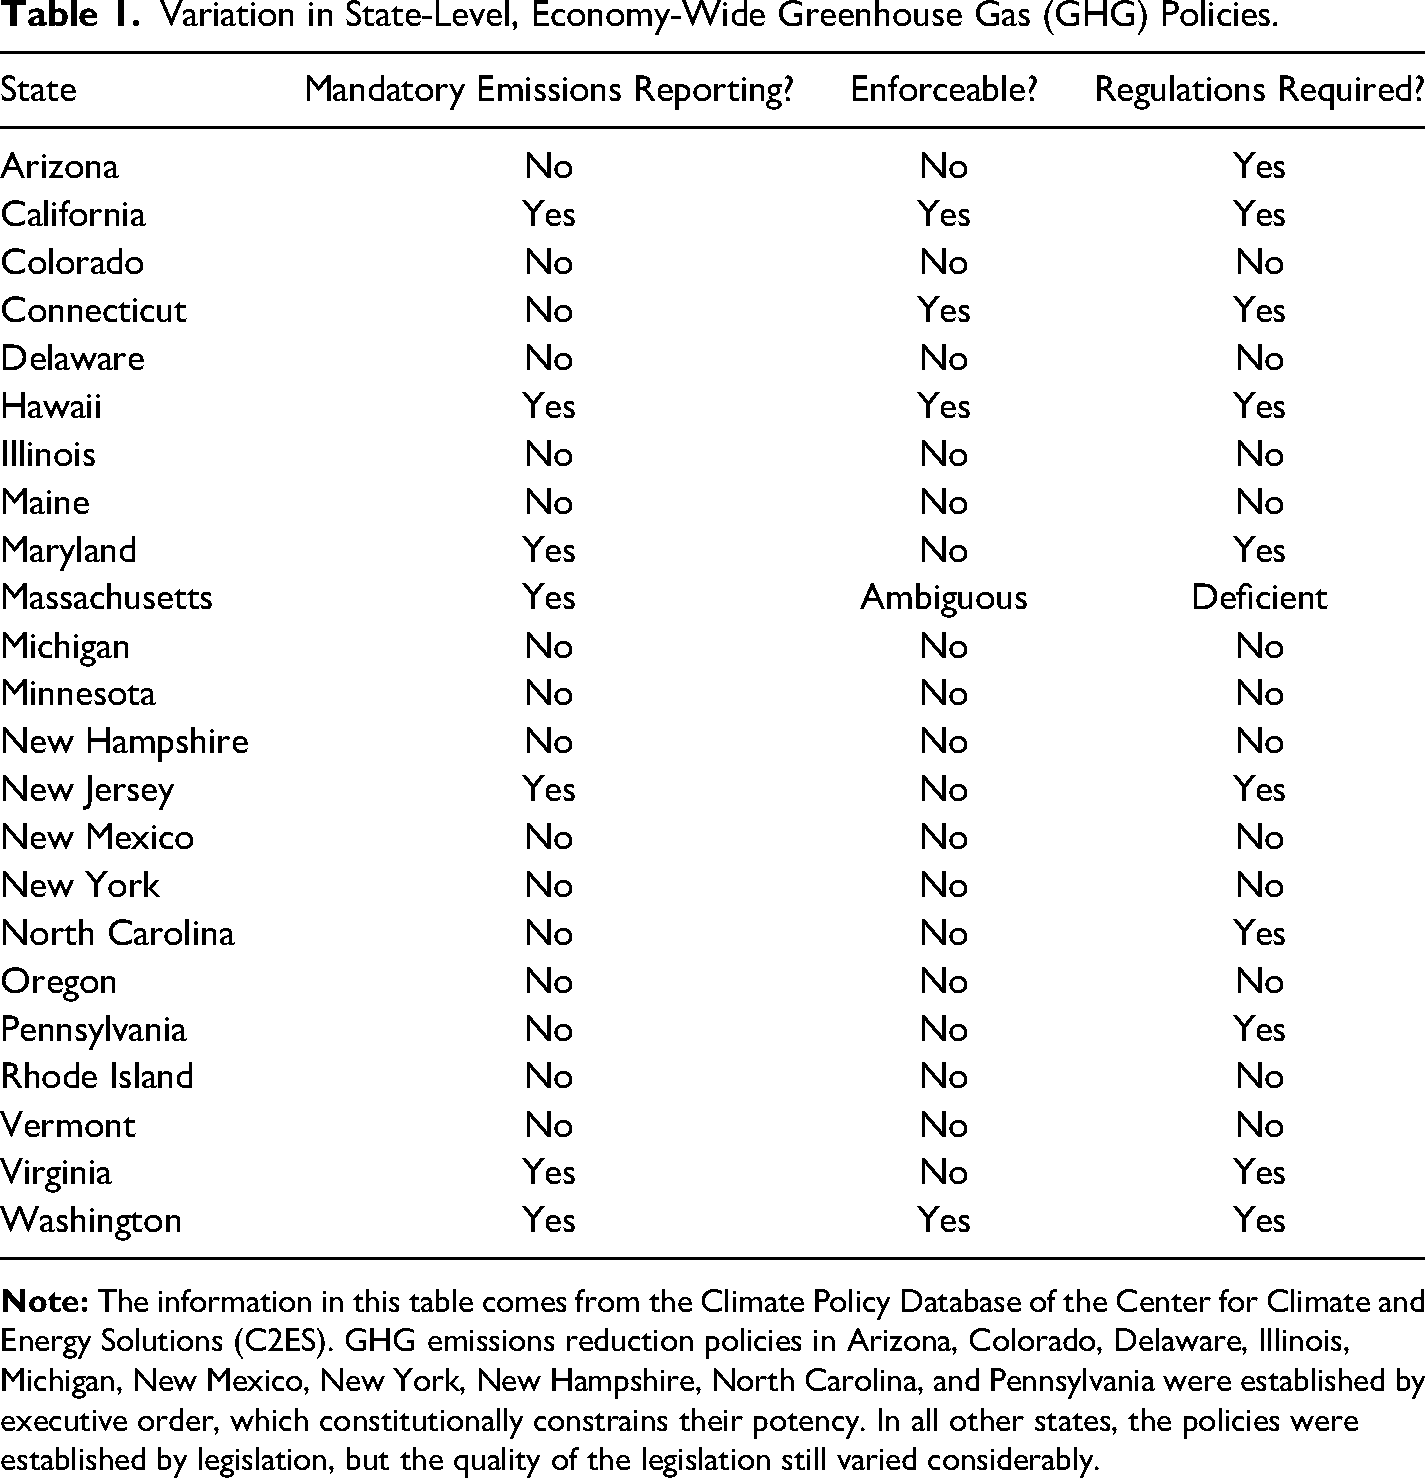
As Table 1 shows, the GHG policies vary in the degree to which they require reporting/verification of GHG emissions (a prerequisite to achieving measured reductions), the degree to which their targets are enforceable, and the degree to which they are accompanied by supportive regulations to ensure their targets are met. 16 The RPS policies, for their part, vary on an even greater number of dimensions; they are “never designed the same way in any two states.” 17 In addition to the targets and timelines, varying dimensions include voluntary versus mandatory targets, the very definition of an “eligible renewable resource,” the eligibility of electric generation facilities by geographic location and the date they commenced operation, and acceptable compliance methods. 18
Variation in State-Level, Economy-Wide Greenhouse Gas (GHG) Policies.
In twenty states, certain utilities are exempted from the RPS altogether, and several states have questionable resource eligibility requirements. For instance, Pennsylvania's RPS has been dubbed “the dirtiest RPS in the nation,” 19 counting energy produced from “waste coal.” While some states impose stringent penalties on noncompliant electricity providers, others do not. 20 Of course, all this variability has implications when it comes to both the environmental strength of the policy and the question of how its costs are distributed. As we will see, the extant literature does not satisfactorily explain the nuanced ways in which both policy types vary, and a two-dimensional framework attentive to the varied preferences of the full range of actors with a stake in policy design is necessary to understand it.
State-level GHG policies are driven either by legislative statutes (n = 15) or executive orders (n = 8), with the latter generally leading to environmentally weaker and less durable policies imposing few costs. 21 The RPS policies were typically created through legislative statutes (n = 36). The first was adopted in 1983 (by Iowa) and the most recent in 2020 (by Virginia), but the vast majority (n = 30) were adopted between 1995 and 2015. Typically, RPS policy regimes are dually designed by state legislatures and public utility commissions (PUCs), 22 sometimes jointly with other state agencies. The legislature outlines the basic parameters, and the PUCs work out the finer details (Center for Climate and Energy Solutions 2020). Between 1995 and 2014, some 207 legislative changes were made to state-level RPS policies, and many hundreds more changes were made by PUCs. 23
Between 2006 and 2008, California (in 2006), Oregon (in 2007), and Massachusetts (in 2008) each adopted a legislative GHG policy. However, their environmental strength varied considerably. California's and Massachusetts's laws both required emissions reporting/verification while Oregon's did not. 24 California's target was unambiguously enforceable; 25 in Massachusetts, the legislative language about enforceability was (intentionally) vague. 26 By contrast, Oregon's targets were entirely voluntary. 27
In California, supportive regulatory policies were wide ranging, including a cap-and-trade program, a low-carbon fuel standard, landfill methane capture, and limits on tractor-trailer emissions. 28 Critically, because of the enforceability of California's emissions cap, the California Air Resources Board (CARB), which administers the cap-and-trade program, levies significant fees against noncompliant entities. The revenues have enabled the CARB to significantly expand its enforcement staff.
In Massachusetts, the GHG statute delegated a comparable degree of regulatory authority to the Massachusetts Department of Environmental Protection (MDEP), but it did not contain language requiring MDEP to promulgate supportive regulations. This deficiency resulted in slower and less substantial regulatory progress than in California. 29 In Oregon, the GHG policy lacked supportive regulations altogether. The GHG law explicitly stated that it “does not create any additional regulatory authority for an[y] agency or Executive department.” 30
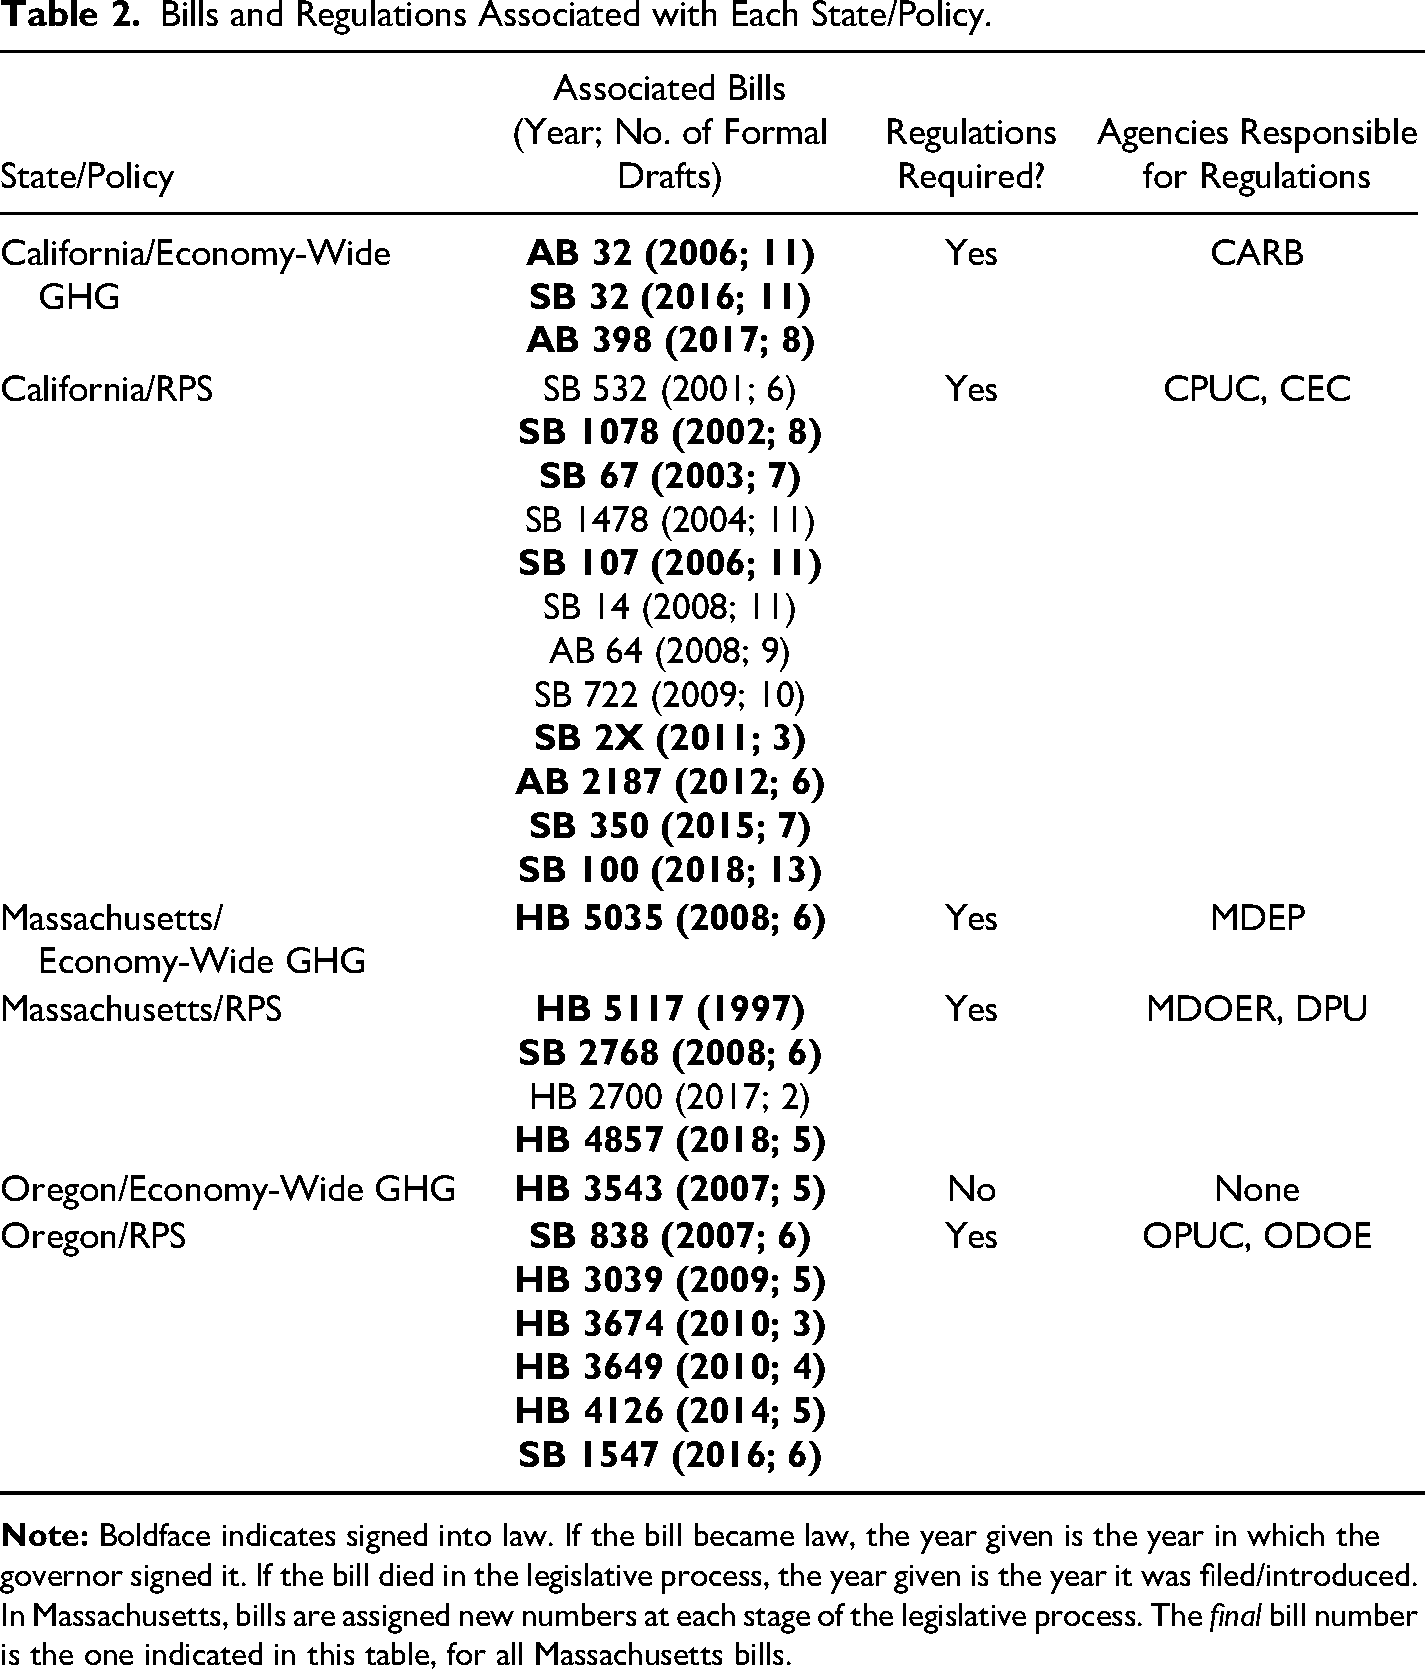
Regarding the same three states’ RPS policies, which were adopted over a longer time horizon and amended multiple times (see Table 2), it is not clear that they vary significantly in their environmental strength. Unfortunately, one cannot simply look at the renewable energy capacity added in each state to assess RPS strength because of the large number of confounding policies and economic conditions that might be responsible for that outcome. 31
Bills and Regulations Associated with Each State/Policy.
However, Carley et al. do calculate a quantitative measure of RPS stringency over time and find that Massachusetts's was the most stringent, followed closely by California's, followed by Oregon's. 32 On the other hand, Fischlein and Smith conceptualize and measure RPS stringency differently, in terms of the presence/absence of fourteen substantive provisions “believed to drive additional renewable energy deployment.” 33 They find that, as of 2011, Massachusetts's RPS had twelve of these provisions, Oregon's had ten, and California's had nine.
Thus, the comparative environmental strength of the RPS policies is more debatable, and more dependent on how it is operationalized. Regardless, all three states have significantly stronger RPS policies than those of many other states. All three have mandatory RPS policies 34 that apply to all the states’ largest IOUs, that prohibit “double-counting” of legacy renewable resources, that exclude/discount the value of more controversial technologies, and that have penalty mechanisms for noncompliance. 35
However, when one examines the actual legislative and regulatory texts associated with these three states’ RPS policies, they are far from the same. All three have provisions extraneous to their centerpiece targets and timelines, and the precise nature of these provisions varies across states. For example, Senate Bill 1078, which created California's RPS, directs the PUC to “allow an electrical company to limit its annual [RPS] procurement obligation to the quantity of eligible renewable resources that can be procured with available supplemental energy payments,” 36 essentially guaranteeing IOUs access to ratepayer subsidies if renewables were to cost more than fossil fueled generation. When California's RPS was updated in 2006, language was added directing the PUC to adopt “flexible rules for compliance,” 37 leading to a practice known as “earmarking” whereby IOUs could satisfy their compliance obligations ahead of time, despite insufficient transmission for that electricity to reach the grid. And then, when the RPS was once again updated in 2011, the California legislature included a series of “off-ramps” allowing IOUs a range of legally acceptable “excuses” for noncompliance based on contingencies that could have ended up making compliance more costly. 38
In Massachusetts, the RPS policy was riddled with its own set of puzzling, extraneous provisions. A provision inserted into the initial 1997 RPS bill required the state to “revisit the feasibility” of the policy several years later. 39 Then, when the Massachusetts Department of Energy Resources (MDOER) wrote the regulations implementing the RPS, it established a novel (at the time), “unbundled” renewable energy credit (REC) trading program that ultimately granted IOUs flexibility to meet the requirements by trading certificates in a liquid market with electric companies in other states rather than building and connecting new sources of renewable generation in Massachusetts. 40 In 2008, when the Massachusetts RPS was revised, a provision appeared allowing Massachusetts IOUs to own and operate their own solar generation facilities rather than having to contract with independent power producers to obtain solar electricity. 41
In Oregon, a “cost cap” was inserted into the 2007 RPS law, in §12: “Electric utilities are not required to comply with a renewable portfolio standard during a compliance year to the extent that the incremental cost of compliance … exceeds four percent of the utility's annual revenue requirement for the compliance year.” In addition, an “automatic adjustment clause” provision was inserted, fundamentally altering the procedure through which IOUs recover costs from ratepayers. And in yet another provision, RECs, the currency IOUs use to demonstrate their RPS compliance, were explicitly permitted to be “banked and carried forward indefinitely.” 42
These extraneous RPS provisions, in all three states, might strike the unfamiliar observer as unrelated, but as my analysis will show, they all have something similar in common. They all shift the costs/risks associated with RPS compliance away from IOUs and onto everyone else—everyone that consumes electricity. As we will see, far from insignificant, these provisions reflect the highly sophisticated policy preferences of a single type of corporate actor, distinguishable among all others by their unmatched ability to achieve those sophisticated preferences in the ultimate design of RPS laws/regulations.
How can we explain these distinctive patterns of policy variation in these three climate-policy-leading states, in which the GHG policies vary in their environmental strength and, at the same time, the RPS policies are riddled with provisions that similarly shift costs/risks away from IOUs and onto everyone else? We can start by examining the extant literature. When we do, it becomes clear that the “problem of preferences” and a unidimensional framework for analyzing political influence prevent a satisfying explanation. 43 However, through qualitative methods and careful triangulation of multiple sources of evidence, we can arrive at a more satisfying answer. Specifically, I find that these patterns are explained, first and foremost, by variation in the policy preferences of IOUs, the only type of business actor consistently able to achieve its preferences in every policy case examined, and secondarily, by variation in the balance of power among the remaining business actors, which varied across states.
State-Level Climate Policymaking Literature
The insufficiency of the extant literature for making sense of our GHG and RPS puzzles stems from its predominant focus on policy adoption rather than design. 44 The literature helps explain which states adopt these policies and which do not; adopters tend to be Democrat-controlled states, 45 with favorable public opinion, 46 low in-state fossil fuel production, 47 and high renewable energy potential. 48 Yet all three states (California, Massachusetts, and Oregon), unsurprisingly given the number of policies they have adopted, offer comparably favorable characteristics when it comes to such things. 49 Where they vary, it is in ways that make the outcomes observed even more puzzling.
Democrats controlled all three state governments during the period of interest. In 2008, the California legislature was 61 percent Democrat, the Massachusetts legislature was 88 percent Democrat, and the Oregon legislature was 55 percent Democrat, though Oregon is the only one to have had consecutive Democratic governors from 1987 to the present. 50 In all three states, 78–79 percent of the voting public supported policy “to regulate greenhouse gas emissions,” 51 and support for the RPS was also roughly the same in all three. 52 While California had the highest in-state fossil fuel production, 53 it also had the strongest GHG policy. And while California had the greatest renewable energy potential, Oregon's far exceeded Massachusetts's, 54 despite Oregon's GHG law being much weaker than Massachusetts's.
One important critique of this literature is that it does not delve into the policy preferences of interest groups, especially business actors. 55 By contrast, Stokes centers interest groups in her analysis of policy variation and deals in greater detail with substantive policy content. 56 We will return to what insights we can glean from Stokes shortly, but first, we need to understand the challenges of studying business preferences and influence more generally.
Business Preferences and Influence
Debates about business policymaking influence have historically focused on whether there exists a unified business community capable of shaping policy, or whether, alternatively, fragmentation of capitalist preferences undermines business power relative to that of the public interest. 57 These debates have tended to be “resolved” in favor of historical contingencies; the answer depends on historical/contextual conditions. 58 A strand of political science literature argues that these contingencies can also be based on the substance of the policy itself; business power can vary depending on what type of policy is proposed and whether it has the effect of distributing or redistributing resources among stakeholders. 59
Alongside discussion of the fragmentation versus unity of business preferences is the question of business's policymaking influence. 60 This is complicated by the fact that researchers are increasingly pointing to cases in which business preferences were aligned with the public interest, not opposed to it. 61 This suggests that the question of business preference unity/fragmentation should be treated independently from the question of business policymaking power. 62 Methodologically, this means it is ill-advised to rely on the stated policy preferences of “peak organizations” as a proxy for all business preferences; it is necessary to evaluate business preferences at a more granular level to then be able to assess the degree to which such preferences are ultimately reflected in policy, and at whose expense. 63
When it comes to climate policy, we know that business preferences are fragmented. 64 In the US states, we can identify at least three categories of business actors likely to have distinct preferences when it comes to policy design. “Green business” actors such as renewable energy firms, energy efficiency consultants, and “climate-sensitive” industries whose business models are disproportionately and adversely affected by climate change in the short run are likely to prefer environmentally stringent policies given their economic self-interest. They stand to experience economic gain from these policies rather than being on the hook for paying for them. 65 By contrast, “traditional business” actors such as fossil fuel producers and energy-intensive firms whose products face high exposure to trade are well-known opponents of environmentally stringent policies. These actors calculate that they would be on the hook for paying for such policies. 66
But there is also a third type of business actor whose economic self-interest is less straightforward: the IOUs. These are the for-profit corporations responsible for delivering the essential public good of electricity to homes and businesses throughout their geographic service territories. Most are subsidiaries of global Fortune 500 companies that, at the state level, are allowed to operate as “regulated monopolies” whose revenues are determined by state PUCs. 67 They have become increasingly skilled at politics since the turn of the twentieth century. 68 Today, the largest include Berkshire Hathaway Energy, Exelon Corporation, Duke Energy, NextEra Energy, and American Electric Power. 69 Although their policy preferences are sometimes described as similar to the fossil fuel industry's, 70 in reality, they are more complicated; given the unusual nature of utility regulation, and the heavy intervention of state governments in determining IOUs’ revenues and profits, we might expect their policy preferences to be mediated by the feedbacks of preexisting policies in a way that those of green and traditional business actors might not be. 71
Identifying the “true” preferences of the IOUs (and confirming our intuitions about those of “green” and “traditional” business actors) is challenging. 72 Hacker and Pierson argue that “basic problems of theory, conceptualization and measurement continue to plague much of the discussion of business power.” 73 They point to three in particular: “The failure to distinguish and investigate multiple mechanisms of exercising influence, the misspecification of preferences, and the inference of influence from ex post correlation between actor preferences and outcomes.” 74
While all three remain a challenge, there have been significant advances regarding the first. 75 Scholars have identified a variety of mechanisms of corporate political influence, ranging from “political embeddedness” and “capital strikes” to policy-planning organizations, campaign contributions, and lobbying. 76 However, the second two problems identified by Hacker and Pierson, which, taken together, can be termed the “problem of preferences,” 77 remain largely unresolved. Widely cited studies of corporate influence either use the stated preferences of peak associations as a proxy for all business actors’ preferences, 78 a move meritoriously critiqued by Hart, 79 or they infer influence from ex post correlations between preferences and outcomes, relying on publicly stated preferences that are likely misrepresentative of true preferences. 80
Broockman details three distinct types of preference misrepresentation, any of which might be missed by a scholar inferring influence from an ex post correlation between preferences and outcomes. First, an actor might overstate its support for an outcome deemed to be politically feasible (even if not truly preferred), calculating that not doing so would result in an even less preferable result (“Overstating Support for Politically Feasible Outcome”). Second, an actor might “play the long game,” supporting a nonideal policy in the short term to gain an advantage in the long term via policy feedback effects (“Shaping ‘Policy Feedback’ Effects”). Third, an actor might withhold its support for a policy it likes, hoping to extract concessions to make the outcome conform even more closely to its preferences (“Withholding Support to Gain Additional Concessions”). 81
In this study, I employ a method that overcomes this “problem of preferences,” albeit for a finite set of policies. My starting point is the actual policy texts. I review every draft of every bill and every proposed and adopted regulation, carefully documenting the provisions that changed from the first version to the last—the one ultimately adopted into law. I then triangulate these data with the archival record and “policy-focused interviews,” in which lobbyists representing a range of organized interests (selection methods discussed in the data and methods section) were asked about their clients’/employers’ preferences regarding particular provisions. Their responses were further verified in interviews with decision makers, that is, the legislators and regulators they lobbied.
This method, based on one used in a prior study, 82 safeguards against the inferential errors Broockman warns about. For example, even an actor that publicly supported a piece of legislation at the final stage of the legislative process (as evidenced by the archival record) would concede when asked in an interview about why a provision in an earlier draft of the legislation was removed that, although preferred initially, it had to be compromised away in the interest of political feasibility (“Overstating Support for Politically Feasible Outcome”). An actor asked about why it lobbied in favor or against a provision might cite a desire to shape a subsequent round of policymaking, or constraints imposed by a prior round of policymaking—“policy feedback effects”—if there were no other basis for holding the position it held (“Shaping ‘Policy Feedback’ Effects”). And an actor who was not on record supporting a proposed bill at its initial hearing (according to archival records), but then supported the final version of the legislation after it was amended to include a provision that multiple legislators told me was included on account of that actor's lobbying, would not evade observation and therefore not lead to inferential error (“Withholding Support to Gain Additional Concessions”).
Hertel-Fernandez also developed a method of overcoming the problem of preferences. His, like mine, is guided by the insight that “one important reason why it is so difficult for scholars to pin down exactly how business shapes policy is that corporate interventions often occur early in the legislative process, shaping the agenda of alternatives that are considered by lawmakers and specific language that is drafted within a bill.” 83 His approach, like mine, is to rely on the actual legislative text, in his case comparing how closely the adopted legislation resembles “model legislation” proposed by the American Legislative Exchange Council (ALEC), an amalgamation of conservative ideological and corporate interests.
This approach overcomes the problem of preferences with respect to ALEC, but the challenge remains that ALEC is an “umbrella organization” comprising many, but not all, individual corporate actors. Business actors are simultaneously organized as individual companies, intraindustry associations, and interindustry associations (e.g., ALEC), and they lobby for their preferences in all three forms, perhaps with varying degrees of specificity in each one. ALEC's model legislation neither perfectly represents the preferences of each individual corporate actor nor does it encompass all the corporations with a stake in a given policy. As Hertel-Fernandez himself notes, ALEC often “combines the sometimes conflicting preferences [of its members].” 84
The challenge of disentangling all corporate policy preferences is especially important in a policy area like climate/energy, in which corporations’ preferences are staunchly divided because of the distributive and/or redistributive effects of the policies. 85 Some corporations (“green business” actors) stand to get paid by the very same provisions that other corporations (“traditional business” actors) would be on the hook for paying for, harming their profitability or in some cases threatening their survival. And then there are the IOUs, whose preferences are opaquer because of the way in which their profitability is mediated by policies set forth by their regulators, the state PUCs. When it comes to variation in the environmental strength of the GHG policies in California, Massachusetts, and Oregon, for instance, it is unlikely that Hertel-Fernandez's method, meritorious as it is, would allow us to understand the ways in which the cross-cutting preferences of business actors translated into such divergent outcomes over time.
Who Pays? Toward Two-Dimensional Policy Analysis
Stokes's account of renewable energy policy developments in four states provides some critical tools for making sense of variation in policy design in California, Massachusetts, and Oregon. Stokes’s analysis gets us away from thinking just about policy adoption and toward a necessary focus on policy design. Her aim is to explain policy retrenchment in a set of states that are considered neither total leaders nor total laggards on climate policy. Her argument centers on the policy preferences of interest groups, especially business actors, and her rich qualitative data including interviews with key lobbyists and policymakers are helpful in mitigating, if not eliminating, the problem of preferences. Stokes also centers economic interests in explaining business preferences, writing, “Battles over climate policy are fundamentally material,” 86 which we will see was very true in California, Massachusetts, and Oregon as well.
Another virtue of Stokes's analysis is its attention to policy feedback effects over time: “There is an iterative relationship between policy and politics,” 87 and we will see that that is true in my cases, too. Indeed, Stokes's core concept for explaining policy retrenchment, the “fog of enactment,” is about political actors failing to anticipate the twists and turns that new policies take after they are first adopted, including as they are being implemented, and how this can skew the balance of power between interest groups. 88 This perspective is helpful in explaining both why the shortcomings of certain policies, such as the Massachusetts GHG policy, only become apparent with the passage of time and, also, how the policy preferences of the most sophisticated business actors incorporate the feedback effects of past policymaking and anticipate future policymaking, too. 89
However, while Stokes's framework is useful for explaining the variation in the environmental strength of the GHG policies, it does less to explain the extraneous provisions in the RPS policies. In Stokes's analysis, the preferences of IOUs and fossil fuel companies are portrayed as congruent. And indeed, there are deep and persistent ties between IOUs and the fossil fuel industry, in large part because of IOUs’ corporate structure, in which they are often subsidiaries of parent companies that own significant fossil fueled generation. 90 However, as we will see, in the cases of the GHG and RPS policies in California, Massachusetts, and Oregon, IOUs’ preferences differed from those of fossil fuel producers, subsumed within the analytical category of “traditional business” actors. 91
The outcome Stokes evaluates is “policy effectiveness,” conceptualized as “Did the policy meaningfully solve the problem [of rising GHG emissions]?” 92 This is a crucial, but unidimensional, outcome. What we will see when we turn to a two-dimensional framework is that, while the economic-based preferences of traditional business actors were incompatible with environmentally strong policy, those of the IOUs, whose preferences carried the day, were perfectly compatible with environmentally strong policy, provided costs/risks were simultaneously shifted onto other actors.
Yet focusing only on the question of who pays is equally insufficient. For instance, Wilson, who advances a theory that meritoriously observes the importance of distributive effects of policy (i.e., who pays?), typologizes the ways in which policies vary in terms of their costs (“distributed” vs. “concentrated”) and in terms of their benefits (likewise, “distributed” vs. “concentrated”). Wilson characterizes “anti-pollution policy” as having concentrated costs (on polluting industries) and distributed benefits (cleaner air for all), thus corresponding with “entrepreneurial politics.” 93 However, as we will see, state-level GHG and RPS policies are not well characterized by this arrangement. Instead, environmentally strong policies are characterized by widely distributed benefits and widely distributed costs. Yet instead of the corresponding politics being “majoritarian” in nature, as Wilson typologizes, the politics I observe involved a single type of corporate actor, IOUs, escaping any costs and instead using their unmatched political power to “re-distribute” those costs onto other actors.
Therefore, my analysis suggests the usefulness of a two-dimensional framework for mapping policy preferences onto outcomes. Neither the approach of examining only preferences/outcomes related to environmental strength nor that of examining only preferences/outcomes related to who pays will succeed in explaining the empirical puzzles associated with the two policy types. Figure 1 illustrates this two-dimensional framework. To demonstrate its utility, I turn to analyze the sources of variation in the environmental strength of the three GHG policies and the sources of the similarly redistributive RPS provisions in the same three states.
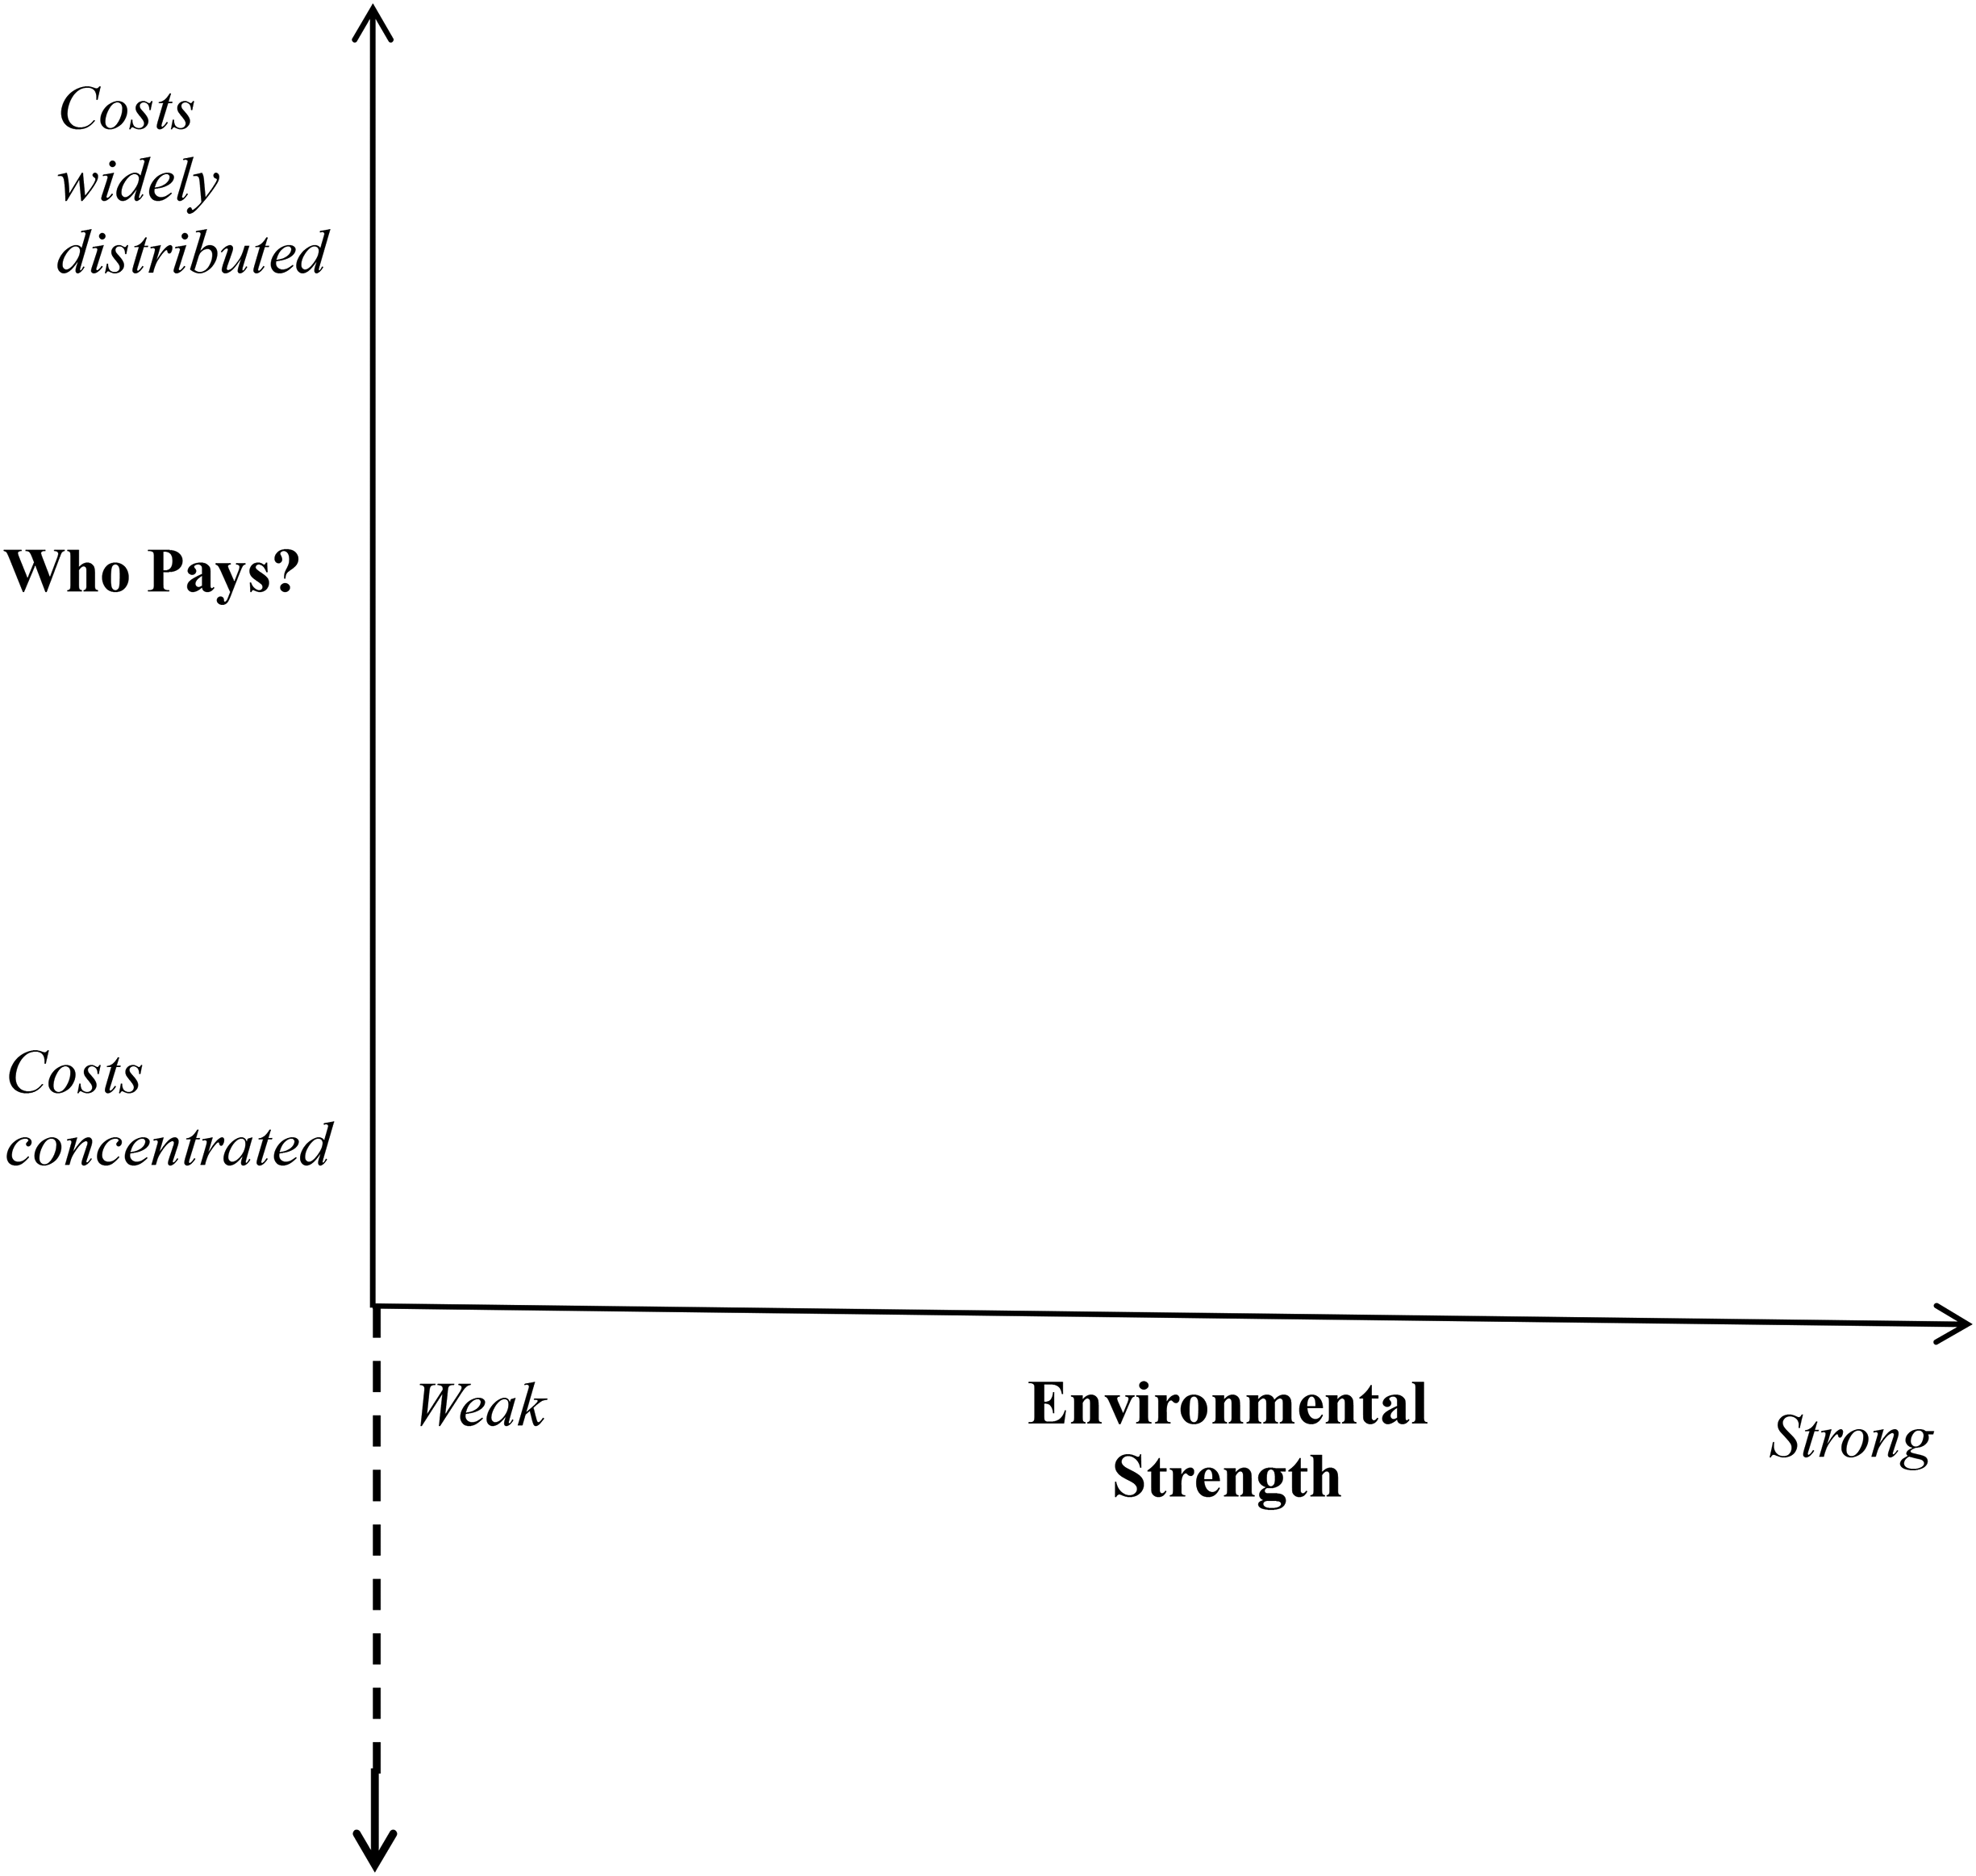
Two-dimensional environmental policy outcomes.
Data and Methods
To better isolate business actors’ preferences in shaping the design of these policies, in addition to selecting only “climate policy-leading states,” 94 I selected states with comparable levels of environmental social movement organization (SMO) strength. 95 One measure of this, used in past studies, 96 is Sierra Club membership per one thousand in the state population. According to this measure, Oregon—the state with the weakest GHG policy—had the strongest environmental SMOs, ranking second in the country; California ranked third, and Massachusetts ranked ninth. 97
To account for the potentially independent influence of state actors, a key factor in “state-centered theory,” 98 I selected three states with key state actors that were comparably motivated to enact environmentally strong policies. Consider, for instance, the three governors in office when each GHG policy passed, since Rosenthal argues governors are the single most consequential state government actor. 99 In California, Governor Schwarzenegger was described as “want[ing] to do something about” climate change, even “reach for the stars,” and “[having] folks in his administration that really wanted to tackle the [climate change] issue” as well. 100 In Massachusetts, Governor Patrick prioritized climate policy, as did his political appointees. 101 Likewise, Oregon's Governor Kulongoski “really believed we needed to move to a renewable energy regime”; 102 his senior advisor was “a huge force” in making climate “a top item in the state's politics and policy.” 103 By selecting “most-similar” cases in terms of these important factors other than business preferences/influence, including the political economy characteristics noted in a previous section, I was able to focus squarely on business preferences and influence. 104
I began my investigations with a longitudinal analysis of all six policy cases. I used LexisNexis’s StateNet database to compile the actual legislative/regulatory texts associated with each policy, beginning with the first version formally introduced (in the case of legislation), or the proposed rule (in the case of regulations). Table 2 provides the number of versions for each bill as well as the regulatory agencies associated with each policy. Having access to each version of policy text enabled me to track changes in the proposed content of each policy over time.
Next, I identified and documented the full range of outside actors that expressed substantive preferences regarding these policies. This is complicated by the “problem of preferences.” 105 To mitigate this problem, I relied on both archival evidence and policy-focused interviews, triangulating interviewees’ accounts across interviews and with the archival record. Policy-focused interviews, personal written correspondence provided by interviewees, and documents tracked down from staffers on the relevant legislative committees helped fill the gaps when states’ recordkeeping vigilance varied. The 4,835 pages of archival documents I collected/analyzed included written testimony containing the policy preferences of interest groups, lists of actors stating positions on a particular bill at multiple points in its legislative lifetime, bill summaries, and side-by-side comparisons of the content of multiple versions of legislation.
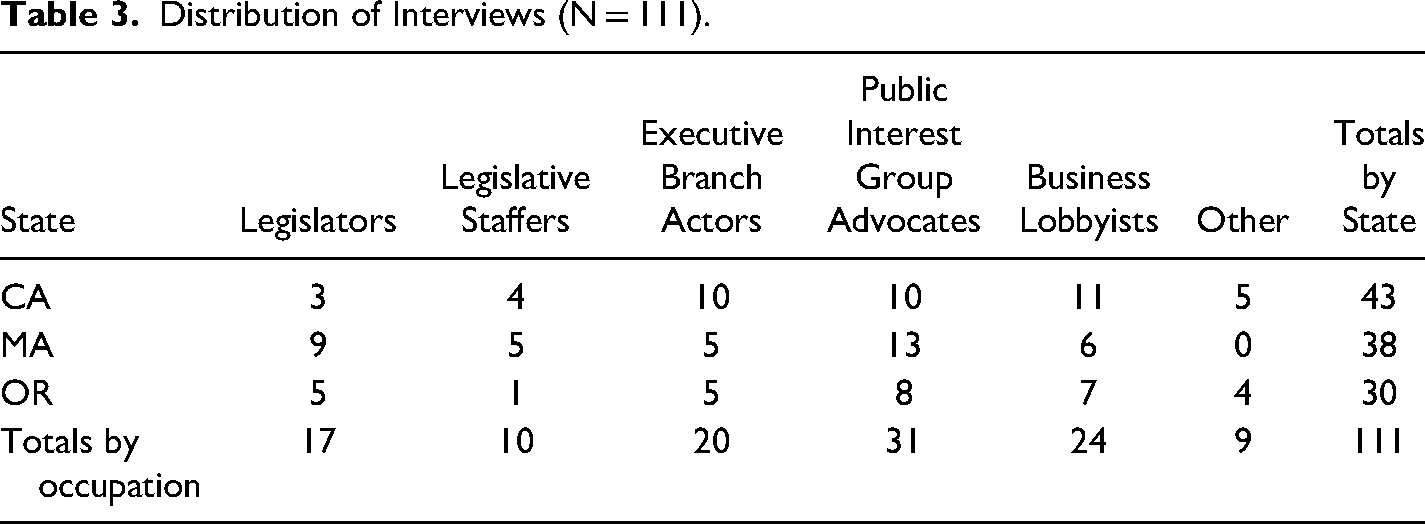
Archival data are limited both by recordkeeping vigilance and by the information actors were willing to submit for the record. Therefore, much of my richest information flows from 111 policy-focused interviews. My preinterview review of the policy texts and archival records spared interviewees’ time, reserving our conversations for highly focused questions about their then employer's preferences regarding specific provisions.
My bipartite strategy for selecting and recruiting interviewees began with a systematic search of journalistic coverage of the relevant policies, using two newspaper sources per state. One newspaper was chosen for its wide circulation, the second for its proximity to the state capitol: thus, the Los Angeles Times and the Sacramento Bee (California), the Boston Globe and the State House News Service (Massachusetts), and the Oregonian and the Statesman Journal (Oregon). Each time an individual's name appeared, I added it to my list of potential respondents. After the first few interviews, I noted several key individuals mentioned by respondents but whose names never appeared in the journalistic coverage; thus, I increasingly began to rely on “snowball sampling” to avoid missing key actors. 106 Of the 186 potential respondents I identified in this bipartite strategy, 111 (60 percent) agreed to be interviewed (see Table 3). All interviews were recorded and transcribed, then transcripts were coded using AtlasTI. Analysis of interview transcripts and archival documents followed a grounded theory approach. 107 Throughout the analysis and coding process, I wrote analytical memos to assist in revising preliminary conclusions as additional data were processed and analyzed.
Distribution of Interviews (N = 111).
Interviewees were asked about their personal involvement throughout each policy's development, their preferences throughout the policymaking process, and their strategies for advancing those preferences. For each provision that emerged/changed/disappeared, I aimed to gather three crucial pieces of information from each respondent: What did they want? How did they attempt to get what they wanted? And, to the degree they did not get what they wanted, whose preferences held sway instead (in their view)?
One noteworthy pattern that emerged was an association between the substantive breadth of an actor's preferences and the number of individual corporations whose interests that actor represented (see Figure 2). Individual corporations tended to advocate extremely narrow preferences (e.g., Oregon's single-corporation IOU, Pacific Power, conditioned its support of an entire bill on a single provision regarding REC “banking”), 108 while those representing multiple firms took broader positions (e.g., Oregon's Industrial Customers of Northwest Utilities, a trade association representing many firms across multiple industries, opposed the same bill entirely). 109
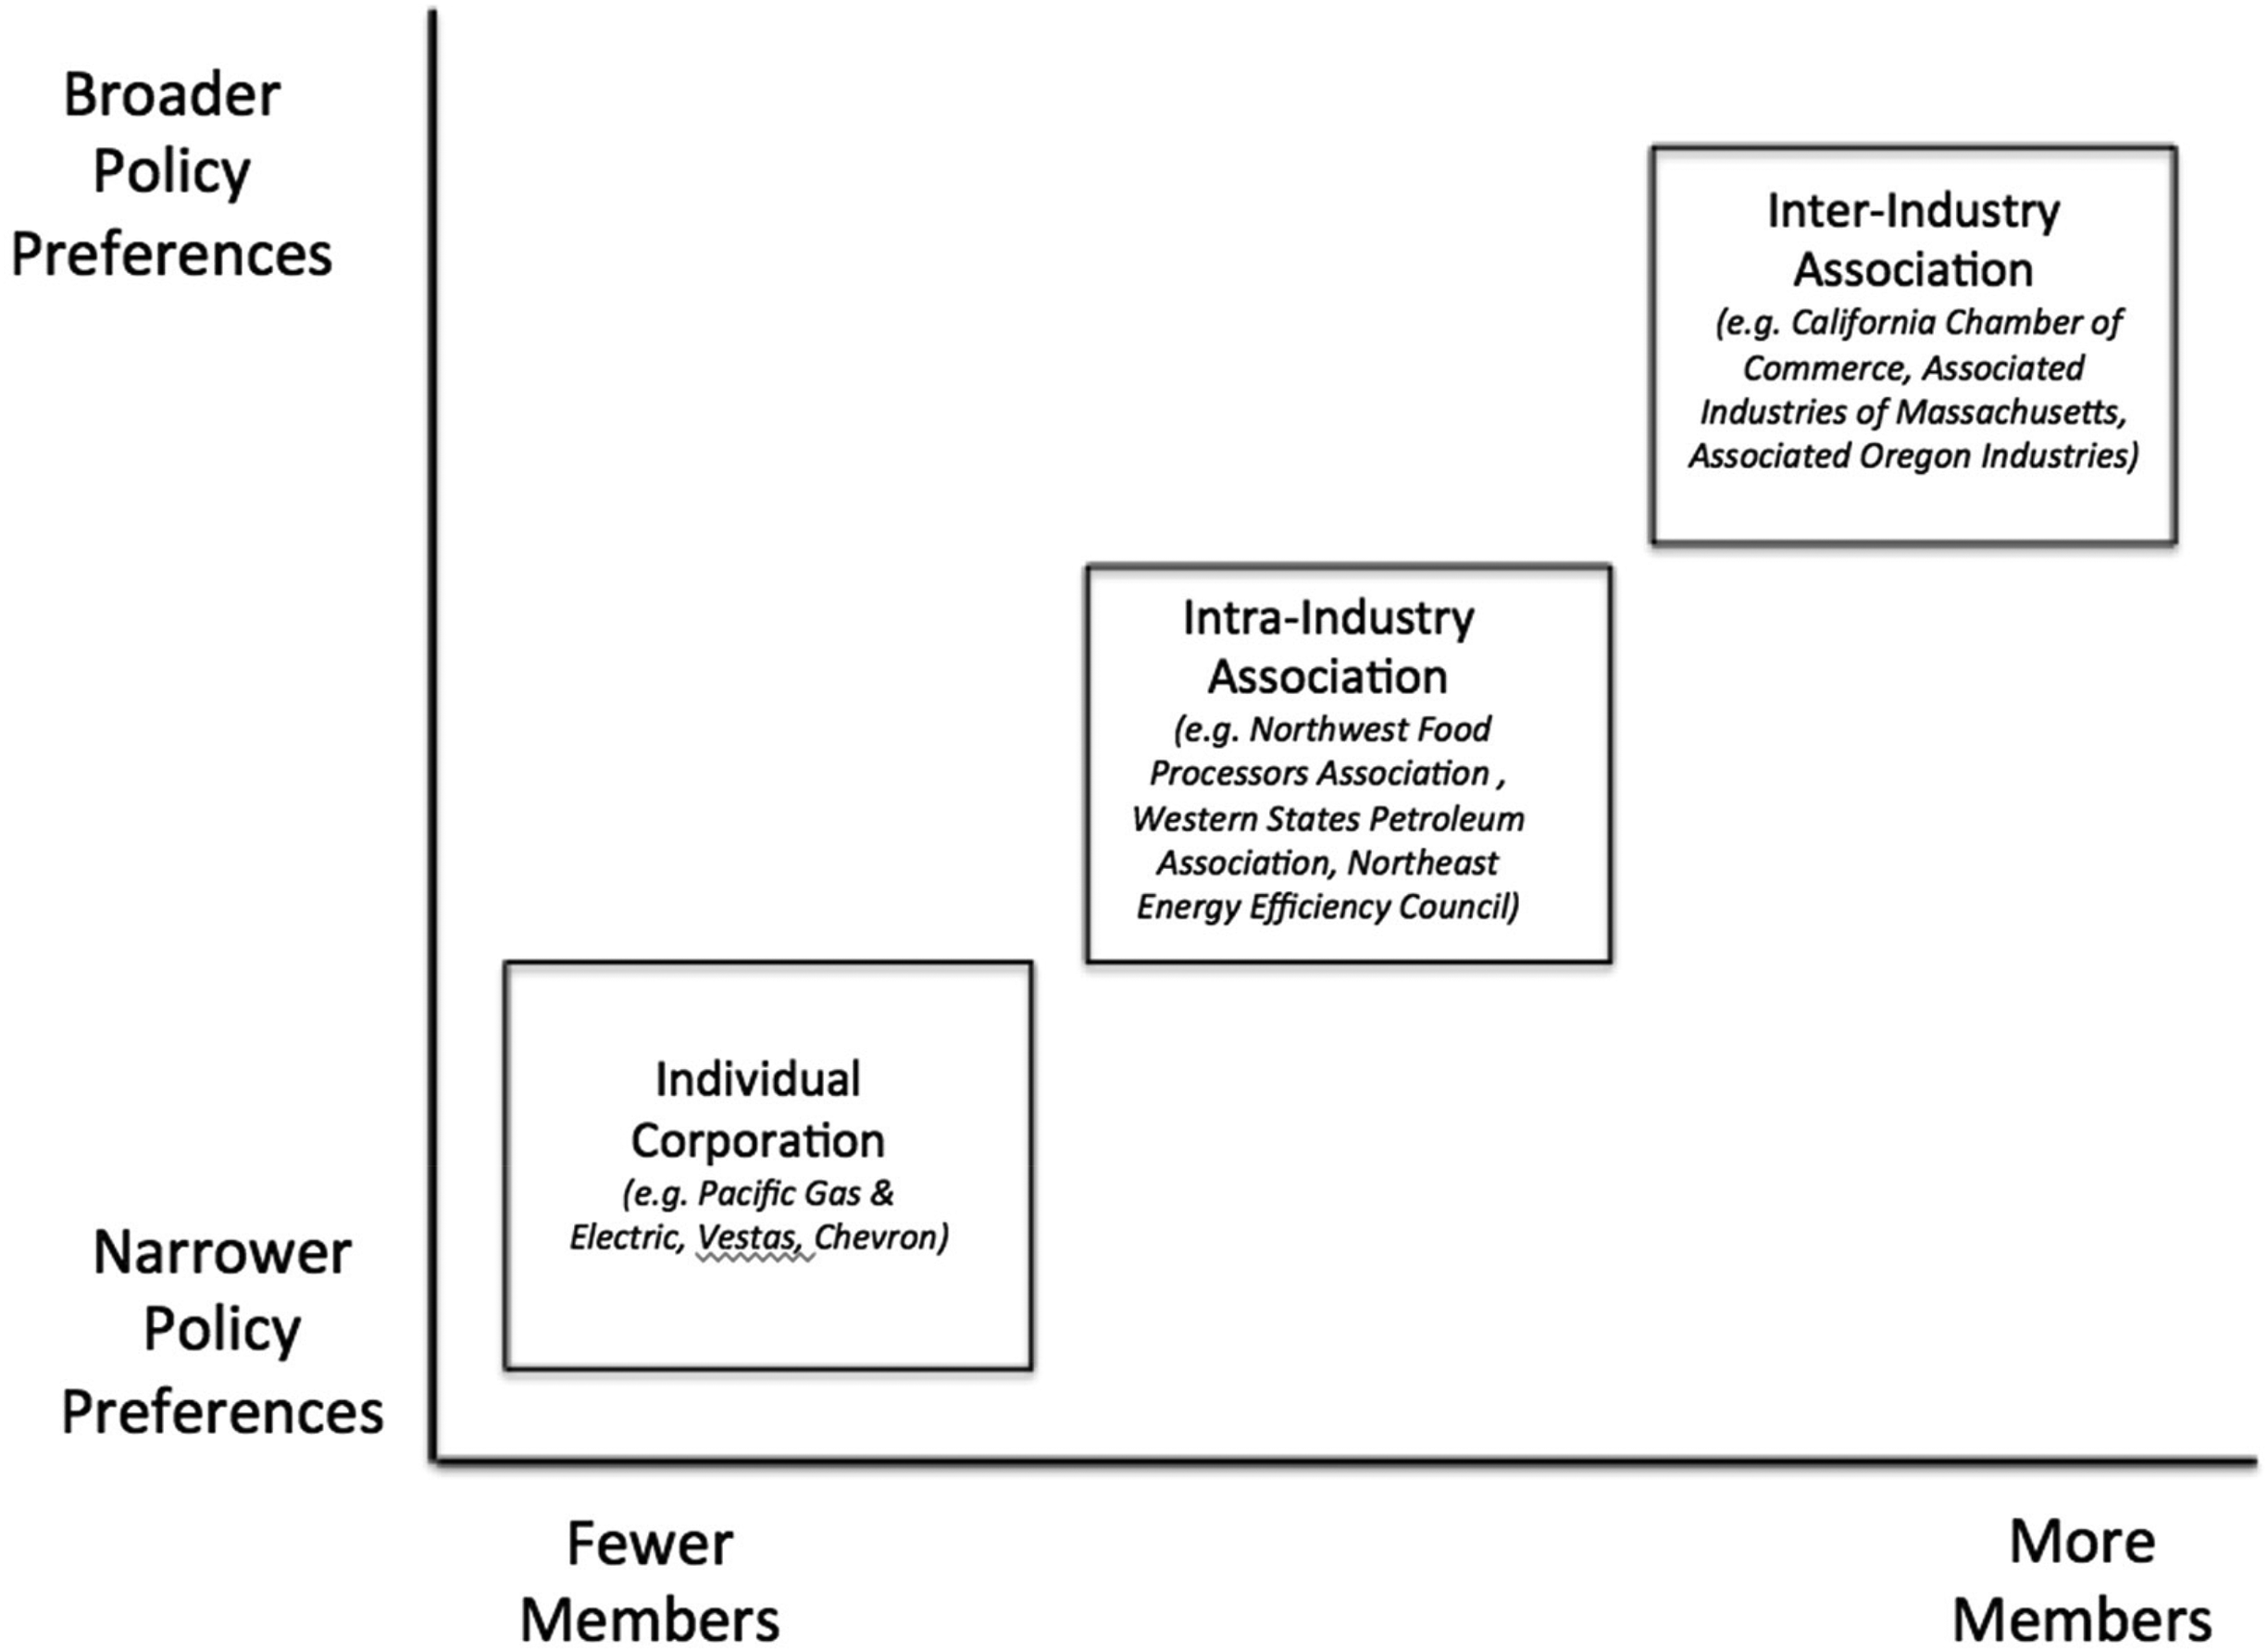
Organizational forms of private interests.
I avoid using interviewees’ names and/or their specific organizations’ names in an effort to maintain their anonymity.
Overview of Business Actors’ Preferences
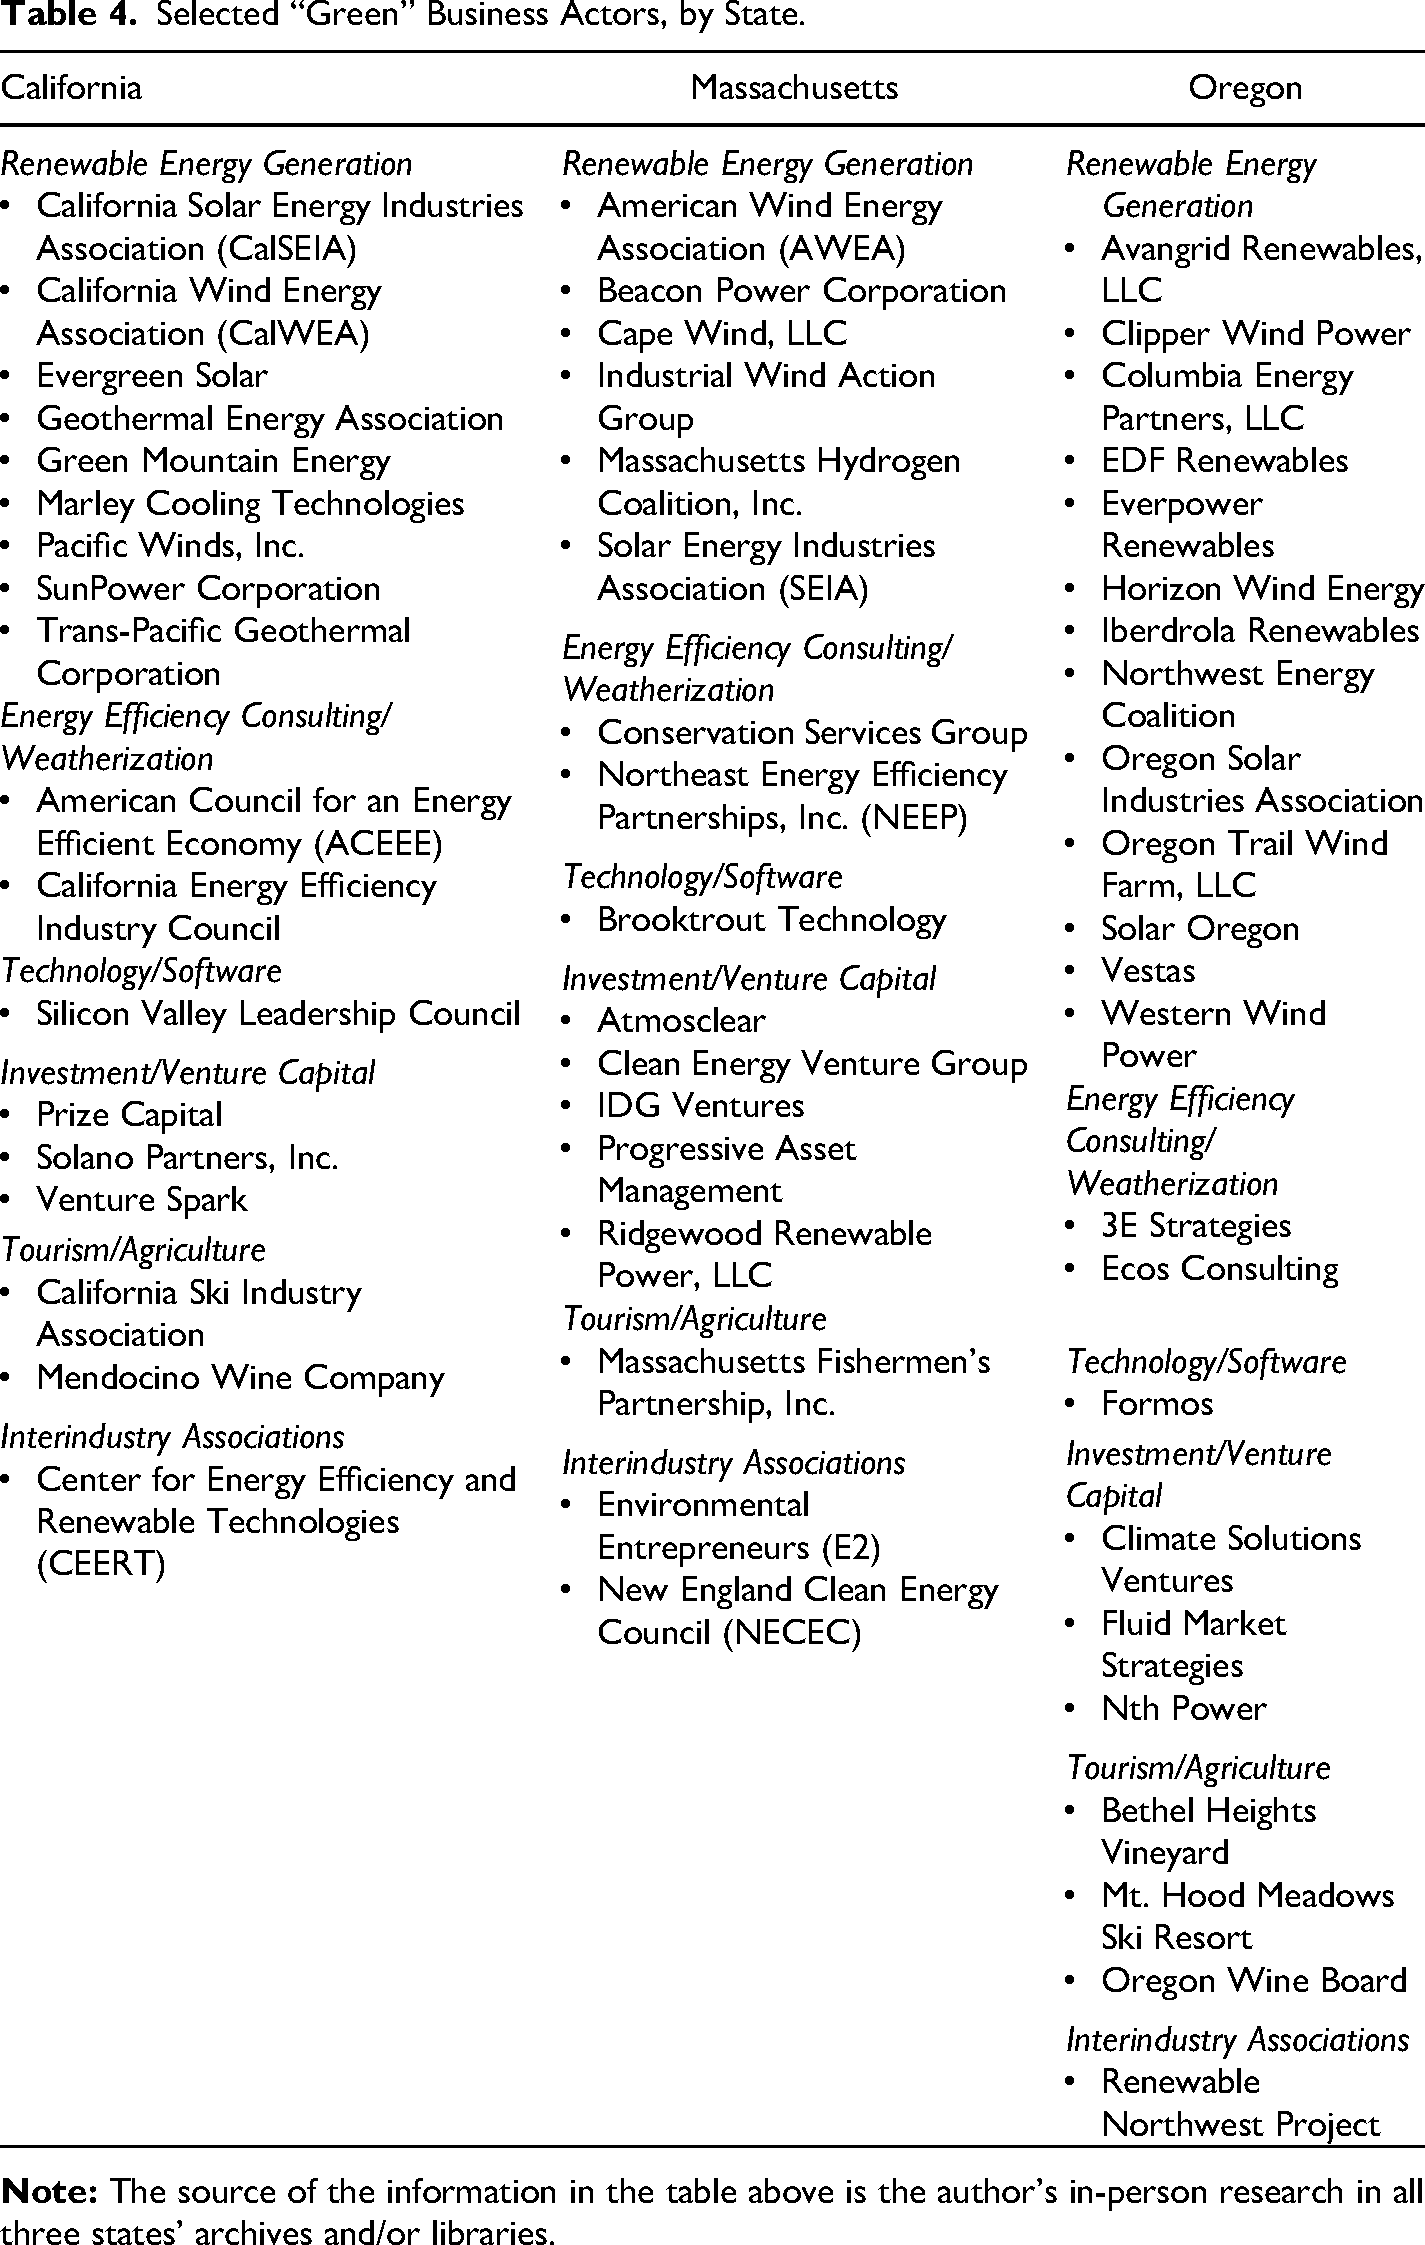
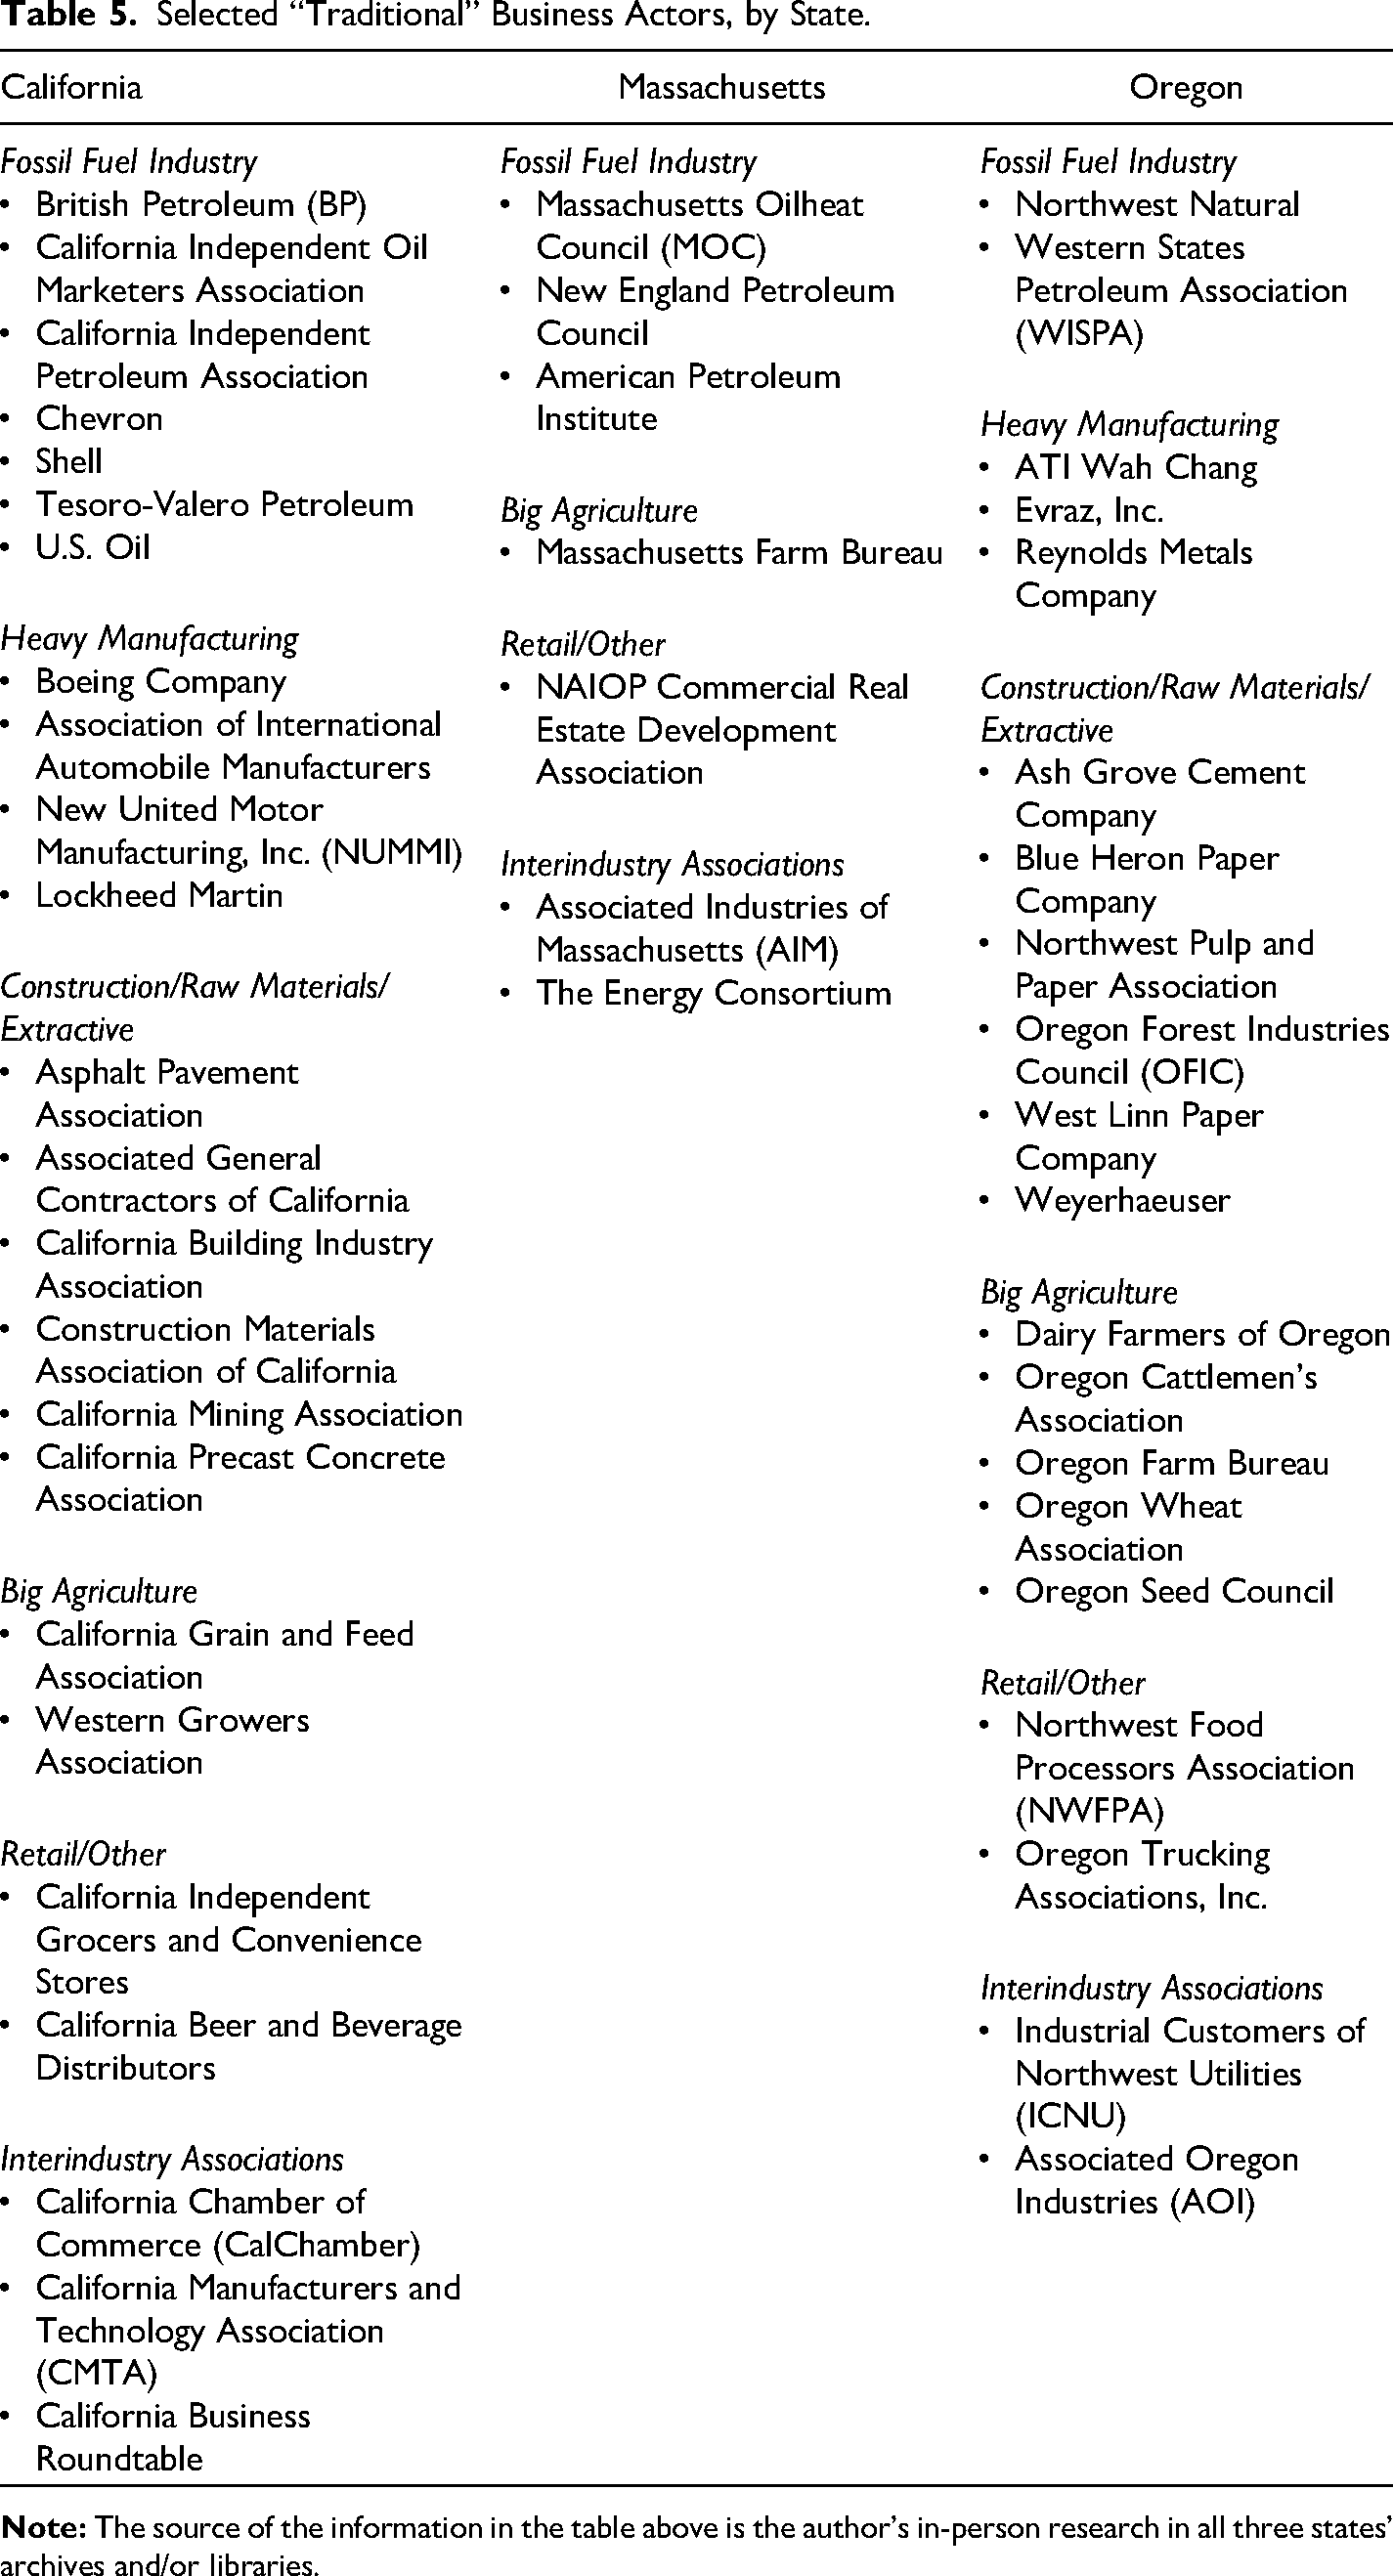
This methodology led me to discover that the true policy preferences of business actors had little to do with the dimension of environmental strength, even though grassroots engagement with the policies had everything to do with this dimension; business actors, in contrast to grassroots groups, cared almost entirely about who would pay, and while they did express preferences related to environmental strength, these preferences had everything to do with their perceptions of their economic self-interest, not altruism. Non-IOU business actors fell into two categories of preferences, based on the degree to which they calculated environmentally strong policy to help or harm them economically. Table 4 provides a truncated sample of each state's “green business” actors. Table 5 provides a truncated sample of each state's “traditional business” actors. Notably, California had many more of both types because of the sheer size of its economy, the fifth largest in the world by GDP. Also notable is the overrepresentation of green business actors relative to traditional business actors in Massachusetts, given that state's service-based economy.
Selected “Green” Business Actors, by State.
Selected “Traditional” Business Actors, by State.
IOUs’ policy preferences reflected a similar preoccupation with economic self-interest, but unlike non-IOU business actors, IOUs’ preferences were highly sensitive to the differing regulatory context of each state. What differed between IOU and non-IOU business actors was not the degree to which they cared about environmental strength versus who pays (business actors were uniformly more concerned with the latter) but rather the degree to which the preexisting regulatory regime affected this calculation.
GHG Policies: Variable IOU Preferences
To understand IOUs’ true preferences regarding the three proposed GHG policies, it is necessary to understand the distinctiveness of the US IOU industry. In the late 1800s, Thomas Edison established the first IOU. As Edison's business grew, he hired Samuel Insull as his chief financial strategist. 110 Insull was an ambitious capitalist who would go on to develop a corporate utility empire comprising three hundred utility holding companies and subsidiaries, including what today is Commonwealth Edison (ComEd), an Exelon subsidiary serving customers throughout Chicagoland. 111
Around the turn of the century, responding to public concern about the lack of competition in the electric utility business, Insull and his associates developed and executed a shrewd political strategy. Teaming up with academic economists, they convinced state policymakers that utilities, like railroads, were “natural monopolies,” requiring such extensive infrastructure investments that competition would be uneconomic. Insull and his cohorts traveled from one state to another promoting the idea of a “regulatory compact”; in exchange for policymakers shielding IOUs from competition, state governments would regulate their rates. This arrangement was spelled out in model legislation adopted state by state. 112
IOU owners/investors were clearly the greatest beneficiaries of this new legal arrangement, economically and politically. Their guaranteed customer base of electricity-dependent homes and businesses attracted ever-increasing investment capital, as loans were backed by the security of consumer demand. In addition, the laws were crafted such that PUCs’ rate-setting practices would guarantee IOU shareholders a “fair rate of return” on their capital investments. Since the utility industry is so capital-intensive (power plants, substations, poles, wires, etc.), IOUs were incentivized to build as much infrastructure as possible, so they could not only maximize the value of their assets but also the allowable return such assets would guarantee. 113 To this day, IOUs’ profits are driven by their investments, not their electricity sales. 114
This strategy was remarkably effective in financing IOU growth and concentrating economic power in a few holding companies larger than any one state's borders. By 1926, 80 percent of US electricity was controlled by forty-one holding companies, and two-thirds of all electricity was controlled by just six corporate empires: General Electric, Insull, Morgan, Mellon, Blyllesby, and Doherty. By 1932, just eight companies controlled nearly three-quarters of the IOU business. 115
This growth in IOUs’ economic power corresponded with growth in their political power. As Hirsh writes, Utility managers took effective control over the expanding [electricity] system. …Other participants … demurred. … The elite politicians and civic reformers of the early twentieth century, for example, lost interest in utility affairs. … With their careers and millions of investment dollars on the line, however, power company managers naturally maintained their preoccupation with the business.
116
Beginning in the late 1990s, some states, but not all, undertook two major policy shifts that would produce feedback effects relevant to IOUs’ subsequent climate policy preferences. One was electric sector restructuring, which took place to varying degrees in seventeen states. 118 Renewed public attention to energy policy due to the Arab Oil Embargo led to a growing push to open the industry to competition. A key provision in the federal Public Utilities Regulatory Policies Act of 1978 paved the way for state-level restructuring.
Pressure from large industrial customers on state legislators led some states with comparatively higher electricity rates, including California and Massachusetts but not Oregon, to fully restructure their electricity sectors. While the mechanics of the omnibus restructuring legislation that seventeen states adopted looked different in each state, California and Massachusetts both took the significant step of breaking up their vertically integrated IOUs, requiring or generously incentivizing them to relinquish their electricity generation assets while retaining their monopoly control over transmission and distribution to end users. IOUs in both states were handsomely compensated for their “stranded assets,” and many consequently enjoyed significant windfall profits. 119
The second major policy shift was driven by increasing awareness of the perverse incentive IOUs had to avoid conserving energy. To correct this, thirty states adopted what are known as “decoupling” policies, 120 which divorced IOUs’ PUC-sanctioned revenue calculation from the actual volume of electricity they sold. 121 Decoupling is part of a suite of policies known as demand-side management (DSM), whose goal is to reduce electricity demand as opposed to greening electricity supply. California and Massachusetts, but not Oregon, went even further with their DSM policies, flipping incentives the other way so as not to merely neutralize IOU opposition to energy efficiency but to use ratepayer funds to allow IOUs to actually profit if their customers consumed less electricity. 122
That California and Massachusetts, but not Oregon, fully restructured their electricity sectors and adopted such generous DSM incentives for IOUs directly influenced IOUs’ subsequent preferences when it came to the proposed GHG policies. While California’s and Massachusetts's “complete” restructuring ended IOU ownership of generation, under Oregon's partial restructuring, IOUs remained vertically integrated, retaining generation operations (including coal and gas). Oregon's restructuring law was less about restructuring the IOUs and more about allowing the large, industrial customers (“traditional business” actors) to choose their preferred generation sources (lowering fuel costs, depending on their choices). 123 In addition, while all three states adopted decoupling policies, California and Massachusetts flipped the incentives the other way, allowing IOUs to profit from energy conservation; Oregon did not.
Consequently, in California and Massachusetts, IOUs calculated that the proposed GHG policies were, financially speaking, neutral-to-positive. A California lobbyist pointed out, “They did not have a bunch of coal assets that they were going to be on the hook for,” so Pacific Gas and Electric (PG&E) could afford to back the climate law. 124 This lobbyist added, referring to Southern California Edison (SCE) and San Diego Gas and Electric (SDG&E), the other two major California IOUs, “The others weren’t too far behind” in lending their support. It was much the same in Massachusetts, with an IOU lobbyist telling me, “We had no issues” with the GHG bill and a former utility regulator confirming, “The utilities … didn’t care because they didn’t own power plants here anymore.” 125
Furthermore, both states offered DSM programs rewarding IOUs for distributing less energy. “The decoupling thing makes it all a wash,” said a Massachusetts IOU lobbyist who explained that, for utilities, “decoupling makes energy efficiency a no-brainer.” 126 In California, a key legislative staffer described the GHG policy provisions as “things that they [California IOUs] were already doing, like energy efficiency, clean energy, [and] demand response,” nullifying IOUs’ potential resistance. 127
However, in Oregon, where IOUs remained vertically integrated and lacked comparable DSM incentives, IOUs viewed an environmentally strong GHG proposal less favorably. An Oregon IOU lobbyist intimated the companies’ annoyance, especially after they had ultimately supported the RPS bill: “Look, we’ve come a long way supporting a pretty big step towards good things for the environment. … You can’t ask us to come further this session.” Then, he added, “If you want to put in aspirational goals, fine.” 128 An environmentally weak GHG policy that gave environmentalists a superficial “win” would pass IOUs’ muster, but stronger legislation, particularly legislation that might lead to carbon pricing (as California's GHG bill did), was where Oregon IOUs drew the line.
When it came to the “true” preferences of green business actors, as expected, they were highly supportive of the provisions creating an environmentally strong GHG policy, and this was true in all three states. In California, green technology investors saw significant economic opportunity in an environmentally serious GHG policy. As one lobbyist told me, “They lobby heavily for mandates. … [They] see a big future in that stuff.” 129
In Massachusetts, a green business association submitted written testimony in support of the GHG bill, which read, in part, By making a binding commitment to reduce emissions, the [GHG bill] will send a signal to the world that Massachusetts is serious about clean energy, creating a market for our growing clean energy industries [emphasis added].
130
As another green business lobbyist put it, “Climate wasn’t really so much the driver” for his company's embrace of a strong GHG policy—it came down to the economic opportunities the policy created. 132 While environmental SMOs were also key supporters of environmentally strong GHG policies across all three states, the economic motivation was clearly far more salient for the green business actors lobbying in support.
Traditional business actors were, as expected, antagonistic toward environmentally strong GHG policies, believing such policies would cause them economic harm. Traditional business lobbyists explained their opposition in terms of industry scapegoating, downplaying the likelihood that even an environmentally strong policy would make a significant dent in climate change, and highlighting economic threat. A California lobbyist told me, “The oil industry felt like they were squarely the target,” 133 while a Massachusetts traditional business lobbyist claimed a state-level bill would “raise costs unnecessarily” and “wouldn’t make a damn bit of difference in the greenhouse gases.” He added, “If you look at the numbers, Massachusetts is a rounding error.” 134 A traditional business lobbyist in Oregon explained their opposition simply: the bill “would impose higher costs.” 135
Those traditional business lobbyists who understood the policy could not be totally stopped given such high levels of grassroots support sought instead to soften its economic blow, lobbying to weaken its environmental strength. “It basically came down to, what's the best deal we can get?” said one California lobbyist, continuing, “At the time, the best deal we could get was … a generous implementation process, a phase-in process that would allow us to deal with the economic consequences on a protracted basis as opposed to sort of cold turkey [emphasis added].” 136
Along with potentially raising costs, these actors worried that environmentally strong policy would render them uncompetitive with businesses in jurisdictions lacking comparable policies: “We can’t handle costs that are higher than competitive,” said a California lobbyist. 137 Trade exposure was another common concern, as reflected in the written testimony of traditional business actors. After listing “several negative effects” of GHG policies without “optional compliance,” a California-based motor manufacturing company concluded/threatened, “Such programs typically reward businesses that move their greenhouse gas-producing business to other states or countries.” 138 The Associated Industries of Massachusetts testified similarly, referring to that state's bill as the kind of “feel-good legislation” that drives “companies and residents” from the state, “discourages new investments in the state's economy, and places an enormous cost disadvantage on employers who remain here and must compete in the global marketplace [emphasis added].” 139 This language is a remarkable mirror of the green business arguments, which held that strong GHG policy would create economic opportunity and encourage new investments.
Once we understand the true, economic-based preferences 140 of all three segments of business—and, notably, the way in which IOU preferences varied by state, depending on the policy feedbacks of the preexisting regulatory regime—the explanation for the GHG puzzle is within reach. We can combine this understanding of preferences with an exploration of the relative political power of each segment in each state, and the degree to which that power was mobilized through lobbying. The California outcome—the strongest GHG policy—appears prima facie to be a case of green business prevailing over traditional business. But as Figure 3 shows, in California, the relative size of the two was comparable, and furthermore, my interviews with policymakers suggested both green and traditional business actors employed highly skilled lobbyists to advocate for their respective policy preferences. 141
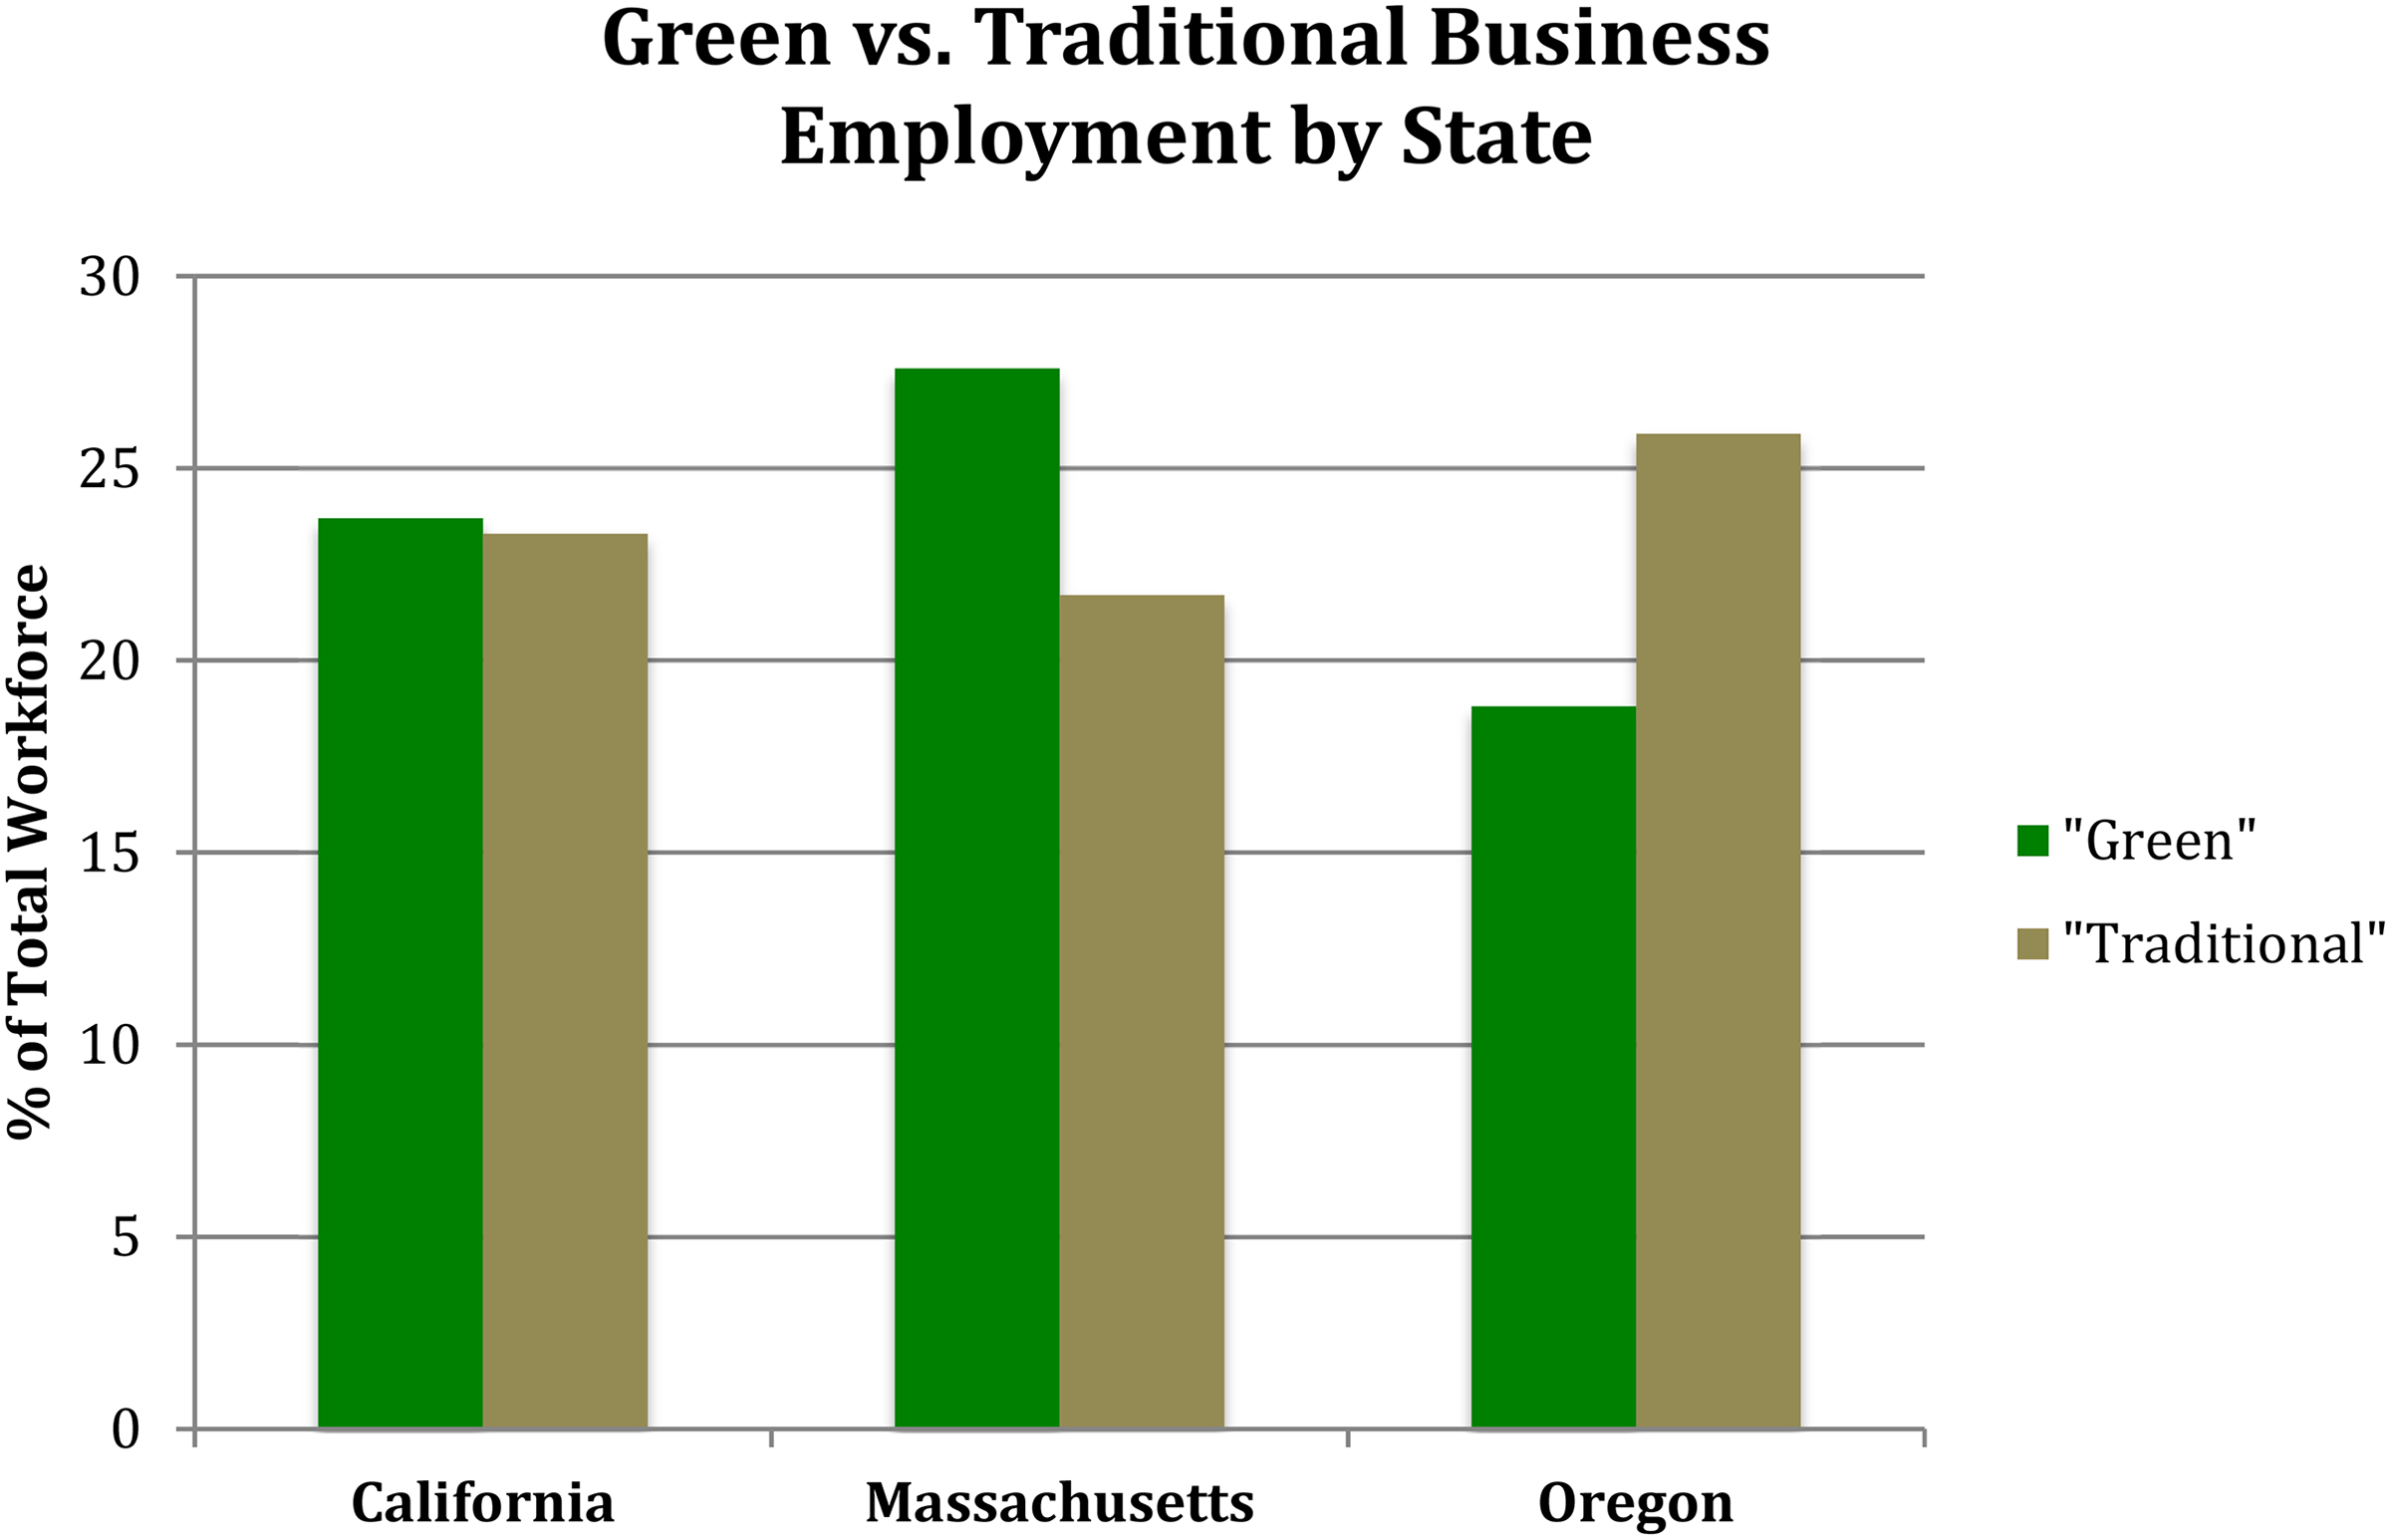
“Green” versus “traditional” business employment, by state. The source of the data visualized above is the US Bureau of Economic Analysis’s (BEA’s) annual state-level jobs data for twenty sectors/industry classifications from the year 2007, the median year in which the three states’ greenhouse gas (GHG) policies were adopted. For each corporate political actor that appeared in my data, I determined the appropriate BEA classification. This was an imperfect process, as some actors transcended multiple BEA classifications, and in other cases, a single BEA classification comprised businesses belonging to both the “green” and “traditional” categories. Nevertheless, of the twenty BEA sectors, five mapped on reasonably well to “green business”: “Information,” “Finance and Insurance,” “Professional, Scientific, and Technical Services,” “Educational Services,” and “Other Services.” Another five mapped on reasonably well to “traditional business”: “Mining, Quarrying, and Oil and Gas Extraction,” “Construction,” “Manufacturing,” “Transportation and Warehousing,” and “Accommodation and Food Service.”
I therefore argue that the environmental superiority of the California GHG policy, rather than being a triumph of green business over traditional, was due to California IOUs’ active lobbying for an environmentally strong policy, augmenting the coalition power of green business and environmental SMOs. IOUs lent their significant political power to ensure that traditional business actors and residential energy consumers, not themselves, would bear any of the policy's potential costs; and IOUs reaped the rewards of a public relations win and the potential to profit from energy efficiency incentives, at no cost, due to California's fully restructured electricity sector. As a California lobbyist recalled, “PG&E was actually in a lead role” and “definitely one of the lead advocates for enacting AB 32 [the California GHG bill].” 142
In Massachusetts, while IOUs would have had reason to be just as supportive given Massachusetts's similarly fully restructured electricity sector and DSM incentives, the IOUs neither actively promoted the GHG policy nor did they obstruct it. Instead, they were comparatively disengaged because of their focus on the simultaneously pending Green Communities Act (GCA). The highly prescriptive GCA would have had immediate, direct, and significant financial consequences for IOUs, making major changes to the state's RPS policy and to the DSM programs upon which IOUs depended for profits. Additionally, unlike California's news-making GHG bill, a top priority for political leaders, the Massachusetts GHG bill was regarded by insiders as a fringe effort, unlikely to pass. 143 Therefore, Massachusetts IOUs prioritized the GCA, only monitoring the GHG bill's progress and providing last-minute input once it appeared to be moving forward, but not actively promoting its advancement. 144 The result was less carefully crafted legislation, which contributed to a less environmentally effective policy, lacking the same explicit regulatory requirements as in California and containing GHG targets with questionable enforceability.
In contrast, the environmental weakness of Oregon's GHG policy came down to the difference in Oregon IOUs’ preferences. The weak outcome was further ensured by the imbalance in political power between traditional and green business actors. As Figure 3 shows, unlike in California, in Oregon, traditional business significantly outnumbered green business in terms of representation in the state's workforce.
My Oregon interviews also revealed a glaring asymmetry in lobbying power. The longevity of traditional business industries (such as timber) apparently fostered a certain political learning and the development of lobbyists’ skills/networks. 145 Exemplifying this, an Oregon state legislator spoke about the lobbyist for an influential traditional business association, calling him “the sort of big, most powerful conservative lobbyist at the time,” 146 while another Salem insider dubbed this same lobbyist “the Anti-Christ.” Begrudgingly, this respondent admitted, “he's a terrible dude, but very good” at his job. 147 By contrast, green business actors tended to be regarded as weak, not yet knowing how to “play the game.” An Oregon legislator commented, “They show up when they want stuff, but … we rarely see them working through the details and the nitty gritty, building the relationships, and demonstrating their credibility and commitment in the non-glamorous ways.” 148
Still, what stands out in Oregon was the IOUs’ effective mobilization of their preferences. While Oregon IOUs did not oppose the GHG bill outright, they were instrumental in ensuring it would be environmentally weak. When I asked an Oregon IOU lobbyist about the explicit statutory provision rendering the bill unenforceable, he actually claimed personal responsibility, confirming cheekily while pointing at himself, “Yes. Somebody may have written that in.” 149
RPS Policies: IOU Preference Not to Pay
When it came to the RPS policies, green business once again supported environmental strength for economic reasons while traditional business once again sought to stop/weaken the policy, also for economic reasons. Vulcan Power, one of many California-based renewable energy firms that provided written testimony on the initial RPS bill, wrote to the relevant committee that this bill is critical to expanding clean renewable power in California. … Our industry has invested billions of dollars in clean power infrastructure … Under [this bill], we will be able to expand providing much new reliable clean power throughout the state.
150
We encourage the Committee to send 838A [the environmentally stronger version of the legislation] to the House floor. … [It] will send a strong message to developers, like UPC Wind, that Oregon is ready [for business].
151
By contrast, traditional business actors in all three states preferred environmentally weak (or nonexistent) RPS policy because of their concerns about the potentially increased costs of doing business that a more stringent RPS policy could bring. Written testimony from a traditional business association in California, which was corroborated with interviews with lobbyists and legislators,
152
emphasizes concerns about how an environmentally strong RPS might lead to cost-shifting from utilities onto commercial and industrial customers: The bill's lack of an explicit [cost] cap … leaves ratepayers, both large and small users, open to increasing charges. … This measure, by specifying that an application by an investor-owned utility to allow construction of new transmission facilities … “shall be deemed necessary”… exposes ratepayers to unknown cost increases.
153
In Massachusetts, a traditional business lobbyist's resistance was similarly steeped in concerns about cost increases: “Electricity rates were very high … and they [investor-owned utilities] made these investments with the expectation that they would be able to rate-base it.” 154 This lobbyist went on to say that if there had to be an RPS, his clients would have preferred existing hydroelectricity be counted as an eligible renewable resource. 155 This would mitigate the risk of cost increases but, at the same time, weaken the policy environmentally because it would disincentivize the creation of new sources of renewables. And in Oregon, a traditional business lobbyist explained her clients’ concern with an environmentally strong RPS as “we thought it was going to increase electric rates. And we thought that the RPS didn’t recognize the amount of renewables that we already had.” 156
But whereas green and traditional business actors had consistently divergent preferences regarding RPS environmental strength because of implications for costs/profits, IOUs had little concern about environmental strength at all. They were confident that because of policy feedback effects of the regulatory regime that they had shaped over many decades, they would find a way to do well financially regardless. In the words of one Oregon lobbyist, “The [investor-owned] utilities … are rate-regulated. They’re going to get their costs compensated as long as it's written the right way.” 157 And indeed, in all three states, IOU lobbyists helped legislators write the bills “the right way,” with their bottom line being, “that all costs associated with complying with the program are recoverable in rates.” 158
An Oregon IOU lobbyist explained how a well-designed RPS policy would be “a good thing, long-term, for both our customers and our shareholders”:
159
If you’re a utility, you’re looking at what's your future in the current business world. Broadly speaking, again, renewables are good for utilities. … You don’t earn [a return] on fuel costs, anyway. … [If] you need more expensive—more renewables than otherwise, for the traditional business model, which is invest in capital and earn a regular return on it, that's a good thing.
160
Similarly, a Massachusetts IOU lobbyist said, “There are business opportunities in these types of [RPS policies].” 161 And a Massachusetts regulator noted, “[The IOUs] would do what they needed to do [to comply] and they would just pass it [the cost] through. … They actually get a return on what they put on their balance sheet, and we actually put an incentive in there to encourage them to do it. And so they weren’t giving up something for nothing.” 162
In the end, in all three states, the IOUs actively supported environmentally strong RPS policies because they were written in a way that held IOUs harmless financially, instead shifting costs/risks onto electricity consumers. Furthermore, IOUs used their outsized political and economic influence to secure extraneous provisions that allowed them to do better financially than they would have in the absence of the RPS policy.
The archival record in California made especially clear the evolution of IOU support. In the beginning, IOUs expressed “concerns” with early versions of the legislation, making clear that their future support would be conditional on a number of changes that would make the legislation more acceptable to them. For instance, PG&E wrote, PG&E has taken a position of Oppose Unless Amended. … [The bill] should be amended to clarify that all the reasonable costs incurred by utilities to meet the new RPS should be recoverable in utility rates, including the costs of any debt equivalence imputed to the utilities’ balance sheets by rating agencies as a result of increased reliance on long-term power contracts under the RPS.
163
However, by the end of the legislative process, in every case, the IOUs had gotten what they wanted and moved into the support column. PG&E had changed its tune, writing they were now “in full support” of the legislation, having “dedicated countless hours on this issue” and “[requesting Governor Davis’s] signature on this significant environmental measure.” 165 Sempra Energy, for its part, also requested a gubernatorial signature, writing, “This is an important bill, which accelerates compliance” with California's renewable energy goals. 166
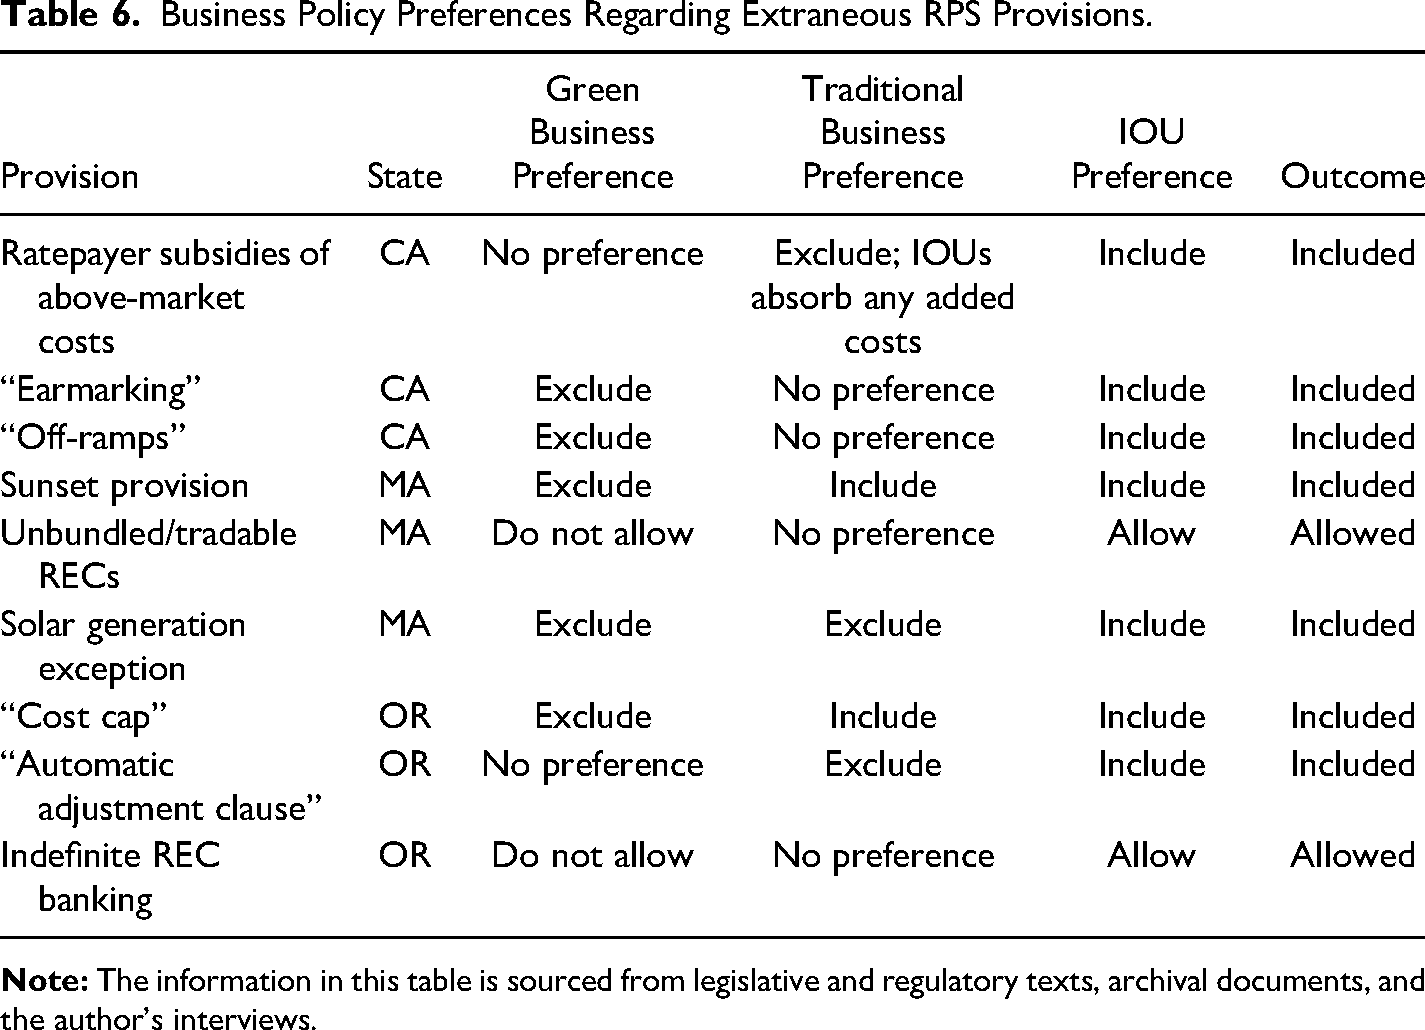
Once we appreciate that IOU preferences were entirely focused on who pays, not environmental strength, we can see IOUs’ unmatched political influence relative to other business actors in the way that IOUs achieved their highly sophisticated preferences in the detailed provisions of the policies, at the expense of both green and traditional business actors. We can also explain the emergence of those seemingly extraneous and unrelated provisions.
Table 6 shows these provisions, what each segment of business preferred, and how IOUs achieved their preference every time. When it came to ratepayer subsidies in California, a defeated version of the initial RPS bill (SB 532) was unsuccessful in courting IOUs’ support with a “cost cap” of $0.15/kilowatt-hour, only below which IOUs would be required to absorb any above-market costs of renewables. 167 Deeming this insufficient, IOUs secured a provision in the subsequent version enacted into law (SB 1078) stating that any additional costs (even below the cost cap) would be borne by ratepayers. The legislation directed the California PUC to adopt a “market price referent” (MPR), calculated based on the average price of electricity generated from a natural gas plant. 168 By statute, any costs of renewable energy contracts priced above the MPR would be subsidized by “supplemental energy payments,” funded by ratepayers through surcharges on utility bills. 169 The ratepayer money available in this fund served as the de facto cost cap of the RPS, leaving IOUs significantly better off and the public significantly worse off than they would have been under the prior proposal. 170 A public interest advocate identified this as “the first big concession” policymakers made to the IOUs. 171
Business Policy Preferences Regarding Extraneous RPS Provisions.
It would not be the last. When California's RPS was updated in 2006, IOUs secured an “earmarking” provision, over the objections of both green business and consumer groups.
172
IOUs wanted compliance flexibility, through a practice a California lobbyist explained this way: The utilities wanted to be able to take credit for procurement that they had done, where the project was not yet online. So, they wanted to be able to earmark, in advance, procurement from existing contracts to meet current compliance obligations so that they wouldn’t run afoul of potential penalties.
173
In 2011, the next update to California's RPS brought more concessions to the IOUs. They won an entire section of the final bill, §399.15, devoted to “off-ramps,” described by one public interest advocate as “a series of excuses for noncompliance.” 175 Essentially an insurance policy for the IOUs alone, off-ramps made it into the bill because policymakers understood IOUs were the only private actor with the power to derail the legislation altogether. 176
In Massachusetts, the provisions were different, but the story was similar. The initial RPS target adopted in 1997 was among the least stringent at the time. 177 Neither environmentalists nor green business was impressed with the “relatively trivial” 0.5 percent annual increase. 178 The initial law also contained a provision—an “insurance policy” included on account of IOUs’ lobbying—that the “feasibility” of the entire RPS would be revisited no later than 2009. 179
When the MDOER implemented the RPS in 2003, IOUs sought to maximize their compliance flexibility by convincing policymakers to determine compliance based on a market-based trading program rather than contracts for actual projects. A regulator involved in crafting the regulations told me green business actors were “very dubious that would work.” 180 Eventually, the six New England states would all develop RPSs and join together to form a single market for tradable RECs. Massachusetts IOUs benefited from less costly compliance, as they gained a much larger REC market, with many more potential trading partners with whom they could buy/sell/trade RECs, irrespective of the actual quantity of renewable energy they were delivering. 181
In 2008, when Massachusetts's RPS was revised, IOUs helped write a provision that proved highly lucrative (for them): an exception to mandatory generation divestiture. 182 Recall that Massachusetts IOUs had agreed, during restructuring, to exit the generation business in exchange for full cost recovery for stranded generation assets. Their calculus had shifted by 2008, with the costs of renewables falling, and the state planning to boost solar further with growth-accelerating policies. For IOUs, solar in 2008, unlike fossil fuels in the late 1990s, seemed like a lucrative investment; the problem was that existing law prohibited IOUs from owning any generation assets. Therefore, in 2008, IOUs convinced policymakers to grant a solar-technology exception to the 1997 restructuring terms. 183
Ratepayer advocates, SMOs, and certain segments of green business agreed the state needed more solar, but preferred expanding residential net metering. Net metering allows customers who install solar panels on their rooftops to sell back the excess energy they produce, thereby reducing their electricity costs. But customers’ savings are IOUs’ losses, since IOUs benefit financially from their monopoly control of the grid and their ability to recover transmission costs from the rate-paying public as a whole (a practice undermined by solar net metering). 184 Policymakers again adhered to IOUs’ preferences, allowing IOUs to generate utility-scale solar. 185
Finally, in Oregon, a similar story: IOUs supported the RPS, only after securing cost/risk-shifting provisions. One was the 4 percent “cost cap” inserted into §12 of the 2007 bill. 186 When I asked a green business lobbyist about that provision, she conceded, “It was necessary to get the bill passed.” 187 A second IOU-preferred provision was Oregon's “automatic adjustment clause.” This provision side-stepped PUC ratemaking norms, ensuring that any new RPS-related costs would be quickly passed on to ratepayers, not absorbed by IOUs’ shareholders. Ordinarily, state PUCs avoid “single-issue ratemaking,” favoring periodic rate cases in which an IOU is required to disclose its finances for review by the PUC and other interested parties, such as ratepayer/consumer advocates. These decisions regarding the revenue requirement (the costs IOUs are allowed to “recover” through electricity rates) are made over many months, based on IOUs’ actual/incurred costs rather than projected costs, which may be off. The process is lengthy and scrutinous.
In contrast, the automatic adjustment clause provides an “expedited review” of IOUs’ proposed rate increases. IOUs can now singlehandedly initiate these proposals at any time, based on any new cost incurred to comply with the RPS. Practically speaking, this means IOUs can request rate increases based on projected rather than actual new project costs. 188 Ratepayers miss out on the potential savings of below-projection actual costs, which instead become a windfall profit for the IOU. 189
Not only did ratepayer/consumer advocates oppose this, so did traditional business actors, which opposed the RPS from the start, but their opposition grew stronger once they became aware of this provision. 190 An IOU lobbyist told me the automatic adjustment clause “was one of the flash-points” of contention among policy stakeholders, leaving traditional business actors (industrial electricity customers) especially aggrieved. 191
Finally, Oregon IOUs seized an opportunity to reduce the financial risk posed by the RPS by convincing policymakers to allow them to bank RECs indefinitely. Shedding light on his legislative strategy, an Oregon IOU lobbyist explained that you want to try to figure out how to put in provisions that ameliorate risk. … That's fundamental. If you can craft situations where you can create opportunities, even better. You’re trying to think ahead. … It doesn’t do you any good to have RECs expiring. … [But] unlimited banking, and then you can stack those [RECs] up? That gives you flexibility. … It made a heck of a lot of sense to us.
192
Oregon policymakers knew they needed IOUs’ support to pass the RPS. Other actors were dispensable, but IOUs were the must-have. Indeed, in the estimation of one of the Oregon governor's top aides, the legislation passed “only” because the IOUs supported it. 194
Figure 4 maps our six state-policy cases onto the two-dimensional framework. All three states’ RPS policies are environmentally strong relative to the other thirty-plus states that have adopted them. In all three cases, though, costs are widely distributed. While green business benefits, IOUs have shifted costs onto others—residential ratepayers and virtually all traditional business actors that consume electricity. In terms of the GHG policies, California's is the strongest environmentally speaking, with costs again widely distributed among traditional business actors but not onto the few IOU firms. Massachusetts's GHG policy is environmentally weaker than California's and is less costly to traditional business, both because of its relative weakness and the fact that Massachusetts has far fewer of these actors in the first place (see Figure 3). Finally, Oregon's GHG policy is environmentally toothless, requiring no costs be borne by any business actors.
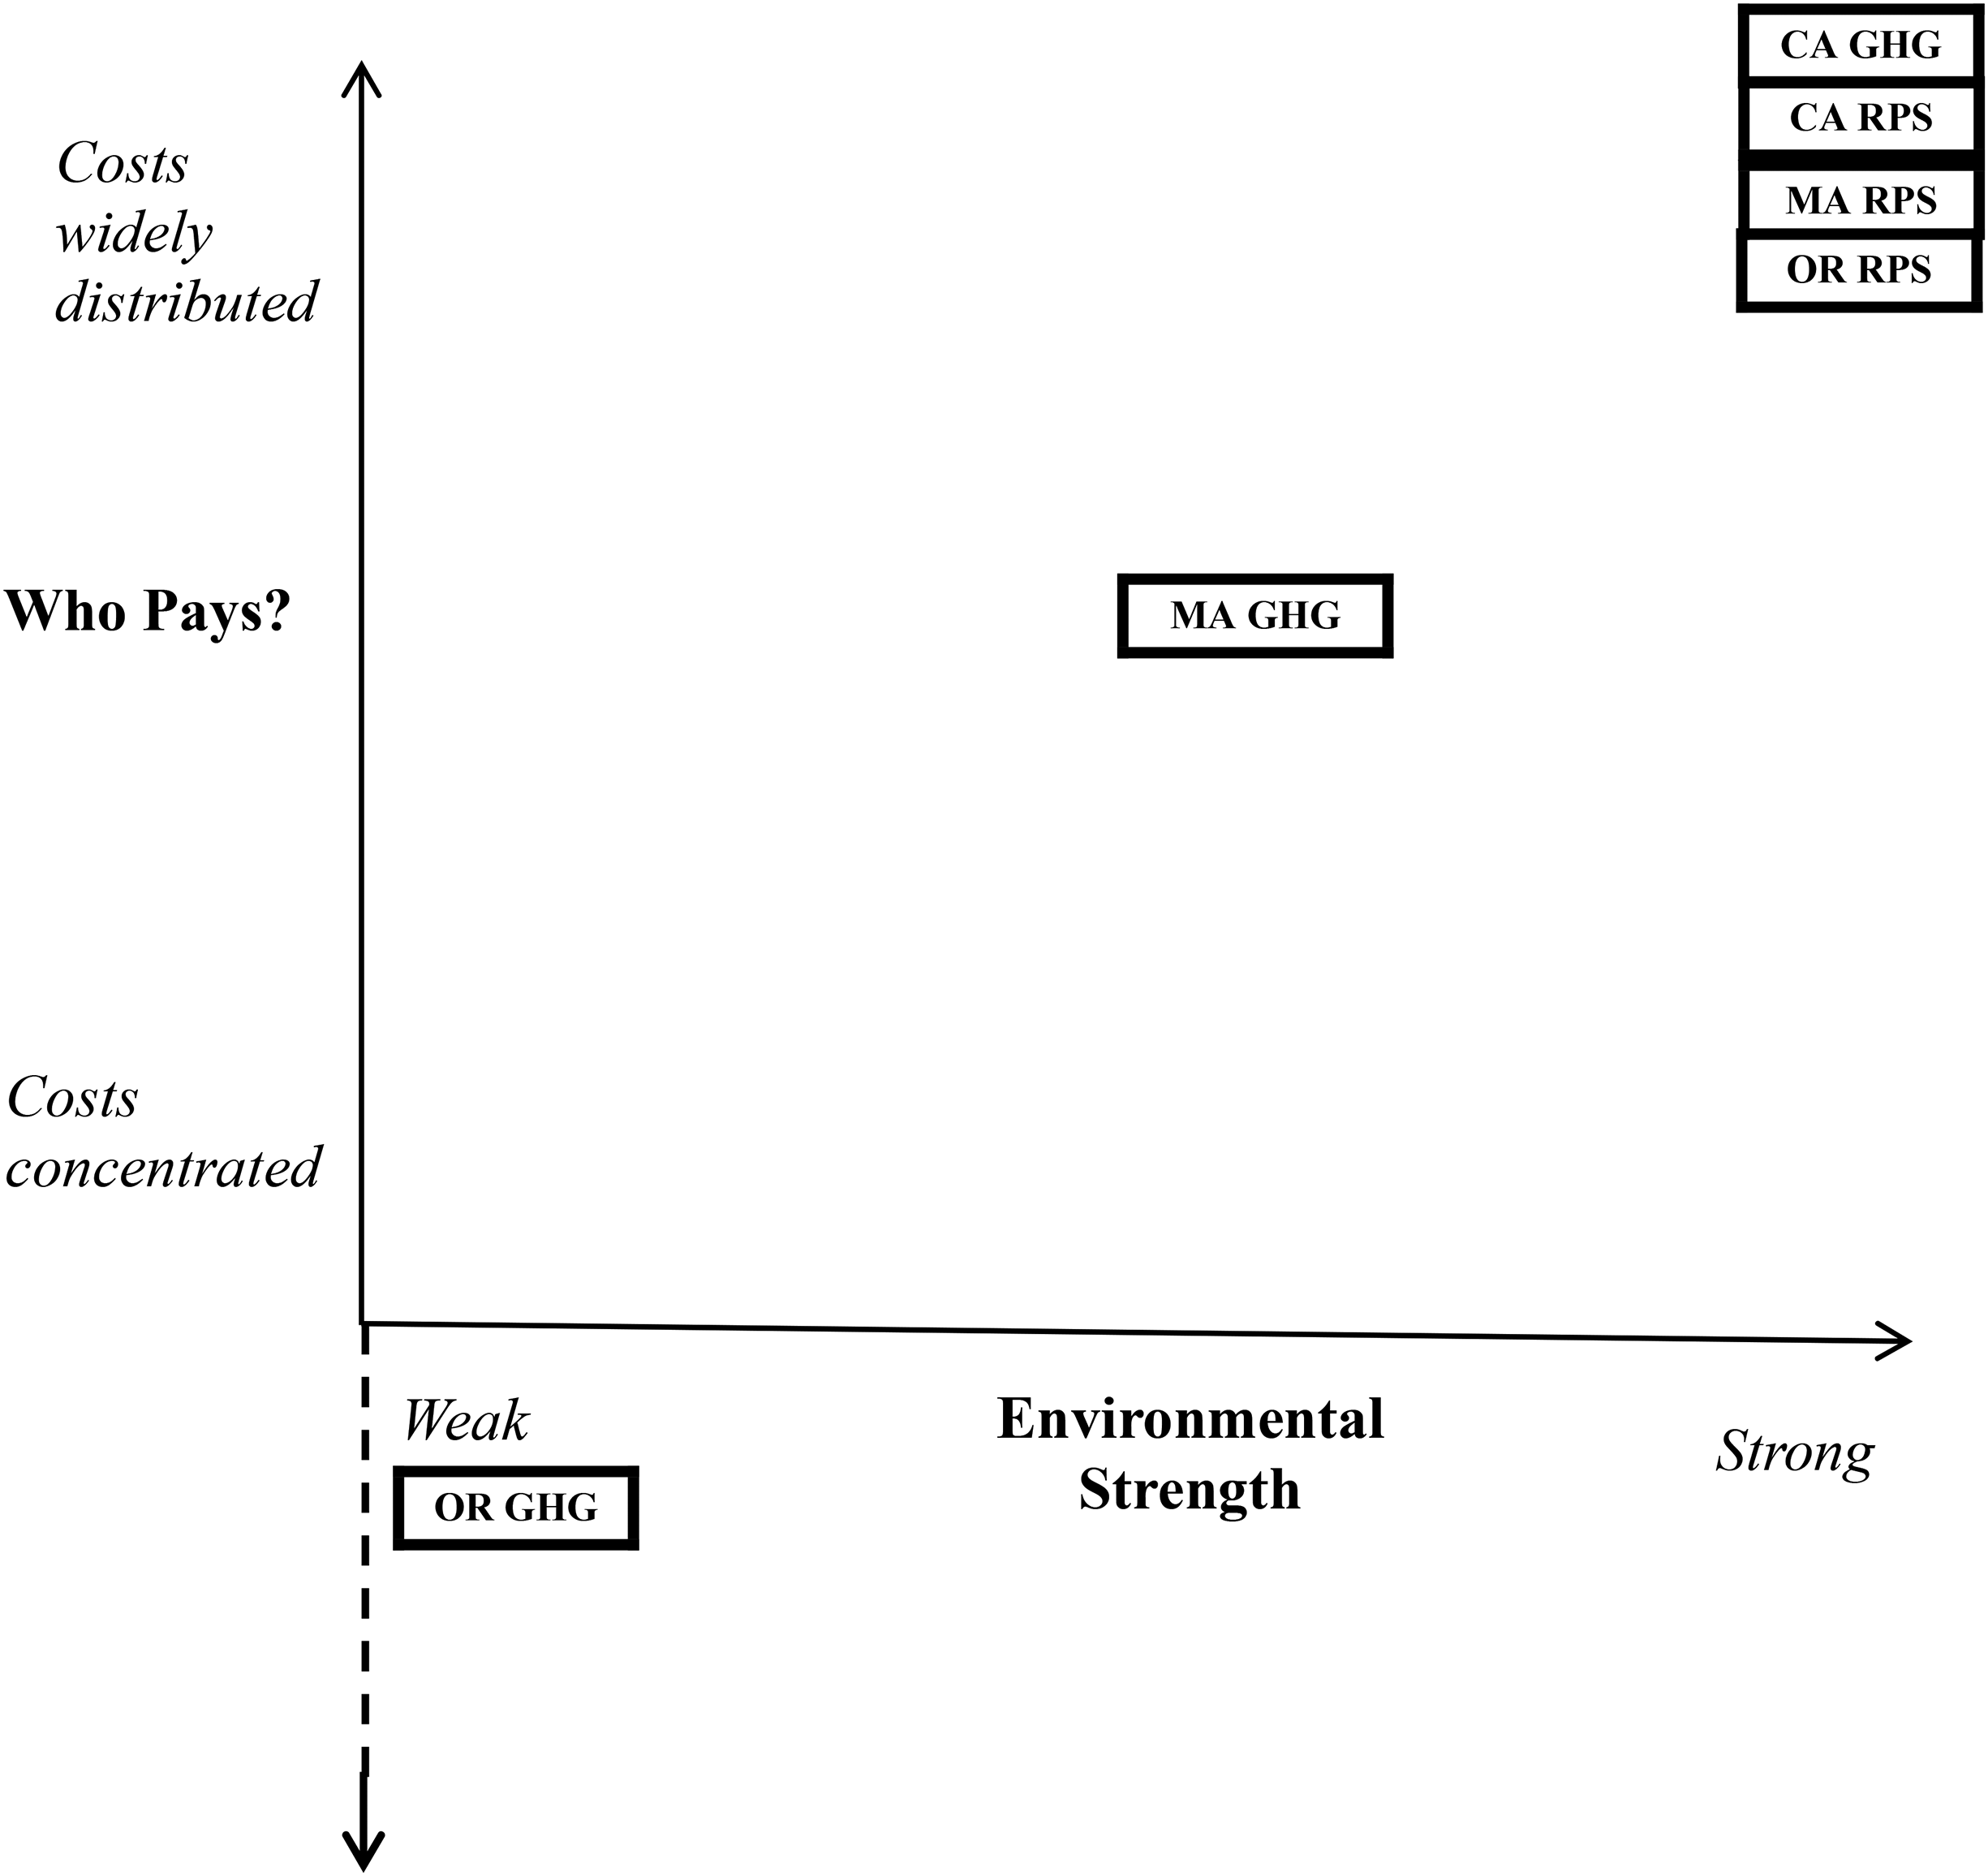
Two-dimensional policy outcomes (greenhouse gas [GHG] and renewable portfolio standards [RPS] cases in California, Massachusetts, and Oregon).
Discussion and Conclusion
In this article, I have (1) devised a method for mitigating the “problem of preferences” and (2) conceptualized a two-dimensional framework for policy analysis that considers both policy strength and “who pays.” 195 I argue doing both things is necessary to make sense of policy design variation in climate-policy-leading states. I have developed new theoretical insights about business preferences and power in American politics, finding both fragmentation of preferences and vastly unequal power among fragments. 196 Like Smith, I conclude that a divided business community is not a less powerful one. 197 But my analysis reveals a different way in which this is true, finding in this case that the corporations with the narrowest policy preferences were the most powerful.
Relative to Hertel-Fernandez, I offer a distinct, though not contradictory, view of the process by which business actors accumulate power. I show that “model bills,” Hertel-Fernandez's focus, are only one tool for private actors working to ensure policy comports with preferences. RPS policies are peppered with narrow but valuable provisions consistently benefiting a tiny subset of business actors. Whereas the strategy undergirding “model legislation” is to create a broad, replicable policy framework portable from one state to the next, 198 the logic undergirding IOU power is almost the opposite: pursue narrow provisions, uniquely tailored to a state's particular policy regime, quietly slipping them into larger policy frameworks.
Why were IOUs so much more influential than competing business actors? Based on existing literature and insights from my interviews, I propose four reasons: (1) size/representation, (2) lobbyists, (3) technical expertise, and (4) flexible forms of corporate organization. The middle two are most closely associated with a form of regulatory capture that the literature discusses, called “cognitive capture,” “in which regulators come to adopt the perspective of those they are supposed to regulate.” 199 The first and last are more structural sources of power. Future research might seek to determine which of the four are most important beyond the specific area of energy and climate policy, seeking a more general understanding of corporate political power than can be offered here.
Size/Representation
Structural theories of corporate political power postulate that a political economy's dependence on a given corporation/industry predicts its policymaking influence. 200 Society is highly dependent on electricity, thus we can expect IOUs will be powerful. Further, as some of the largest private employers, IOUs’ preferences should carry disproportionate weight with election-minded politicians. Indeed, in California, just three IOU firms (out of roughly 1,000,000 total firms in the state) employed about 0.25 percent of the state's total workforce; in Massachusetts, just two IOU firms (out of roughly 180,000 in the state) accounted for about 0.75 percent of jobs; and in Oregon, another two IOU firms (out of roughly 118,000 in-state firms) accounted for about 0.33 percent. 201
Lobbyists
The most politically effective corporations employ both “contract lobbyists” with broad relationships and “in-house lobbyists” with deep policy expertise. 202 IOUs were hardly the only business actors that employed many high-quality lobbyists, yet I found they were the most consistent in employing both a large number overall and the right balance between highly skilled “contract” and “in-house” lobbyists. IOU lobbyists were always regarded as highly influential by state policymakers, which was not true for most other types of corporate actors. 203
Technical Expertise
Hall and Deardorff's theory of lobbying as a “legislative subsidy” holds that lobbyists reduce the costs of legislating by providing legislators with information they need not spend time/money obtaining on their own.
204
Highly technical information is especially costly; legislators are reluctant to wade too far into the weeds. As sole owners/operators of huge portions of the country's electricity grid, IOUs are uniquely positioned to offer technical expertise.
205
As a PUC regulator explained, IOUs, certainly, have a vast depth of knowledge. … The labyrinthine complexities of rate design… give them a vast advantage at the negotiating table… the legislative arena, the regulatory arena, and even informal settlements. … They own and operate the system and know best how it works.
206
Taken together, lobbying resources and technical expertise that is so much more sophisticated than what is possessed by actors with competing policy preferences could easily result in a cognitive form of regulatory capture, especially over a long time horizon. As Rilinger (2023) points out, there is a temporal aspect of cognitive capture that should not be ignored. Given the longevity of the regulatory compact that IOUs themselves were the ones who established back in the early years of the twentieth century, it is easy to see how regulators might come to view IOUs’ proposed solutions to policy problems as the only viable way forward. 207
Flexible Forms of Corporate Organization
Corporations can operate multiple subsidiaries under a single parent company. Prechel and Morris show how the “multi-layer subsidiary form … create[s] more opportunities for management to engage in internal capital transfers.” 208 The political benefits of subsidiaries are accentuated when firms are primarily regulated at the state level (as IOUs are), yet the parent company transcends state boundaries, and IOUs are typically subsidiaries of multistate, national, or international parent companies. This corporate structure reduces investment risk by expanding the credit available to the parent company and facilitates subsidiaries’ ability to finance their growth. 209 An Oregon IOU lobbyist for a subsidiary of Berkshire Hathaway Energy, which operates subsidiaries in six states, explained that “it's one big company, with this footprint that straddles the bluest of the blue states and the reddest of the red states across the West.” 210
IOUs are not your “garden-variety” business actor; they are regulated monopolies with profits determined by PUCs. Yet Hart asserts that there is no such thing as a “garden-variety” business actor, arguing that the impulse to understand business through a generalized interest group theory “lead[s] us away from studying the most distinctive aspects of firms’ political attitudes and behavior.” 211
Although there is emerging consensus about IOUs’ outsized influence in energy and climate policy (which extends well beyond the specific policy cases analyzed here), 212 the social scientist working in other areas of public policy might be curious what IOUs are “a case of.” My goal in providing the above, tentative, four-pronged theory of the sources of IOUs’ power, therefore, is to encourage other researchers to explore how they might operate in other policy areas, to provide certain types of business actors with unparalleled political advantage.
When hypothesizing which firms/industries might have the greatest policymaking power relative to competing business actors in the same policy field, it may, counterintuitively, be more fruitful to consider the qualities that make types of business unusual rather than usual. The health insurance industry comes to mind as having certain “similarly different” characteristics affecting insurance providers’ power relative to others in the health policy field. Like IOUs, insurance companies are rate-regulated at the state level. They are not natural monopolies, though a few major players, such as Blue Cross/Shield, dominate the market. And, like electricity policy, health care finance is notoriously technical, which may privilege insurers over others, 213 similar to the expertise advantage held by IOUs. Prechel also points to the finance, insurance, and real estate industries as being heavily characterized by the “multi-subsidiary form” that has provided flexibility for IOUs operating in policy-divergent states. 214
Footnotes
Acknowledgments
I would like to thank Anthony Chen, Monica Prasad, Barry Rabe, Brayden King, Matto Mildenberger, Mark Mizruchi, Heather Schoenfeld, Leah Stokes, and Selena Zhong, as well as members of the Consortium on the American Political Economy (CAPE) “summer school” workshop, and the following workshops at Northwestern University and the University of Michigan: Comparative-Historical Sociology Workshop (Northwestern), Problem-Solving Sociology Workshop (Northwestern), Social Movements and Enterprise Workshop (Northwestern), Economic Sociology and Organizations Workshop (University of Michigan), Social Movements/Political Sociology Workshop (University of Michigan).
Declaration of Conflicting Interests
The author declared no potential conflicts of interest with respect to the research, authorship, and/or publication of this article.
Funding
This research was supported by the William A. Steiger Fund for Legislative Studies and the Graduate School, the Buffett Institute for Global Studies, and the Problem-Solving Sociology initiative at Northwestern University.