
Abstract
Candidate selection shapes descriptive representation in important ways; you cannot be elected without first being selected. Unravelling opaque candidate selection processes is therefore critical to understanding descriptive representation and political parties’ electoral strategies. Drawing on a new dataset of New Zealand candidacies from 1996 to 2020, we demonstrate variation in candidacy patterns across parties, ethnic groups, and time. We show that both the centre-left (Labour) and centre-right (National) have increased the ethnic diversity of their candidate slates over time, although Labour’s overall share of non-majority candidates is higher than National’s. Both parties have primarily used the party list, not district candidacies, to achieve diversification. This approach leads to some volatility in representative diversity, in part due to list composition practices that prioritise incumbents and cluster ‘ethnic’ candidates. Thus, while New Zealand candidate slates show notably high diversity by international comparison, non-majority candidates can nonetheless find themselves in electorally vulnerable positions.
Keywords
Introduction
Although historic underrepresentation of immigrant-origin ethnic minority and Indigenous populations in legislatures has begun to be reversed in recent decades, descriptive representation has grown gradually and unevenly across countries, political parties and ethnic groups (Bird et al., 2011; Bloemraad, 2013; Ruedin, 2013). Scholars identify many factors shaping representation of previously under-represented groups: electoral rules and reserved seats (Bird, 2005, 2014; Dancygier, 2014; Htun, 2004); citizenship rules (Gonzalez-Ferrer and Morales, 2013); the interest, resources and organisation of prospective representatives (Norris and Lovenduski, 1995); and possible bias from ethnic majority voters. To be elected, however, you must first be selected as a candidate, and political party elites are widely recognised as important gatekeepers in the pathway to election for aspiring candidates. Party recruitment and selection practices determine not only who is a candidate, but also the viability of their candidacy (Dancygier, 2014; Fraga et al., 2020; Hazan and Rahat, 2010; Norris and Lovenduski, 1995; Rahat, 2007). Understanding variation in representation outcomes therefore requires paying close attention to the pivotal stage of candidate selection.
In making candidate selection decisions, parties respond to electoral system incentives (Crisp, 2007; Hennl and Kaiser, 2008), other parties’ strategies (including ethnic parties), and demographic change, including geographical concentration of diversity and its potential electoral impact (Geese and Schacht, 2019; Pietsch, 2017a; Saggar and Geddes, 2000). More directly, selection outcomes are shaped by intra-party rules (De Winter et al., 2023; Hazan and Rahat, 2010; Reiser, 2014), the attitudes of party members and officials (Dancygier et al., 2015; Höhne et al., 2023; Reiser, 2022) and party elites’ perceptions of voter attitudes towards candidates (Brouard and Tiberj, 2011; Doherty et al., 2019; English, 2022). Where party selectorates must construct party lists, they face an ‘intersectional puzzle’ (Celis et al., 2014), seeking to balance various attributes (e.g. region, gender, ethnicity), while also considering other (sometimes competing) factors, such as candidates’ partisanship, popularity with voters and competency (Vandeleene, 2024).
It is challenging, though, to determine exactly which philosophies or strategies guide parties, since candidate selection generally occurs in closed settings. Whether undertaken by local nominating committees, by regional or central list-ranking committees, or by some combination, selection processes are opaque. While party constitutions outline the formal rules guiding parties, few studies have examined directly the informal criteria or strategies of selectorates working in the shadows of the ‘secret garden of politics’ (Marsh and Gallagher, 1988; see, however, Höhne et al., 2023; Reiser, 2022; Vandeleene, 2024).
One means of shedding light on party intentions is to examine the attributes of candidates who are selected. District nominations and party list positions are valuable and limited in number; ‘safe’ district or list candidacies are even more contested. Observing how parties apportion these candidacies among political aspirants offers insight into which candidate attributes are valued and how party selectors weigh up differing characteristics in constructing candidate slates. In turn, this highlights the role of selection practices in shaping descriptive representation outcomes. We examine this important stage of candidate selection through longitudinal analysis of candidacies in Aotearoa New Zealand. Specifically, we ask: How do patterns of candidacy vary across parties, across ethnic groups, and over time? What explains this variation, and what can we learn from it about parties’ selection strategies?
New Zealand is a fruitful case in which to examine candidate selection and its impacts on descriptive representation. As a settler colonial society that has also experienced high immigration and rapid diversification of countries of origin in recent decades, two types of descriptive representation are salient – that of Indigenous Māori, on one hand, and ethnic minority populations of migrant origin, on the other. Distinctive party and voter incentives, political histories and institutional rules influence their respective representation patterns. For instance, the existence of reserved Māori seats in parliament and, for parts of the period under study, a Māori party (Te Pāti Māori), 1 shapes the modalities of Māori representation, 2 while also creating space in political discourse and practice for collective, identity-based representation for other groups. Liberal franchise rules allowing non-citizen resident visa holders to vote in national elections after just one year in the country give New Zealand’s immigrant population an electoral weight rarely enjoyed in other countries (Altman et al., 2023). While distinct normative justifications are offered regarding indigenous representation, 3 the country’s mixed-member proportional (MMP) electoral rules generate similar constraints and opportunities across groups; namely, the ability of parties to engage in ticket balancing across the list and single-member district (SMD) tiers. Moreover, parties construct candidate slates with a view to how they will represent the full range of social groups. It is therefore valuable to understand candidate selection practices over time and across all ethnic groups.
New Zealand has high descriptive representation of non-majority ethnic groups by international comparison (Barker and Coffé, 2018), but variation and volatility exist across parties, among ethnic groups, and over time. The 2020 election, for instance, produced a parliament that resembled the society it represents more closely than ever before, but this diversity was located overwhelmingly on the centre-left party benches. Moreover, while Māori and Pasifika are well represented in parliament, the Asian population remains under-represented, making it important to understand party incentives and mechanisms at work in selection of candidates across groups.
To answer our research questions, we constructed a new dataset of candidates in parliamentary elections from New Zealand’s first MMP election in 1996 until 2020. Here, we analyse candidacy patterns for the two largest political parties only, Labour and National, which compete actively and successfully in both SMD and list components of MMP. This permits analysis of how party practices interact with electoral rules and offers what we believe is the first major study of candidacy in New Zealand. We map patterns of candidacy by ethnicity, across the list and SMD components of MMP, between political parties, and over time, thereby contributing to scholarship on diversification and the relationship between candidacy patterns and representation outcomes.
The next section discusses expectations about parties’ role in shaping diversity in candidate slates and what we might expect to observe in the specific electoral context of Aotearoa New Zealand. After describing our data and methods, we present our findings. We first focus on describing patterns of change in candidate ethnicity since 1996, before assessing how the type and safety of candidacy varies by ethnicity and party. We conclude by offering tentative explanations for the differences observed, considering what the results suggest about parties’ underlying philosophies of representation, and discussing how our study contributes to the wider literature on candidate selection and descriptive representation.
Theorising Candidate Selection Practices and Patterns
Political parties and their officials are crucial gatekeepers in the process by which candidates emerge and are selected to contest elections (Dancygier et al., 2015; Höhne et al., 2023; Reiser, 2022; Tolley, 2019). The power they wield shapes candidate slates, determines the viability (safety) of candidacies, and, in turn, influences the configuration of skills, ideologies and identities represented in legislatures once votes have been translated into seats (Ceyhan, 2018; Rahat, 2007).
Mainstream parties have, for multiple reasons, increasingly paid attention to ethnicity in selecting candidates. First, as sustained immigration begins transforming the voter-eligible population (Ceyhan, 2021; Claro da Fonseca, 2011), vote-seeking party elites have electoral incentives to respond by presenting more diverse candidates, although the speed and extent of diversification may also be mediated by their beliefs about majority voters’ reactions. Second, normative arguments for enhancing descriptive representation may motivate parties. If members of previously excluded groups see elected representatives who share their descriptive characteristics, and whom they trust to represent their interests, their sense of belonging and view of political system legitimacy may be enhanced (Banducci et al., 2004; Mansbridge, 1999). For some parties, these normative justifications align with policy principles around inclusion, citizenship or multiculturalism. Regardless of whether motivations are strategic or values-based, though, the descriptive characteristics of a party’s candidates constitute ‘selling points that help to establish representational ties with specific social groups’ (Ceyhan, 2021: 16) by signalling to voters who the party is, whom it values and what its ‘demographic, geographic and ideological dimensions’ are (Reiser, 2014: 56).
Demographic transformation and changing representation norms might suggest inevitable change over time, but incentives to diversify are importantly mediated by inter-party competition and intra-party organisation. For instance, following the contagion logic identified in female representation (Matland and Studlar, 1996), some parties diversify only reactively, once other, first-mover parties have begun selecting diverse candidate slates and reaping the electoral rewards. Moreover, intra-party barriers to inclusion mean concerted efforts by party elites are commonly required to transform candidacy outcomes, even where societal diversity has begun making its way into party organisations.
While many complex incentives drive parties to diversify their candidate slates, our focus is not on explaining parties’ initial motivations, but rather how they go about diversifying. In other words, our starting point is that party elites have incentives to diversify their candidate selections and have increasingly sought to do so. Drawing on existing scholarship, we now develop a series of hypotheses to answer our questions about how diversification of candidate selection unfolds across parties, ethnic groups and time, as well as how parties use electoral system incentives and constraints to generate diversity.
In a first step, and before turning our attention to important partisan and electoral system factors, we consider the initial role of demographic change. Existing studies show a clear, albeit gradual and uneven, trend towards ethnic minority and migrant-origin citizens’ entry into electoral politics (Bird, 2005; Bloemraad and Schönwälder, 2013; Geese and Saalfeld, 2018; Pietsch, 2018). As diverse populations come to comprise a greater share of the voting-eligible population, we would in turn expect to observe some change in the candidate slates presented to voters, while emphasising that candidacies do not invariably translate into successful representation.
In New Zealand, there are particular reasons to expect non-ethnic majority candidacies to increase over time. The country has a high and rapidly growing non-Māori, non-European share of the population. 4 At the 2023 census, just 67.8% of the population identified with majority European ethnicities, while 17.3% identified as Asian, the group with the largest numeric increase since the previous census. Those identifying as Māori comprised 17.8% of the population, with Pacific peoples rising to 8.9% (Stats NZ, 2024). The foreign-born share (27%) is also high in global comparison (Productivity Commission, 2022; Stats NZ, 2020).
Diversification beyond the Māori and early British and Irish settler populations initially occurred slowly due to nineteenth- and early twentieth-century laws to exclude ‘aliens’ (Ip, 2015; McMillan and Hood, 2016) and ‘traditional source country’ policies that privileged immigration from the United Kingdom, countries in the White Commonwealth and Northern Europe (Spoonley and Bedford, 2012). However, reforms from the mid-1980s eliminating preference country policies in favour of a skills- and points-based system led to rapid diversification of source countries. Whereas immigrants from the UK and Ireland comprised 51.3% of the overseas-born population in 1986, by 2013, they made up just 26.5%. Conversely, those born in China/Hong Kong and India grew from 1.3% of the overseas-born population in 1986 to 9.6% and 6.7%, respectively. The Asian population is especially notable for its rapid growth over recent decades (notwithstanding roots in New Zealand dating back to the nineteenth century), internal diversity and a population profile shaped by policies that privilege highly educated, highly skilled and investment-based migration.
Separately, substantial migration from the Pacific began during post-World War Two expansion of the industrial sector and was also influenced by New Zealand’s colonial presence in the Pacific. Family migration, annual Pacific quotas and seasonal labour programmes exist separate from the points-based channel through which many migrant groups arrive. This population put down roots in New Zealand and ‘Pacific Islanders’ gradually became known as ‘Pacific people’ or ‘Pasifika’, the latter term associated with an overarching Pacific identity felt especially by the large New Zealand-born population. Both Asian and Pasifika populations have historically clustered in the largest city, Auckland: in 2018, it housed a third of New Zealand’s population, but almost two-thirds of the Asian (62.6%) and Pasifika (63.9%) populations (Stats NZ, 2019b). With immigration remaining high, and migrant-origin ethnic minority populations becoming established and enfranchised, we would expect increased nomination of candidates from diverse ethnic groups, consistent with incentives for vote-seeking parties.
In addition to demographic change, institutional features would suggest increasing non-ethnic majority candidacies over time. In 1996, New Zealand elected its first parliament under the MMP electoral system. The 120-seat parliament comprises 72 ‘electorate’ MPs (65 elected from ‘General’ SMDs, 7 from dedicated Māori SMDs) and 48 List MPs. As discussed later, the list tier provides non-majority ethnicities increased opportunities for election and offers parties a means of balancing their candidate slate. Indeed, the likelihood that a list-based proportional system would increase descriptive representation of Māori and other ethnic groups was one reason originally given in favour of adopting MMP (Geddis, 2006; Royal Commission on the Electoral System, 1986). While the existence of Māori seats means a distinctive logic and guarantee of representation has always existed for tangata whenua (people of the land), the list tier under MMP generated further opportunities and incentives for parties to select more Māori candidates. 5 MMP rule changes also provided for the number of Māori electorates, previously fixed at four, to change according to the number opting to register on the Māori electoral roll (Bargh, 2020). The number of Māori seats has since risen to seven.
For both Māori and immigrant-origin ethnic minority populations, an increasing number of candidates is therefore expected, although for migrant-origin populations, the similar timing of immigration policy liberalisation and introduction of MMP makes it difficult to disentangle the relative contribution of demographic and institutional factors. Examination of representation outcomes confirms growth over time. Prior to 1993 and 1996, respectively, New Zealand’s parliament had no Pasifika or Asian representation, whereas in 2020, Pacific MPs comprised 9.2% of parliament (slightly more than the Pacific population share of 8.1%) (Stats NZ, 2019b). Asian representation was also greater, although the long-standing gap between the Asian share of population (15.1% in 2018) and of parliament (6.7%) remained (Parliamentary Library, 2021). 6 Māori representation, which had grown substantially over three decades, sat at 20.8%, continuing to outpace Māori share of nationwide population (16.8% in 2018) (Stats NZ, 2019b). 7
As a result of the changing ethnic composition, and electoral incentives of the liberal franchise and MMP electoral system, we expect to observe gradual diversification of candidacies across the two parties:
Hypothesis 1: The non-European share of candidacies will increase over time.
In addition to overall patterns, it is important to explore variation in the speed and extent of political inclusion across ethnic groups and between parties.
The Partisan Politics of ‘Ethnic’ Representation
Studies of the uneven progress in diversifying parliaments highlight the importance of partisanship, with parties of the left often viewed as more likely to be the natural ‘home’ for ethnic minority candidates. This argument has both supply-side and demand-side roots (Eelbode et al., 2013). As many left parties were early advocates of immigrant rights and liberalising naturalisation policies, they were seen as ideologically committed to political inclusion in ways that might flow through to candidate selection. In Europe, immigrants were more likely to have the socioeconomic profile associated with traditional supporters of left parties (Hampshire, 2012; Saggar, 2000). Vote-seeking parties of the left would be expected to respond to minority voter support, and demands for representation, by selecting candidates who appeal to those voters.
With diversification of countries of origin, and with generational change producing locally born non-majority populations, the partisan alignment of these voters can, however, not be assumed. In New Zealand, while the socioeconomic profile and historic voting patterns among Pasifika would suggest a fit with patterns observed in international scholarship, the picture is more ambiguous for Asian immigrant populations arriving variously via student, family, skills and investment categories, as Pietsch (2017b) shows for Australia. Nonetheless, as parties of the left were pioneers in providing pathways into formal politics for recent migrant-origin populations in comparable settler colonial societies (Johnson et al., 2021; Pietsch, 2017b), we expect a similar pattern in New Zealand. Indigenous candidacies are not easily theorised based on existing scholarship that focuses largely on migrant-origin populations. However, given historical connections between Labour and the Rātana movement that consolidated Labour’s hold on the Māori electorates over several decades, and Māori support for both recognition (identity politics) and redistribution (distributive politics), we would similarly expect candidacy pathways primarily on the centre-left. Conversely, notwithstanding prominent Māori personalities in Aotearoa’s conservative political history, more recent shifts, which included National adopting policy to abolish the Māori seats and choosing not to contest Māori electorates between 2005 and 2020, suggest we should see fewer candidacies on the centre-right.
Party differences are apparent in representation outcomes. As noted, after the 2020 election, diversity was largely found on the centre-left: almost half (47.7%) of Labour’s MPs were of Māori, Pacific or another non-majority ethnicity. By contrast, the depleted centre-right National caucus (33 MPs, compared to 56 in 2017) was predominantly white and male —almost 91% of its MPs were Pākehā/European; 69.7% were men. We expect similar candidacy patterns:
Hypothesis 2: The centre-left party will have a higher share of non-European candidacies than the centre-right party overall.
The composition of lists and SMD nominations sends signals to prospective voters about a political party. As already outlined, changing demographic and electoral realities incentivise parties to present a more socially representative candidate slate in order to attract votes from ethnic communities, but also from majority voters with a cosmopolitan outlook (Dancygier, 2017). It is, however, far from evident that these candidates will be selected into positions that see them successfully elected. Party leaders might diversify candidate slates, while not substantially altering intra-party power dynamics, and priority accorded to incumbents can influence the number and characteristics of new candidates, as party elites seek to nominate those who are ‘complementary’ to incumbents (Celis et al., 2014). Such symbolic inclusion, whereby a party is ‘mindful – but not too mindful’ of the need for diversity (Dancygier, 2017: 6), can also serve to bridge a possible gap between party elites who favour diversity and ‘cosmopolitan representation’, on one hand, and, on the other hand, voters who might support candidates ‘who look like themselves’ (Campbell and Heath, 2021). Thus, while we expect the share of non-majority ethnic candidacies to increase over time, barriers caused by incumbency and party hierarchies may result in candidate selection that amounts to ‘window-dressing’ (Eelbode et al., 2013), whereby newer, more diverse candidates receive only a limited number of electable positions.
Hypothesis 3: Non-European candidates will receive a relatively lower share of safe candidacies than European candidates.
The Impact of Electoral Institutions
The relative share of safe candidacies is also influenced by electoral system opportunities and constraints. List-PR systems have long been recognised as facilitating the entry of previously excluded groups, such as women, who struggled to be nominated and elected in plurality SMD systems. List-PR mechanisms offer opportunities for ticket balancing (Hennl and Kaiser, 2008), whereby informal or formal party rules in the list composition process ensure a representative offering across societal groups (Reiser, 2014). In the context of ethnic minority populations, however, SMD systems can have advantages if aspiring candidates enjoy support from geographically concentrated co-ethnic communities with clout in local selection processes (Dancygier, 2014: 256; Saggar, 2000; Trounstine and Valdini, 2008).
In mixed electoral systems, where SMD and PR tiers coexist and generate different, sometimes conflicting, incentives, the impact of electoral rules on candidate selection outcomes is not self-evident. Contamination effects between SMD and PR tiers are common (Ferrara et al., 2005), with possible consequences for candidate selection (Ceyhan, 2018), representation outcomes and even legislator behaviour (Crisp, 2007). In a closed list system like New Zealand’s, party selectorates have more power to determine the viability of candidacies, as selection to a safe list position usually guarantees the candidate will enter parliament (Ceyhan, 2018).
Where parties manage candidate selection across list and SMD tiers, there are several reasons for expecting the list to be the primary vehicle for ensuring descriptive representation. First, the relative concentration or dispersal of populations matters. Setting aside the Māori electorates (by definition majority Māori), the Māori population is relatively dispersed across General electorates, forming a majority in just one (East Coast: 51.5%). While Asian and Pasifika populations cluster in Auckland, 8 in only a handful of electorates are geographic concentrations sufficiently high to be obviously conducive to selection of migrant-origin minority candidates (Saggar, 2000; Trounstine and Valdini, 2008). Degree of heterogeneity within non-majority populations is also relevant, as some voters might not support an ethnic minority candidate over a majority candidate if they are not co-ethnic (Fisher et al., 2014). Faced with heterogeneous minority ethnicities in an SMD, party elites might therefore prefer to nominate a majority candidate.
Second, parties may be less likely to select ethnic minority candidates in SMDs if they believe they will be less viable than majority candidates, perhaps due to local hostility or voters applying an ‘ethnic penalty’ (Doherty et al., 2019; English, 2022; Fisher et al., 2014; Shah et al., 2022). While party elites might mistakenly impute voter bias (Brouard and Tiberj, 2011), some studies have shown evidence of voter discrimination (Auer et al., 2024; Portmann and Stojanović, 2022), which can also take the form of ‘friendly fire’ from voters of their own parties (in the case of right-wing parties (Besco, 2020)) or strategic discrimination by individuals who refrain from supporting a candidate if they fear others will not be supportive (Bateson, 2020). In light of these electability concerns, party elites in mixed electoral systems might prefer to select minority candidates on the list.
Finally, party elites can be guided by beliefs about the representational role candidates from different groups should hold; specifically, that the list tier of mixed electoral systems can and should be used to produce MPs who provide nationwide representation of, and accountability to, social or sectoral groups, rather than being responsible for geographic constituencies.
For these multiple reasons, parties might primarily use the list to diversify and to distribute viable candidacies among representational groups within the party:
Hypothesis 4: A higher share of non-European candidates will be selected on the list than in SMDs.
Nonetheless, in mixed systems many parties do consider dual candidacy important. In New Zealand, both National and Labour party constitutions now generally require SMD candidates to also appear on the party list unless they request a waiver to stand as ‘electorate-only’ candidates (Labour Party, 2022; National Party, 2023). While practice shows parties do regularly give dispensations for list-only and, less frequently, electorate-only candidacies, an emerging dual candidacy rule means we must examine the safety of nominations in each tier to fully understand party selections.
Internationally, where minority candidates win SMD nominations, they often run as ‘sacrificial lambs’ in districts that are unsafe for the party (Ceyhan, 2021; Lapointe et al., 2024), aside from those SMDs with a high share of co-ethnic population (Dancygier, 2013, 2014; Trounstine and Valdini, 2008). Selecting these candidates in unsafe or marginal districts limits intra-party contestation between newer and more established members over prized safe SMDs. At the same time, it allows parties to ‘demonstrate an openness to multiculturalism while having no risk of losing crucial votes’ (Ceyhan, 2021: 176); that is, inclusion is signalled, but safe districts are not put at risk. In mixed systems, those who run in unwinnable constituencies could be given high positions on the party list (Ceyhan, 2018; Crisp, 2007; Reiser, 2014), an example of contamination effects at work across tiers (Hennl and Kaiser, 2008).
As incumbents from the ethnic majority tend to dominate local candidate selection, and as party elites make strategic use of the list tier, we would similarly expect to see only gradual progression of non-European candidacies in safe SMDs.
Hypothesis 5: Non-European candidates will receive a relatively lower share of safe SMDs than European candidates.
As already noted, candidacy outcomes are shaped by intra-party organisation and selection rules, including how inclusive (of broader membership) the selectorate is (Hazan and Rahat, 2010; Rahat, 2007), and possibly where the balance of power lies between central party elites, who wish to diversify candidacies, and local parties that might resist this in individual candidate selections (Soininen, 2011). While practice varies, final list composition is usually heavily influenced by central party elites, in contrast to SMD selection where local party actors may hold relatively more power. In list construction, party leaders can chart a strategic course and use the distribution of viable list positions to send signals about which population groups the party wishes to appeal to or represent. Sometimes this involves targeted recruitment, beyond the party’s usual membership, of candidates without the history of party activism that local selectorates demand (Reiser, 2022). How high on the list non-majority candidates are placed, and how list positions are distributed among candidates from different social and ethnic groups, can shed light on individual party ideology, and differences in the power of various groups within a party (see also Hypothesis 2).
In New Zealand, while the constitution of the National Party (2023) does recognise member and supporter groups (Special Interest Groups), these lack institutionalised power, aside from being able to apply for voting rights at annual conferences. By contrast, Labour’s tradition of institutionalised ‘sectors’ representing specific interest or identity groups (in addition to the formal role of trade union affiliates) affords these groups more voice in candidate selection. The Māori (Te Kaunihera Māori) and Pasifika sectors have both demonstrated sustained and effective intra-party mobilisation and are represented on Council, which is also part of the Moderating Committee deciding final party list composition. 9
The strength of intra-party group mobilisation is not just about parachuting, ‘targeted recruitment’ or mobilising of supporters at local nomination meetings (Fisher et al., 2014; Sobolewska, 2013). Rather, sustained presence in a party’s organisational structure and the ability to build a supply of quality candidates over time matters. For this reason, and in conjunction with theories of left parties’ greater inclusion, we expect Labour to select non-majority candidates in safe positions more often than National.
Hypothesis 6: The centre-left party will give more safe candidacies to non-European candidates than the centre-right party.
Method
To test our hypotheses about temporal, partisan and cross-group variation in candidacies, we built what we believe is the first database of candidates for New Zealand parliamentary elections between 1996 and 2020. 10 Candidate names, along with their political party, SMD contested (if any), list position assigned (if any) and whether or not they won election, were obtained from publicly available NZ Electoral Commission data archives.
We then coded candidates’ gender and ethnicity (European, Māori, Pasifika, Asian or Other). This information was collected from publicly available and primarily, but not exclusively, online sources. In some cases, political party websites provide detailed biographies of candidates that indicate gender and sometimes ethnicity. Information from earlier elections was accessed via the Internet Archive ‘Wayback Machine’ and through digital archives of the National Library of New Zealand (NLNZ). Ethnicity was also established from candidates’ personal statements on public profile pages. Candidates with non-European ethnicity often mention their ethnic background in such statements, although this practice does vary by party. Where candidate information was not available on party websites or in the NLNZ physical archives of election paraphernalia, a wider search of publicly available sources was conducted. For instance, news articles about candidates were consulted, while the maiden speeches of successfully elected candidates sometimes provided further confirmation of ethnic background or identity. We maintained a list of sources consulted.
Similar studies have made coding decisions about race, ethnicity or ethnic origin based on names, name origins (Auer et al., 2024; Portmann and Stojanović, 2022), names in conjunction with neighbourhood demographics (Fraga et al., 2020), visible differences using photographs, personal knowledge of candidates, online candidate profiles, social media (English, 2022) or some combination of these methods (Black and Griffith, 2022; Janssen, 2022; Johnson et al., 2021; Van Trappen et al., 2023). To align as closely as possible with official practice in New Zealand of ethnic self-identification, and to limit subjective coding decisions or incorrect imputation of ethnic identity, we use only publicly available information in coding.
Specifically, we first attempted to code non-European ethnicity where it has been actively declared or mentioned by a candidate (self-identification), or where stated in media articles or other publicly available records (secondary identification). If no positive evidence or public statement about ethnicity could be found, indirect evidence about candidate ethnicity (such as name, image, place of birth) was used to inform the coding decision. We required at least two pieces of evidence to code using indirect evidence to ensure our decisions were triangulated (Johnson et al., 2021). Only 10 non-European candidates were coded using indirect evidence. If insufficient direct or indirect evidence was available, candidates were ‘default’ coded as being in the majority European category, on the basis that New Zealand Europeans often do not self-identify or reference their ethnicity. 11
A limitation of this approach is that it might undercount ethnic diversity overall or that the likelihood of candidates mentioning ethnicity might vary systematically by ethnic group or by party. A higher proportion of Labour than National candidates have declared ethnic identity; however, the difference is not statistically significant. We also ran our analyses including only candidates who were successfully coded for ethnicity (i.e. without any non-identified candidates who were ‘default’ coded as European). The results were very similar to those we present below, suggesting that any party (or other) differences in self-identification are not substantial for our purposes. The Supplemental Material provides further information on coding procedure and alternative results.
In addition to the candidate information collected, we calculated values indicating the extent to which a list or SMD candidacy can be considered ‘safe’. Using the method defined by Stoffel (2014), we calculated probabilities of re-election for each list and district candidacy, using regression models that incorporated previous election results. Our measure of candidacy safety is thus continuous and on the probability scale. To forecast probabilities of election in SMDs, the margins in the previous election were used to predict the probability of re-election of a candidate from the same party. For the party list, we used a regression model to predict the probability that a candidate in a given list position would be elected. We followed Frech (2016) in using the current election as an input to the regression model, along with the two previous elections. The current election is included because parties tend to have some idea beforehand of what the election result will be and plan their list accordingly.
In the analyses below, we display ethnic breakdowns of candidacies by party, and across different elections. While specific ethnicities were recorded in the dataset, for the purposes of this analysis we aggregated ethnic data to the four main official ethnic categories used by Statistics New Zealand (Asian, European, Māori and Pasifika). The small number of candidates whose ethnicity was coded as ‘Other’ (10 candidacies in total) were excluded from this analysis. In total, after these removals, our dataset comprises 1442 candidacies for 672 individual candidates.
To guide our analyses, additional data were collected from the Census and New Zealand Parliament on the relative sizes of ethnic groups in the national population and within SMDs. The Supplemental Material contains more details on census data.
Results
Candidacies by Ethnicity
We begin with statistics about the distribution of candidacies by ethnicity for the two parties. Table 1 shows the percentages of candidacies by ethnicity for each party, as well as the mean safety probabilities and percentage of successful candidacies for each ethnicity. 12 The table shows that, overall, the share of candidacies among the main ethnic groups roughly matches their share of the population. This is a striking finding, given the persistent under-representation of Indigenous and ethnic minority groups in candidate slates and elected office globally. There are, though, some important differences between parties. Labour has had a lower percentage of European candidacies than National (67.4% vs 79.6%), and a higher percentage of candidacies among all three other ethnicities (Asian, Māori, Pasifika) than National. A chi-square test indicates a statistically significant difference between the two parties’ shares of European versus non-European candidates (value = 26.59, p ⩽ 0.001), confirming Hypothesis 2.
Summary of Total, Safe and Successful Candidacies by Ethnicity and Party, 1996–2020 (Number of Candidacies in Parentheses).
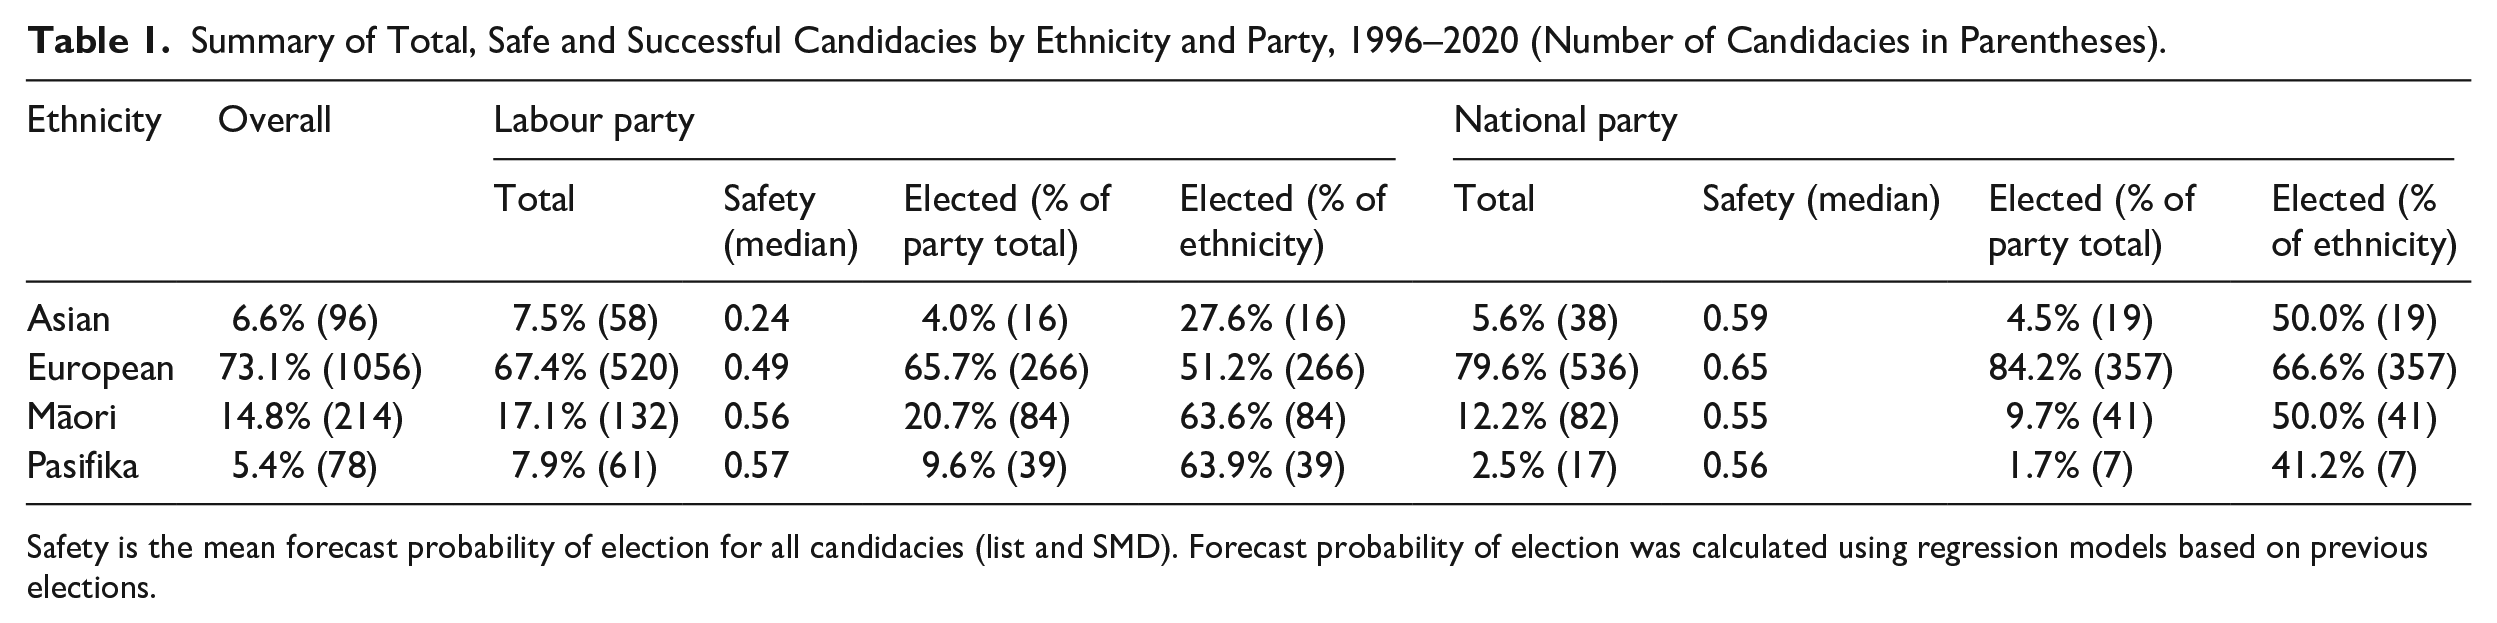
Safety is the mean forecast probability of election for all candidacies (list and SMD). Forecast probability of election was calculated using regression models based on previous elections.
Over the period under study, 84.2% of National elected candidates were European, and 66.6% of all European candidates standing for National were elected. Labour’s substantially more diverse candidate slate – compared to National – has been reflected in the ethnic makeup of its MPs. A higher proportion of Labour’s Māori and Pasifika candidates have been successfully elected than National. However, National has had more success in getting its Asian (and European) candidates elected compared to Labour.
In Figures 1 and 2, we show these patterns across elections. For comparison, we also include proportions of each ethnicity from the census. Figure 1 shows the percentage of European candidacies for each party at each election, as well as the overall percentage (both parties combined). There has been a relatively consistent decline in the percentage of European candidacies over time (and corresponding increase in non-European candidacies – see Figure 2). This trend holds for both parties, although the decline is steeper for Labour than for National. In 1996, 81.5% of Labour’s candidates were European, compared to 85.5% of National’s candidates. By 2020, Labour fielded 41 European candidates, or just 49.4% of their total, while 71.6% of National’s candidates were European. Moreover, National’s share of European candidates has been above the population proportion, while Labour’s share has been consistently below. These data support Hypothesis 1 and show a gap between the parties emerging over time that further supports Hypothesis 2.
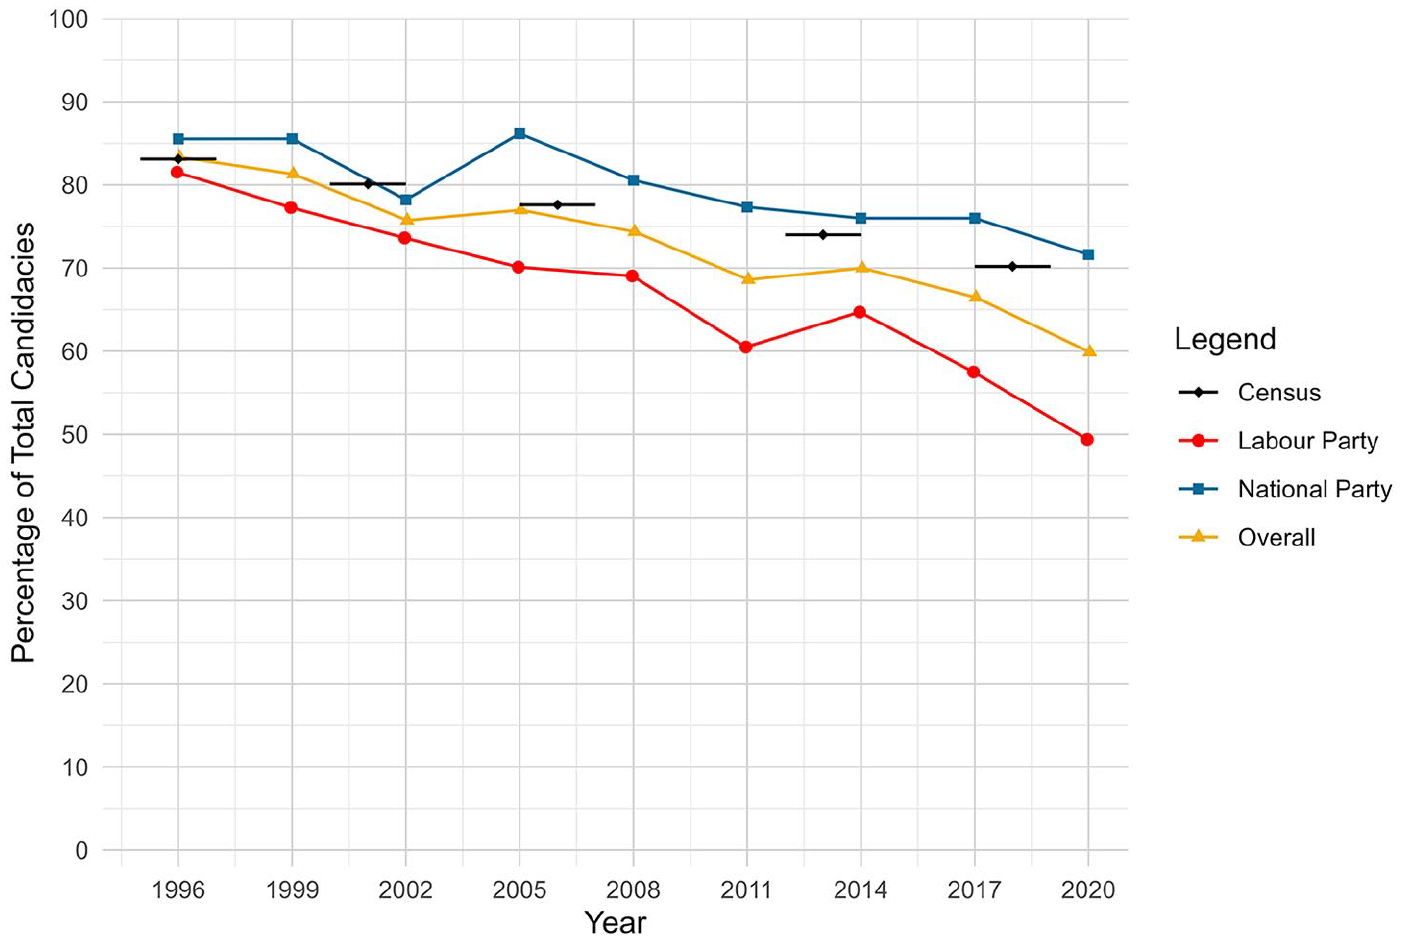
Percentage of European Candidacies by Year for National and Labour.
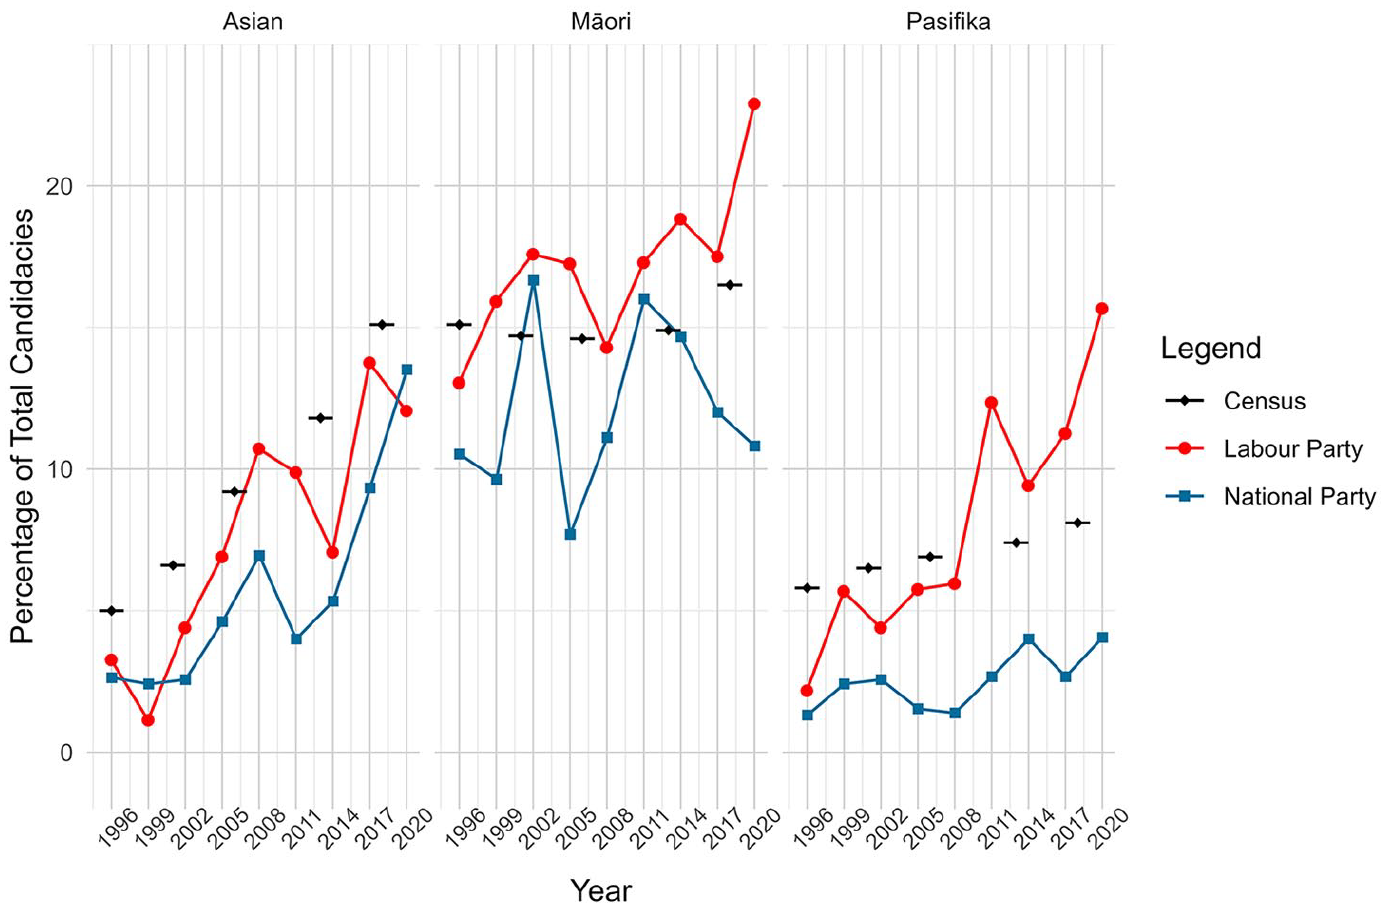
Percentage of Asian, Māori and Pasifika Candidacies by Year for National and Labour.
Figure 2 shows the percentage of candidates identifying as each of the three non-European ethnicities for each party. Most of Labour’s non-European candidates have been Māori. The remainder are roughly equally spread between Pasifika and Asian candidates, with both groups increasing incrementally over the period under study. In 2020, more than one in five Labour candidates were Māori, a proportion exceeding the share of Māori in the population. National’s non-European candidates have largely been Māori as well. However, from 2014, National’s share of Asian candidates increased substantially, and in 2020, the party fielded more Asian candidates than Māori. Very few National candidates identify as Pasifika.
Shares of Safe Candidacies
We now test Hypotheses 3 and 6, which relate to relative shares of safe candidacies for non-European compared to European candidates. Safety is measured as the forecast probability of election (based on the results of previous elections) for a candidate in a given SMD or list position. We first examine overall shares of safe candidacies (Hypothesis 3) before turning to differences between the parties (Hypothesis 6).
Figure 3 shows kernel density plots of forecast probabilities of election for European and non-European candidates. As can be seen, non-European candidates tend to have fewer candidacies with a high probability of winning compared to European candidates. The difference is small; however, the mean probabilities are 0.52 and 0.57 for non-European and European candidates, respectively. A Kruskal–Wallis rank sum test comparing the distribution of election probabilities for European and non-European candidates results in a value of 4.13, p = 0.04. The p value is below the conventional threshold for ‘statistical significance’, where a significant value indicates the distributions are different. Hypothesis 3, which suggested that European candidates would be more likely to receive safe candidacies than non-European candidates, is thus supported.
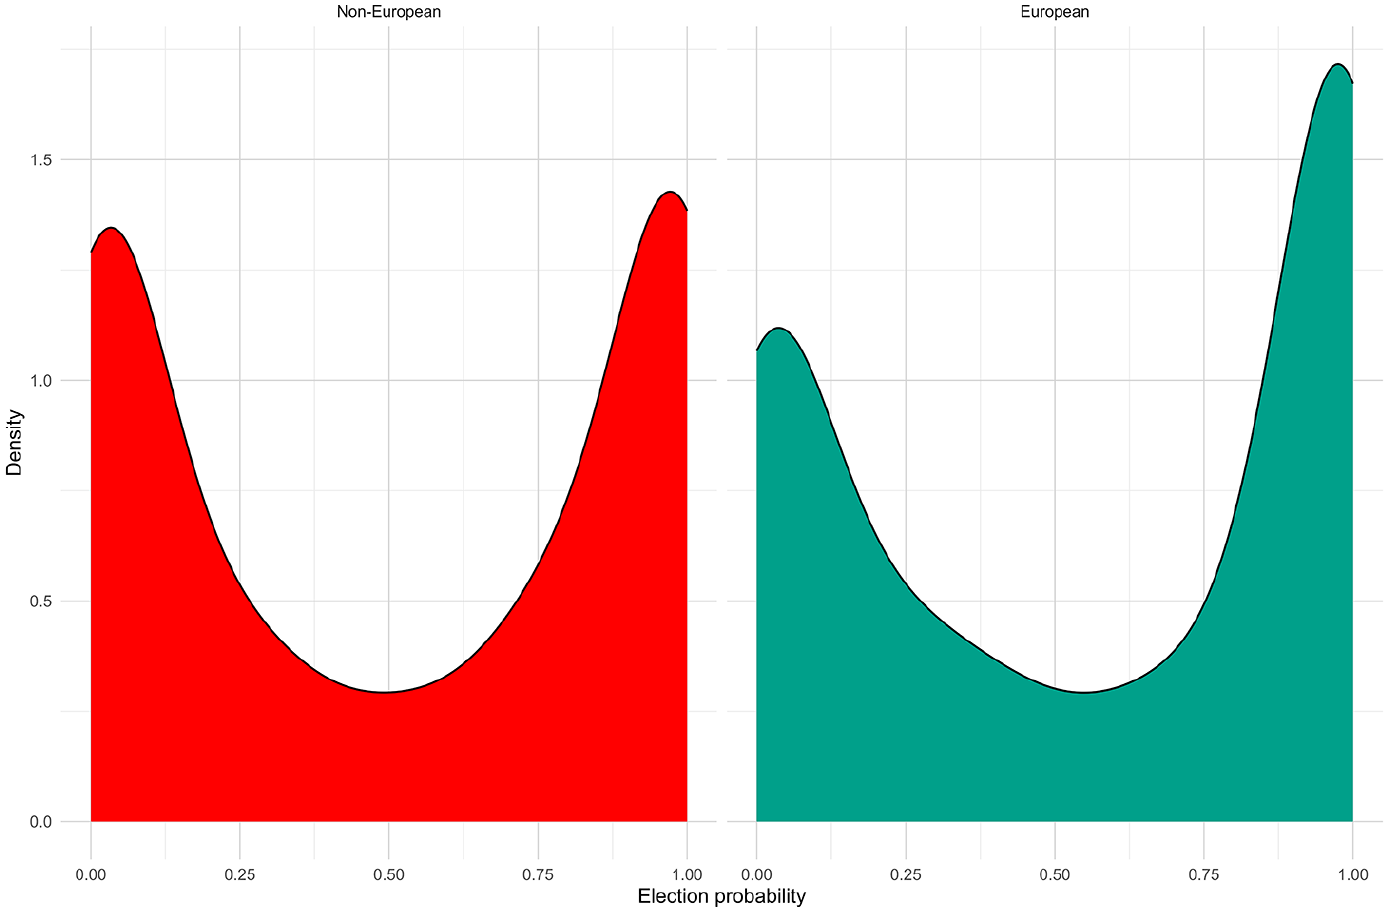
Kernel Density Plots of Candidacy Safety Probabilities from 1996 to 2020 for Non-European and European Candidates.
Figures 4 and 5 show the patterns of candidate safety and success over time. 13 In Figure 4, we observe the percentage of safe candidacies for European candidates trending downwards over time, although much more steeply for Labour than National. In fact, in 2020, under half of Labour’s safe candidacies were given to European candidates. This trend mirrors the population trend as shown in the figure, where the proportion of Europeans is declining. However, like the patterns seen in Figure 1, Labour’s percentage of safe candidacies for European candidates has generally been well below the population, while National’s has been above in most elections. Successful candidacies show a similar pattern, although there was an increase in successful European candidacies for National in the 2017 and 2020 elections. This discrepancy between the percentage of safe and successful candidates for National partly reflects their unexpectedly poor result in the 2020 election, which saw one of the most dramatic net vote shifts in a century (Vowles, 2020b).
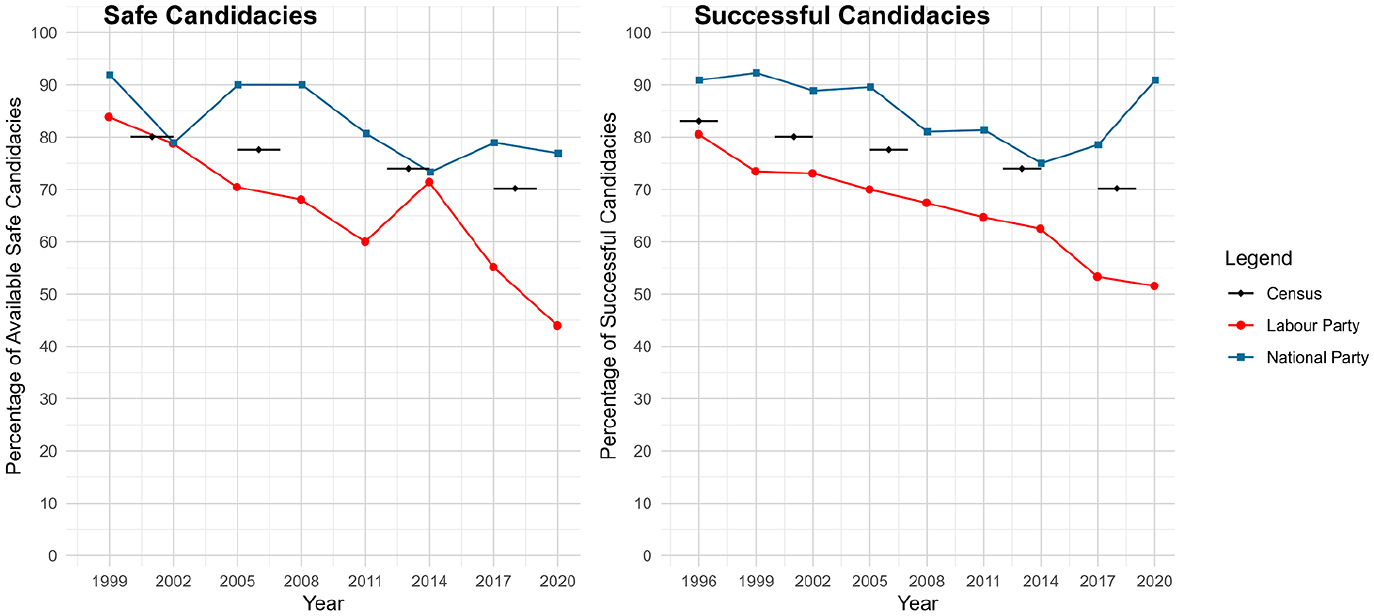
Percentage of Safe and Successful Candidacies Over Time Awarded to or Won by European Candidates Standing for National and Labour.
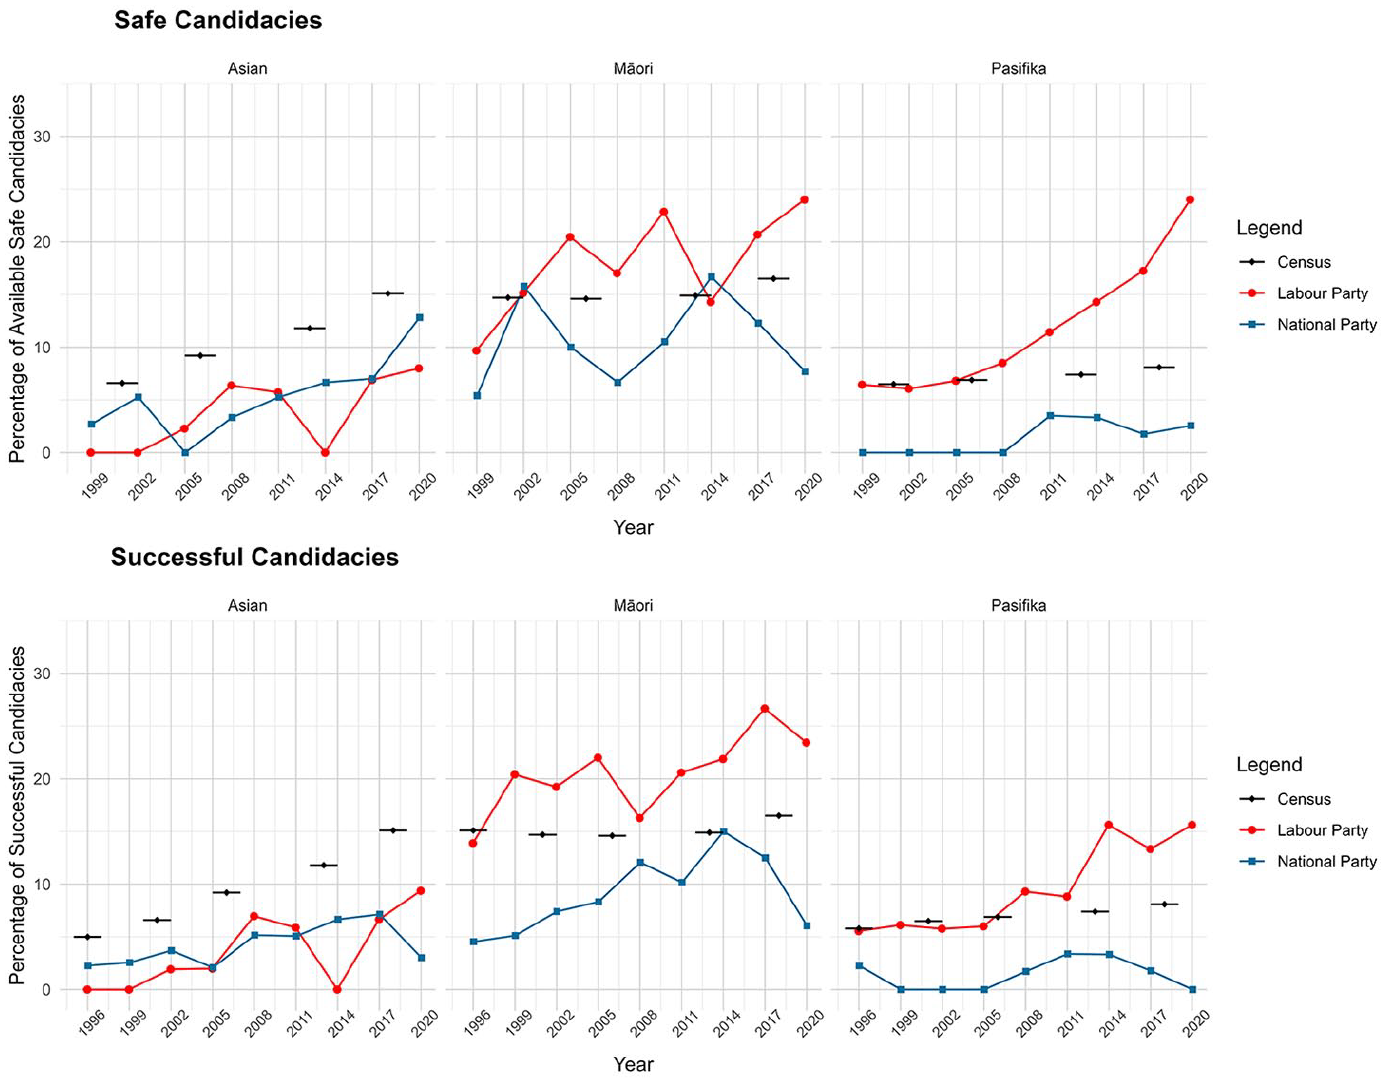
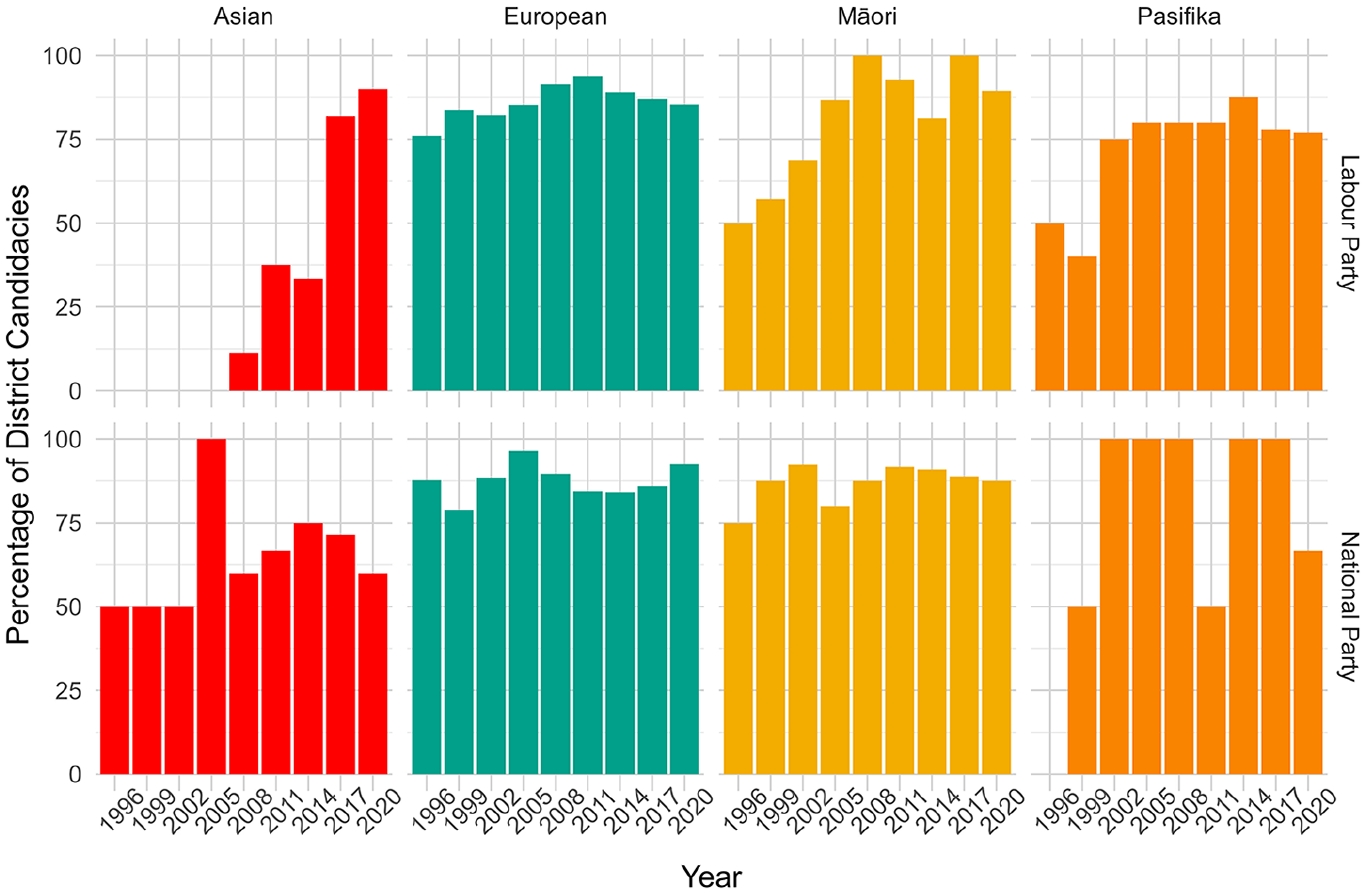
Percentage of Safe and Successful Candidacies Over Time Awarded to or Won by Asian, Māori and Pasifika Candidates Standing for National and Labour.
The change in safe and successful candidacies for Māori, Pasifika and Asian candidates over time is displayed in Figure 5. Labour has substantially increased the proportion of safe candidacies allocated to Māori and Pasifika, while safe candidacies for Asian candidates have mostly remained constant over time, and well below the proportion of people identifying as Asian in the population. National have increasingly given safe candidacies to Asian candidates, and in 2020 gave more safe candidacies to Asian than to Māori candidates. However, this increase has not kept pace with the rapid rise in the Asian share of the population. Overall, the gap between the proportion of Asian people in the population and safe Asian candidacies is larger than that between the Asian population proportion and all Asian candidacies, indicating both major parties have been slow to adapt to the ongoing demographic changes. For both parties, patterns of safe candidacies are similar to those for successful candidacies.
As shown in Table 2, the overall pattern of safe candidacies is complex. On average, European National candidates have safer candidacies than European Labour candidates (mean forecast probability of election of 0.65 vs 0.49 for Labour). Non-European candidates standing for National do, however, have a higher probability of winning election than non-European Labour candidates (0.57 for National vs 0.49 for Labour), although the difference between the two parties is not statistically significant. 14
Mean Forecast Probabilities of Candidate Election (Safety) for European and Non-European Candidacies, 1996–2020, for National and Labour.
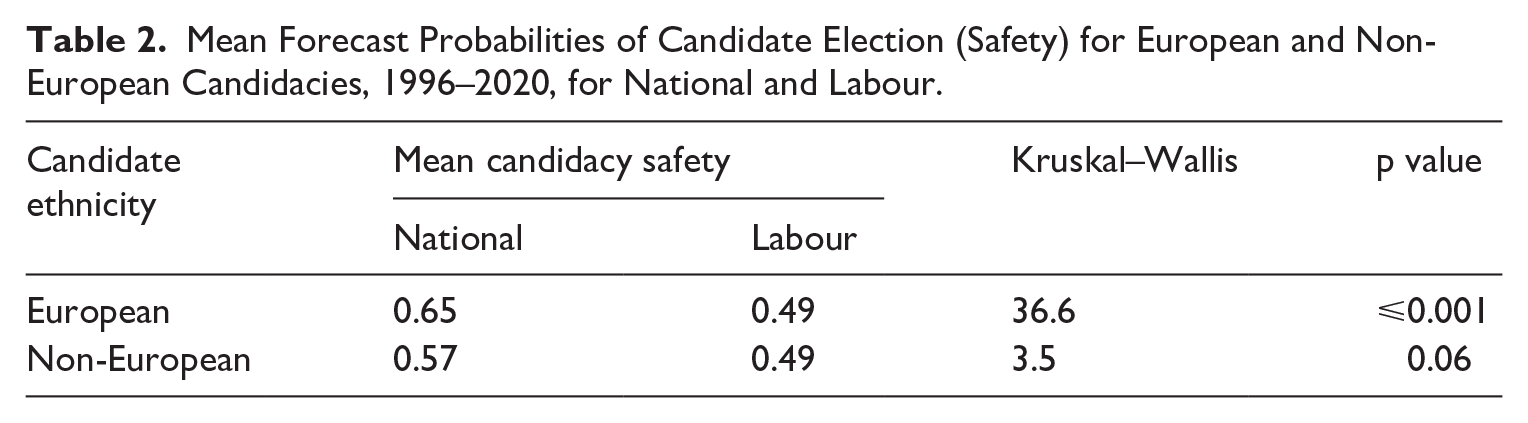
National tends to have a larger number of safe candidacies available, as it generally receives a higher nationwide vote share than Labour. However, Labour tends to divide the safe candidacies between European and non-European candidates more evenly than National, and thus Hypothesis 6 is supported. This pattern applies only to Māori and Pasifika candidates; National has increased the proportion of safe candidacies given to Asian candidates, and – as shown in Figure 5 – since 2011 has consistently allocated a higher proportion of its safe candidacies to Asian candidates than Labour has.
Single Member Districts and List Candidacies
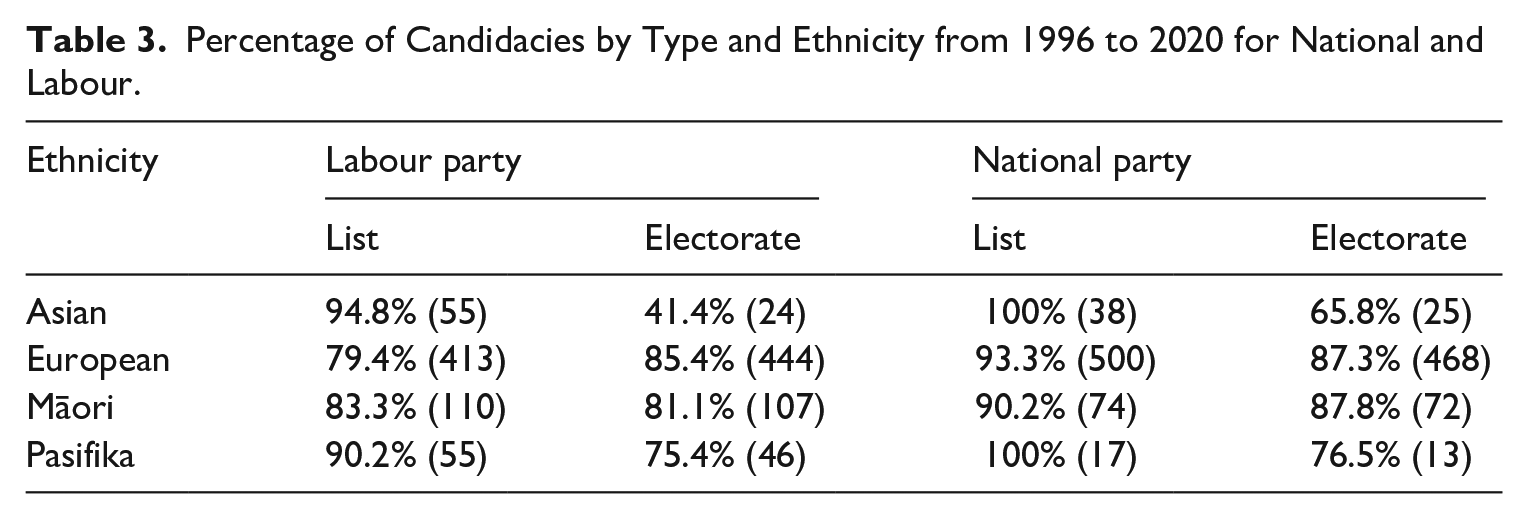
We now investigate the types of candidacies (list or SMD) that different ethnicities receive. In Table 3, we show the percentage of candidates by party for each ethnicity who stood on the list or in an SMD. Almost all candidates have a position on the party list and may also stand in an SMD. However, Pasifika and (particularly) Asian candidates for either party are far less likely than Europeans to stand in an SMD. Across the period under study, Asian candidates standing for Labour have infrequently run in SMDs. As shown in Table 3, only just over 40% of Asian Labour candidates have run in an SMD, while more than 94% have stood on the list, although – as discussed below – this pattern has changed dramatically over time. In some elections, some or all of Labour’s candidates in the Māori electorates chose to run Electorate-only campaigns and removed themselves from the party list, which explains some of the difference in Māori List candidacy shares between Labour and National. 15
Percentage of Candidacies by Type and Ethnicity from 1996 to 2020 for National and Labour.
A small number of General electorates have geographic concentrations of Asian, Pasifika and Māori voters high enough to incentivise parties to nominate candidates of a specific ethnicity and to contribute substantially to parties’ broader candidate selection strategies, yet such nominations still need to overcome internal party hierarchies and possible concerns about voters applying an ‘ethnic penalty’ (Doherty et al., 2019; English, 2022; Fisher et al., 2014; Tolley, 2019). 16
In Figure 6, we present the patterns of district candidacy over time. 17 As can be seen, Labour’s low overall number of Asian SMD candidacies was the result of few Asian candidates running in districts prior to 2017. This reflects the party’s practice in the first two decades of MMP of encouraging list-only candidacy among Asian candidates and promoting a nationwide ethnic community representational role, rather than the geographic focus privileged by SMD candidacy. However, in the 2017 and 2020 elections, more than 75% of Asian Labour candidates ran in SMDs, clearly suggesting evolution of party practice. Overall, only 74% of non-European candidacies (compared to 86% of European candidacies) have been SMD or dual candidacies, a statistically significant difference (chi-square test = 30.1, p ⩽ 0.001), supporting Hypothesis 4. However, this trend has largely been driven by Asian candidates, who in recent elections run more often in SMDs for both main parties.
Percentage of Candidates by Ethnicity Over Time Who Stood in an SMD.
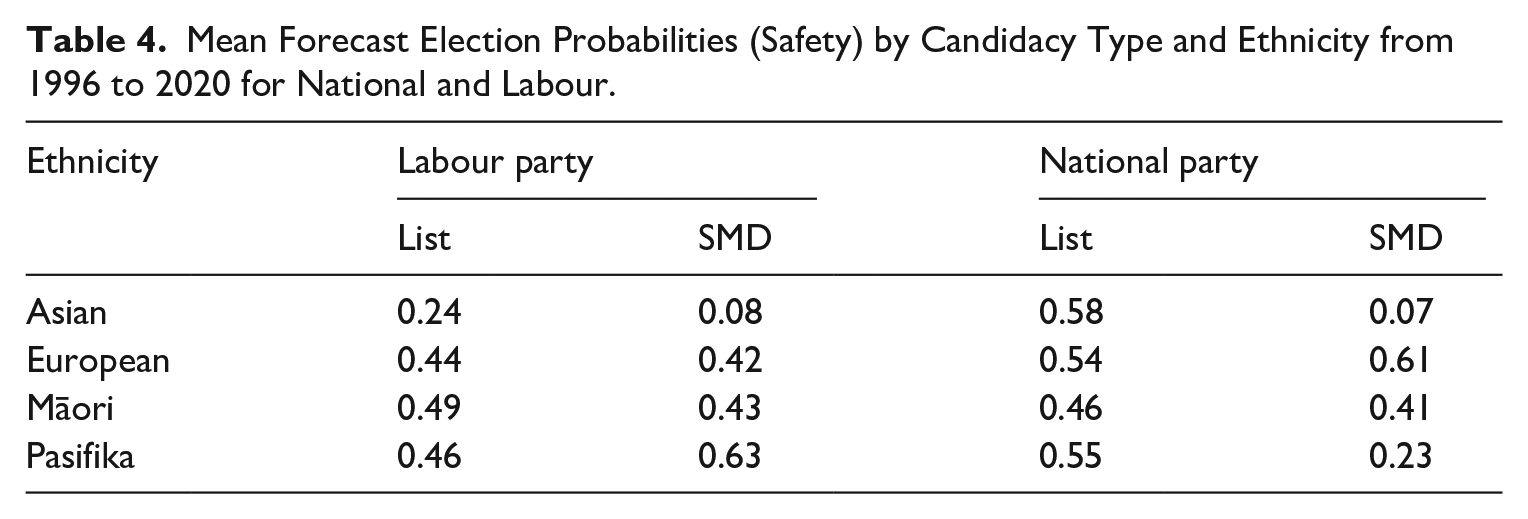
In Table 4, we present mean forecast election probabilities for list and SMD candidacies by ethnicity. With the exception of Pasifika candidates running for Labour, all non-European ethnicities receive safer list than SMD positions. The difference is especially stark for Asian candidates, who during the period under study did not have an SMD nomination with a probability of election above 0.42. Among Pasifika candidates the cross-party difference is striking. While Pasifika Labour SMD candidacies have a mean probability of 0.63, it is only 0.23 for Pasifika National candidates. Overall, European candidates are more likely to receive an SMD with a higher probability of victory than non-European candidates (Kruskal–Wallis rank sum test value = 20.1, p ⩽ 0.001), supporting Hypothesis 5.
Mean Forecast Election Probabilities (Safety) by Candidacy Type and Ethnicity from 1996 to 2020 for National and Labour.
Analysis of List Positions
In addition to the above analyses testing our hypotheses, we also investigated the extent to which non-European candidates have been ‘clustered’ on party lists. Parties may place candidates in winnable positions, but higher ranked positions are generally reserved for incumbents and have historically been occupied by those of majority ethnicity. This strategy typically ensures a substantial number of non-European MPs are elected, but maintains an intra-party hierarchy that has tended to be dominated by Europeans.
Figure 7 shows the rankings of candidates split into buckets of 10 list positions. We display the percentage of European and non-European candidates positioned on the list in each bucket across all elections from 1996 to 2020. If candidates were spread equally over the list, regardless of their ethnicity, the lines for European and non-European candidates would overlap. As can be seen in the figure, both parties do tend to cluster non-European candidates; European candidates occupy a higher proportion of the first 10 positions of the list than non-European candidates, although both parties consistently ensure Māori representation within this group. However, a large proportion of Labour’s non-European candidates (nearly 20%) are ranked between 11 and 20. Non-European candidates tend to receive lower rankings on National’s lists, with the highest proportion being between 51 and 60 during the period under study. Moreover, the lines for Labour are closer together than for National, indicating that European and non-European candidates are spread more evenly across the Labour list than the National list.
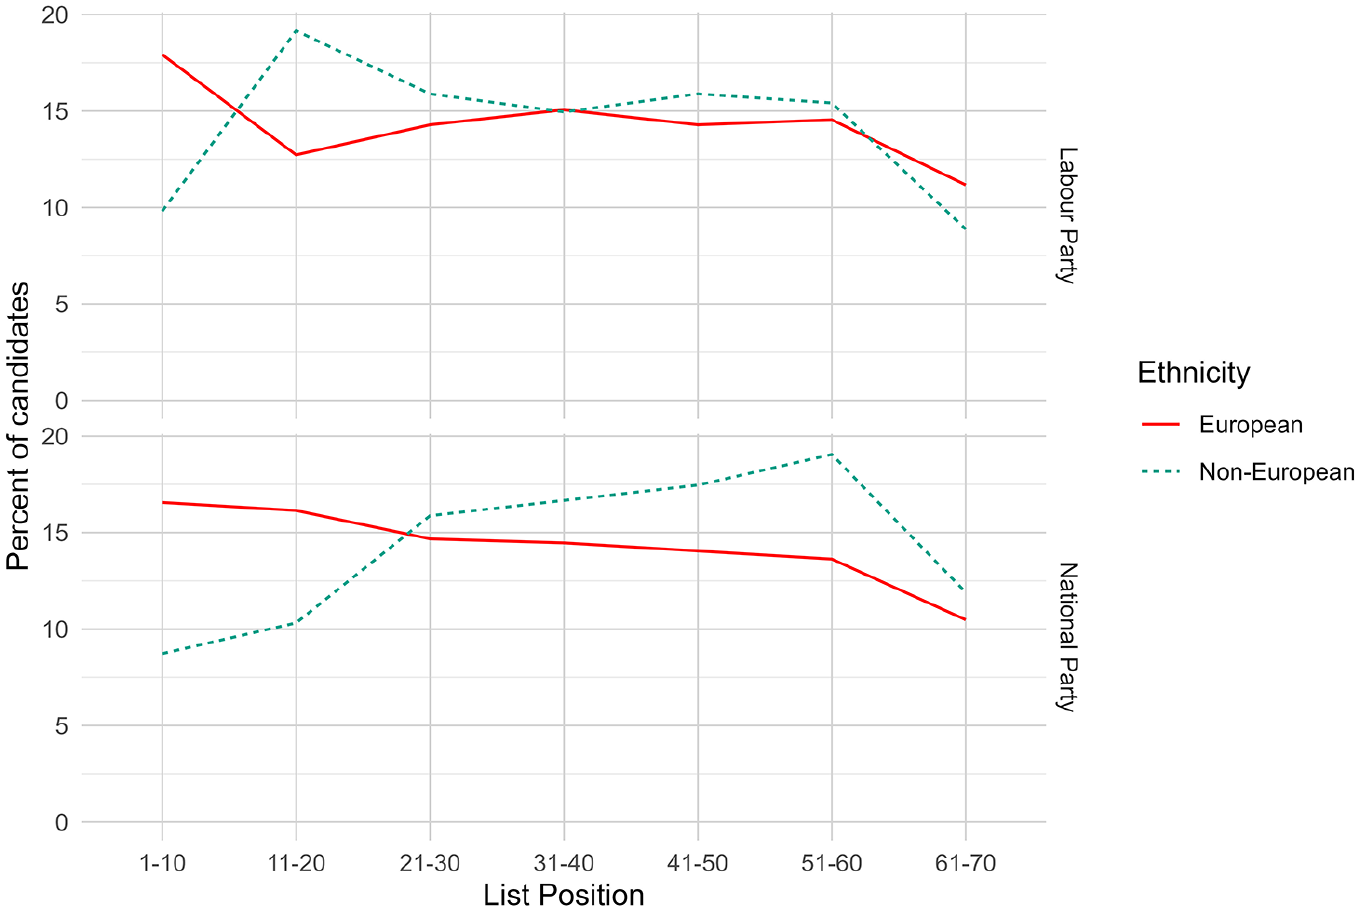
Percentage of European and Non-European Candidates from 1996 to 2020 in List Position Buckets.
In Figure 8, we show the same data for all four ethnicities. As can be seen, Asian candidates tend to receive low-ranking list positions for Labour, whereas Māori candidates are mostly ranked 40 and higher on National’s list. Interestingly, over 30% of National Pasifika candidates have been ranked between 21 and 30; however, it is important to bear in mind that the absolute number is extremely low – only 17 Pasifika candidacies featured on the National list across the nine elections analysed.
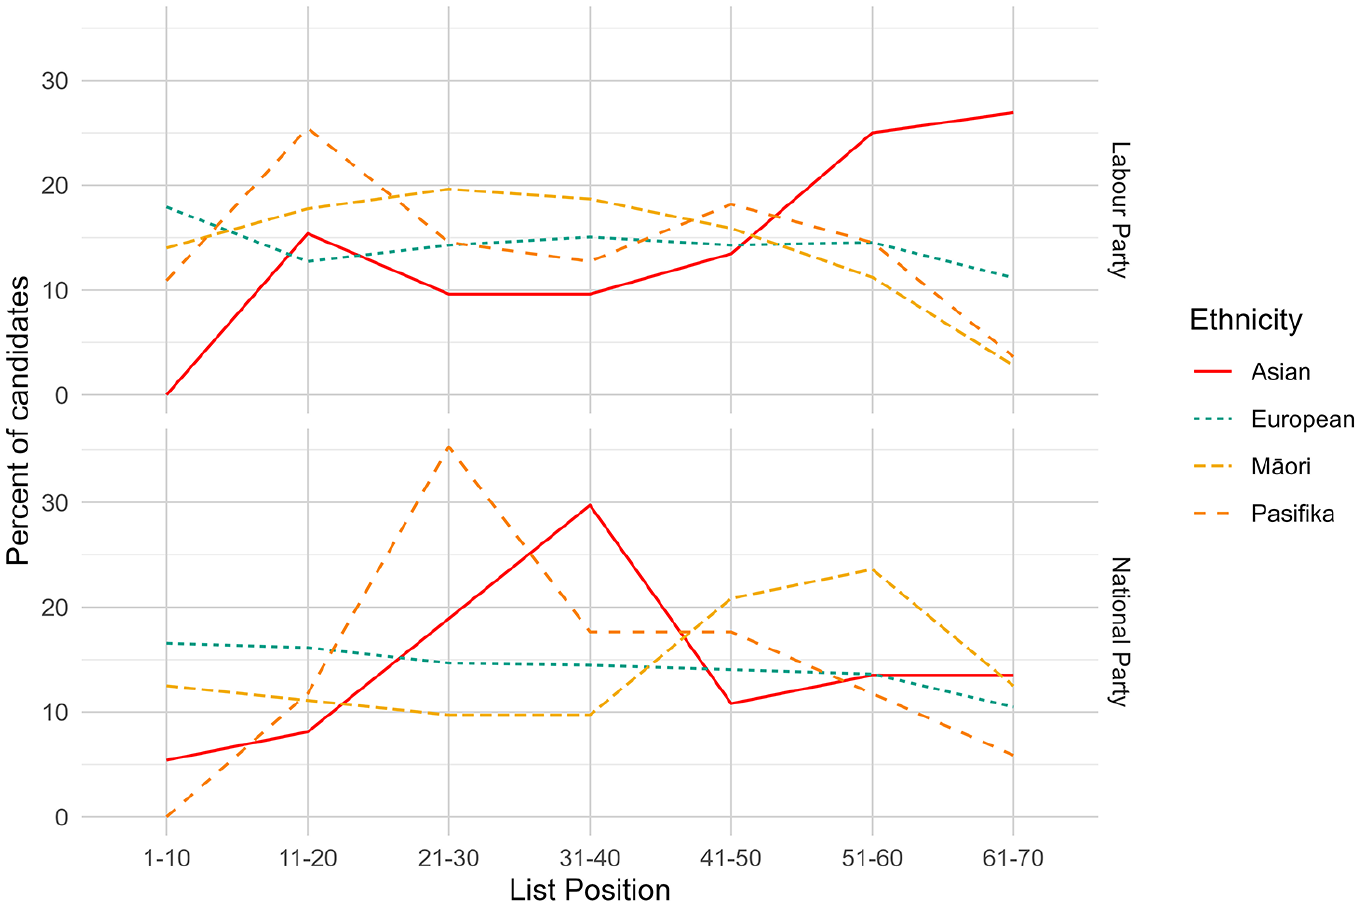
Percentage of European, Asian, Māori and Pasifika Candidates from 1996 to 2020 in List Position Buckets.
Discussion and Conclusion
The analyses presented allow us to substantiate, for the first time, diversification of the political system observed over three decades in Aotearoa New Zealand. These data contribute new knowledge to the literature on ethnicity and candidate selection from the New Zealand context, where multiple salient dimensions of descriptive representation (Indigenous and migrant-origin) are present. Complementing similar data collected in SMD systems (Johnson et al., 2021; Shah et al., 2022), we examined this in the context of a mixed electoral system, permitting consideration of the trade-offs party elites face and the selection strategies they choose across list and SMD tiers when seeking to diversify representation. From the international literature, some common candidate selection patterns emerge: candidate slates are diversifying everywhere over time, albeit unevenly; parties of the left introduce diversity earlier and in greater numbers; and ethnic minority candidates are regularly ‘sacrificial lambs’ (Lapointe et al., 2024), nominated in unwinnable SMDs, perhaps to allow parties to show symbolic commitment to diversity without disrupting existing party hierarchies or alienating unsupportive majority voters (Celis et al., 2014; Dancygier, 2017). Do the analyses we have presented align with these common threads?
We have shown that, consistent with international experience, the share of non-ethnic majority candidacies of New Zealand’s two largest parties has risen over time. New Zealand is distinctive, however, for the extent of growth in non-majority candidacies: from 17.2% in 1996 to 39.7% in 2020. This diversification of candidacies tracks growth in non-European descriptive representation fairly closely over the same period (from 15% to 36.7%), showing, overall, less leakage in the candidate-representation pipeline than might have been expected. In 2020, non-majority ethnic groups’ share of candidacies roughly aligned with their population share at the 2018 census, albeit with slight underrepresentation of the Asian category, 18 distinguishing New Zealand from many advanced democracies where substantial underrepresentation of ethnic minority groups remains. Several drivers of candidate and MP diversification are likely, including parties’ progressive use of levers provided by the MMP electoral system. In parallel, growth in the voter-eligible population of immigrant origin has both increased the supply of would-be candidates within parties and reinforced to parties the need to appeal to this part of the electorate.
Supporting findings about party responses to demographic change elsewhere (Farrer and Zingher, 2018), centre-left Labour selected a more ethnically diverse set of candidates across the whole period. In every election under study, Labour’s share of non-European candidacies (both in total and in terms of safe candidacies) was higher than National’s. The contrast is strongest in Pasifika candidacies: Labour selected more than three times as many Pasifika candidates as National over the period under study (Table 1), a dominance which aligns with strong support for Labour among Pasifika voters (Iusitini and Crothers, 2013; Vowles, 2020a). Yet, Labour also selected more Asian candidates over the period than National, despite immigration policies producing a changing population of highly educated professionals and investor migrants whose profiles more obviously align with National’s economic policy and law and order focus (Huang, 2023), which is consistent with observations in Australia (Pietsch, 2017b). Only in 2020 did the share of Asian candidates fielded by National catch up to Labour. The left thus produced more diverse candidacies, even from populations where it may have expected voter support to be weaker.
Perhaps the most striking contribution that analysis of the New Zealand case offers comes from observing the multiple, evolving, and sometimes counterproductive ways in which parties have utilised the two tiers of the mixed electoral system to achieve diversity. These practices can lead to ethnic minority candidates becoming ‘sacrificial lambs’ (Lapointe et al., 2024), despite inclusionary intentions. We first found that, while non-European candidates did receive a lower proportion of safe candidacies than European candidates, the difference was small and this finding was primarily driven by the safe list positions afforded to many non-European candidates. 19 Conversely, few receive safe district nominations. Even as dual candidacy has become the norm, 20 safe candidacies for non-European candidates therefore still more often come on the list.
This pattern aligns with the compensation hypothesis, whereby an unwinnable SMD candidacy is compensated for by a good list position (Reiser, 2014), and is consistent with concerns about electability and ‘ethnic penalties’ demonstrated in the existing literature (Doherty et al., 2019; English, 2022; Fisher et al., 2014). However, it also reflects a philosophy shared by party elites during this period that the list tier of MMP is the primary effective vehicle for ensuring a socially representative candidate slate and that nationwide ethnic representation, unencumbered by geographical accountability, should be encouraged. National context also matters: migrant-origin ethnic minority representatives undertake their roles against the backdrop of the reserved Māori seats which, despite their geographical delineation, permit and foster identity group-based representation and accountability (White, 2016). Moreover, an ‘ethnic specialist’ representational role had been foreshadowed by the Royal Commission on the Electoral System (1986) and was quickly and widely adopted by parties.
Yet, our findings also highlight risks of relying on the party list as a principal means of increasing descriptive representation. Representation via the list is unpredictable given party vote fluctuation from election to election. For instance, in 2014, the lowest-ranked Labour candidate to be elected on the list was at number 11, compared to 21 in 2011, due to Labour’s nationwide party vote dropping to historic lows. 21 National suffered a similar fate in 2020, bringing only 10 MPs off the list, compared to 15 in 2017 (Parliamentary Library, 2021), and several of these were incumbents who had lost SMDs in the large vote swing towards Labour. Consequently, National lost all but one of its Asian and Pasifika MPs.
Two elements of list composition strategy appear to drive these problems (Figures 7 and 8). First, the practice of guaranteeing high list positions to incumbents necessarily lowers the list ranking of newcomers. In practice, and especially in National, this has entailed pushing diversity down the rankings to positions more at risk under conditions of vote volatility. Second, the practice of clustering non-Māori, non-European candidates in certain parts of the list (described as ‘buckets’ in Figures 7 and 8), rather than being spread evenly throughout the list, generates additional risk. This pattern is more pronounced for National, which also has fewer non-European candidates overall. The stronger the clustering, the greater the appearance of ‘ethnic’ representatives being treated as a cohesive group, rather than as individual candidates emerging organically through party selection processes. 22 As all New Zealand parties make appeals to ethnic communities, their clear intention is to ensure candidates from diverse ethnic groups are successfully elected. However, the lower the cluster is placed, the greater the possibility that vote volatility or miscalculation of what will be an electable list position puts this diversity at risk, with consequences for descriptive representation. In elections where right-wing parties are relatively successful, parliament’s diversity could suffer, which in New Zealand’s case, could mean a decline from the highpoint of the 2020 election. The small size of New Zealand’s parliament also means clustering of non-European candidates on party lists may occur closer to the ‘danger zone’ than in other countries. Examination of list clustering by centre-right and centre-left parties in other countries, and the extent to which it impacts candidate success, would be a fruitful direction for future comparative research.
Securing safe SMD candidacies is one solution for aspiring non-majority candidates. However, the contrasting experiences of Asian and Pasifika candidates in New Zealand highlight challenges. Despite similar levels of geographic clustering, 23 during the period under analysis Asian candidates had less success, regardless of party, in securing SMD nominations (Table 4), even in safe districts with a relatively high Asian population share. By contrast, many Pasifika candidates running for Labour obtained safe SMD candidacies, primarily in South Auckland electorates with high Pasifika concentration. This difference is especially surprising if we consider that Asian communities, with their evolving voting patterns and lack of established partisanship, resemble the ‘noncaptured groups’ whose electoral support cannot be taken for granted and which Dancygier (2017) argued should therefore do better in candidate selection processes. One possible explanation for the cross-group differences in SMDs is the existence of intra-party mobilisation of the Pacific Sector within Labour and across the affiliated trade union network (Salesa, 2017), which has worked over time to secure local nominations. The strength of Te Kaunihera Māori and Labour’s Pacific Sector, in contrast to the less institutionalised Multicultural Network, and the absence of similarly institutionalised groups within National, might further explain cross-party variation in number and safety of candidate nominations. Thus, while our findings shed light on party gatekeepers’ selection strategies as they manage the two tiers of MMP, further research should examine how intra-party power politics and community mobilisation influences selection outcomes, including consideration of intersectionality and gender patterns.
Parties, we have shown, are increasingly willing to present diverse candidate slates, and New Zealand has comparatively high diversity and good rates of converting these candidacies into parliamentary representation. However, even in this relatively favourable environment, our analysis suggests there remain limits to diversity, depending on how parties navigate electoral system incentives. The party list can be a double-edged sword and is one, but clearly by no means the surest, vehicle for diversifying representation.
Supplemental Material
sj-docx-1-psx-10.1177_00323217241300028 – Supplemental material for Selecting Diversity: Ethnicity, Party Strategies and Candidate Selection in New Zealand Elections, 1996–2020
Supplemental material, sj-docx-1-psx-10.1177_00323217241300028 for Selecting Diversity: Ethnicity, Party Strategies and Candidate Selection in New Zealand Elections, 1996–2020 by Fiona Barker and Sam Crawley in Political Studies
Footnotes
Acknowledgements
The authors would like to thank Milla Batten, Alexander Maitland, Simon Forbes and Hamish Clark for their research assistance at different stages of this project. We are grateful for helpful feedback received on earlier versions of this paper, presented at the New Directions in Comparative Politics Workshop, Victoria University of Wellington (2024) and the American Political Science Association (2021), and we especially thank the anonymous reviewers for their constructive engagement and suggestions. We also acknowledge financial support for this research from the Faculty of Humanities and Social Sciences, Te Herenga Waka – Victoria University of Wellington (Faculty Research Grants 216293, 225834).
Declaration of Conflicting Interests
The author(s) declared no potential conflicts of interest with respect to the research, authorship, and/or publication of this article.
Funding
The author(s) disclosed receipt of the following financial support for the research, authorship, and/or publication of this article: The authors gratefully acknowledge funding from Te Herenga Waka – Victoria University of Wellington, Faculty of Humanities and Social Sciences: Faculty Research Grants 216293, 225834.
Supplementary Information
Additional Supplementary Information may be found with the online version of this article.
Contents 1 Ethnicity categorisation 2. Party differences in group-based candidate selection 3. Approach to coding ethnicity 3.1. Summary of ethnicity coding procedure 3.2. Summary of ethnicity coding categories Table 1: Ethnicity coding categories by party 4. Alternative hypothesis tests Table 2: Hypothesis tests for subsets of candidate data 5. Determining ‘safe’ candidacies 6. Census data Table 3: Proportions of ethnicity in the NZ population 7. Geographic concentrations of ethnicities in electorates 8. Data availability Table 4: Concentrations of ethnic groups by electorate and year 9. Percentage of safe candidacies where ‘safe’ threshold is 0.5 Figure 1: Percentage of safe candidacies over time awarded to or won by European candidates standing for National and Labour Figure 2: Percentage of safe candidacies over time awarded to or won by Asian, Māori and Pasifika candidates standing for National and Labour 10.References
Notes
Author Biographies
References
Supplementary Material
Please find the following supplemental material available below.
For Open Access articles published under a Creative Commons License, all supplemental material carries the same license as the article it is associated with.
For non-Open Access articles published, all supplemental material carries a non-exclusive license, and permission requests for re-use of supplemental material or any part of supplemental material shall be sent directly to the copyright owner as specified in the copyright notice associated with the article.